IL-4 Up-Regulates MiR-21 and the MiRNAs
Hosted in the CLCN5 Gene in Chronic
Lymphocytic Leukemia
Natalia Ruiz-Lafuente1,5☯, María-José Alcaraz-García1,5☯, Silvia Sebastián-Ruiz1,5,
Azahara-María García-Serna1,3,5, Joaquín Gómez-Espuch2,5, José-María Moraleda2,3,5,
Alfredo Minguela1,4,5, Ana-María García-Alonso1,4,5, Antonio Parrado1,5*
1Servicio de Inmunología, Hospital Clínico Universitario Virgen de la Arrixaca, Murcia, Spain,2Servicio de Hematología y Hemoterapia, Hospital Clínico Universitario Virgen de la Arrixaca, Murcia, Spain,
3Universidad de Murcia, Murcia, Spain,4Centro de Investigación Biomédica en Red de enfermedades hepáticas y digestivas, Murcia, Spain,5Instituto Murciano de Investigación Biosanitaria Virgen de la Arrixaca (IMIB-Arrixaca), Murcia, Spain
☯These authors contributed equally to this work. *[email protected]
Abstract
Interleukin 4 (IL-4) induces B-cell differentiation and survival of chronic lymphocytic leuke-mia (CLL) cells. MicroRNAs (miRNAs) regulate mRNA and protein expression, and several miRNAs, deregulated in CLL, might play roles as oncogenes or tumor suppressors. We have studied the miRNA profile of CLL, and its response to IL-4, by oligonucleotide microar-rays, resulting in the detection of a set of 129 mature miRNAs consistently expressed in CLL, which included 41 differentially expressed compared to normal B cells (NBC), and 6 significantly underexpressed in ZAP-70 positive patients. IL-4 stimulation brought about up-regulation of the 5p and 3p mature variants of the miR-21 gene, which maps immediately downstream to the VMP1 gene, and of the mature forms generated from the miR-362 (3p and 5p), miR-500a (3p), miR-502 (3p), and miR-532 (3p and 5p) genes, which map within the third intron of the CLCN5 gene. Both genes are in turn regulated by IL-4, suggesting that these miRNAs were regulated by IL-4 as passengers from their carrier genes. Their levels of up-regulation by IL-4 significantly correlated with cytoprotection. MiR-21 has been re-ported to be leukemogenic, associated to bad prognosis in CLL, and the miRNA more fre-quently overexpressed in human cancer. Up-regulation by IL-4 of miR-21 and the miRNAs hosted in the CLCN5 locus may contribute to evasion of apoptosis of CLL cells. These find-ings indicate that the IL-4 pathway and the miRNAs induced by IL-4 are promising targets for the development of novel therapies in CLL.
Introduction
The interleukin-4 (IL-4) pathway leads to maturation of B-cell precursors into immunoglobu-lin-secreting cells and antigen presenting cells, proliferation of activated B cells, and induction a11111
OPEN ACCESS
Citation:Ruiz-Lafuente N, Alcaraz-García M-J, Sebastián-Ruiz S, García-Serna A-M, Gómez-Espuch J, Moraleda J-M, et al. (2015) IL-4 Up-Regulates MiR-21 and the MiRNAs Hosted in the CLCN5 Gene in Chronic Lymphocytic Leukemia. PLoS ONE 10(4): e0124936. doi:10.1371/journal. pone.0124936
Academic Editor:Bernard Mari, IPMC, FRANCE
Received:November 18, 2014
Accepted:March 8, 2015
Published:April 24, 2015
Copyright:© 2015 Ruiz-Lafuente et al. This is an open access article distributed under the terms of the
Creative Commons Attribution License, which permits unrestricted use, distribution, and reproduction in any medium, provided the original author and source are credited.
Data Availability Statement:Datasets were deposited at the Gene Expression Omnibus database under accession number GSE62137.
of isotype switching toward IgE [1]. IL-4 protects chronic lymphocytic leukemia (CLL) cells from spontaneous apoptosis or killing with DNA damaging agents [2–5]. CLL is a B-cell malig-nant disease most prevalent in the elderly, characterized by surface expression of the CD5 and CD23 markers, and a heterogeneous clinical course, with patients divided between those that never progress to late stages of the disease, and those that progress and require therapy. Prog-nostic markers such as IGVH status and ZAP-70 and CD38 expression levels are useful to eval-uate the risk of progression [6]. Through its cytoprotective effect, the IL-4 pathway may sustain evasion of apoptosis of CLL cells, thereby contributing to leukemogenesis.
Binding of IL-4 to its surface receptor (IL-4R) induces phosphorylation of JAK1 and JAK3. JAK1 phosphorylates STAT6 which homodimerizes and enters the nucleus to regulate gene expression. JAK1 and JAK3 lead to anti-apoptotic signaling through PI3K/AKT and the mito-chondrial pathway, and through the Ras/MAPK pathway and NFκB activation [7–11]. Re-cently, we have reported gene expression changes induced by IL-4 in CLL [12], but little is known about the response to IL-4 of microRNAs (miRNAs), an essential class of gene expression regulators.
Mature miRNAs are non-coding RNAs of 19–25 nucleotides in length, generated by pro-cessing of miRNA gene transcripts called pri-miRNAs. Based on their genomic localization, miRNAs can be divided into two main classes: intergenic, that constitute independent tran-scription units, and intragenic, located inside another gene and produced as part of the host gene mRNA [13]. The pri-miRNAs are capped and polyadenylated, then cropped by the Mi-croprocessor complex, and the resulting stem-loop intermediate, called pre-miRNA, is ex-ported to the cytoplasm. The pre-miRNA is further cleaved to generate miRNA duplexes in the RNA-induced silencing complex (RISC), where one or the other strand (5p or 3p) is degraded. The remaining strand, which constitutes the mature miRNA, is retained in the RISC and will target mRNAs by base-pairing to complete or partially complementary sites on the target mRNAs, usually located at the 3’untranslated regions. As a consequence, gene expression is negatively regulated through mRNA degradation or, more commonly, translational repression. A single miRNA could repress expression of up to several hundred genes.
Deregulation of miRNAs has been implicated in human oncogenesis. In CLL, several miR-NAs have been recurrently found overexpressed compared to normal B cells (NBC), such as miR-155 [14–19], miR-150 [14,16,19], miR-101 [14,18,19], miR-21 [14,18], miR-29a [18,19], or miR-29c [16,19], or underexpressed, such as miR-181a, miR-181b [15,18,19], and miR-223 [15,16,19]. CLL patients characterized by 13q14 or 17p deletions usually underexpress miR-15a [20,21] or miR-34a [16,22–25], located at the respective deleted regions, compared to other cytogenetic subtypes. Diverse animal models have illustrated the oncogenic potential of several miRNAs, including miR-155, miR-21, miR-29a, or the miR-17~92 cluster [26–29], and the tumor suppressor potential of others, such as the miR-15a/16-1 cluster [30,31]. MiRNA signatures frequently include higher expression of miR15a, miR-16, or miR-23b in patients expressing markers of worse prognosis, such as ZAP-70 [15,24,32,33]. In ZAP-70 negative patients miR-29a, miR-29b, miR-29c and miR-223 often show higher expression lev-els [15,16,19,32,33].
Here we report the identification of miRNAs regulated by IL-4 in CLL. MiR-21, miR-362, miR-500a, miR-502, and miR-532 were induced by IL-4, likely as a consequence of up-regula-tion of their respective host genes, vacuole membrane protein 1 (VMP1), and chloride channel, voltage sensitive 5 (CLCN5). MiR-21 is the most frequently overexpressed miRNA in human cancer, and could be involved in evasion of apoptosis and resistance to chemotherapy in CLL. IL-4 could exert its anti-apoptotic function through up-regulation of miR-21 and the micro-RNAs hosted in the CLCN5 gene. These findings may be useful in the development of thera-peutic strategies targeting the IL-4 pathway in CLL.
2007-2010, Fundación Séneca, Agencia de Ciencia y Tecnología de la Región de Murcia (08721/PI/08 to AP), ISCIII Spanish Cell Therapy Network (Tercel; RD06/0010/0023 to JMM), and the CIBERehd scientific program to AM and AMGA. The funders had no role in study design, data collection and analysis, decision to publish, or preparation of the manuscript.
Methods
Sample collection
Peripheral blood samples from 16 chronic lymphocytic leukemia (CLL) patients and 3 controls with normal lymphopoiesis were obtained. The study was approved by the Review Board of Hospital Clínico Universitario Virgen de la Arrixaca, and the participants provided their writ-ten informed consent. All the patients had leukocytosis and did not receive treatment in the last 3 months prior to sample collection (S1 Table).
Cell isolation
Samples were processed to isolate the B cells by negative selection procedures which were based on cocktails containing CD2, CD16, CD36 and CD235a antibodies for depletion of T cells, NK cells, monocytes, macrophages, and erythrocytes. The RossetteSep Human B Cell En-richment Cocktail kit (StemCell Technologies, Vancouver, Canada) was suitable for CLL sam-ples, since these are rich in malignant B cells. This method is expensive but definitely
worthwhile for cell populations present at relatively high levels. Small volumes of peripheral blood (10 mL) were collected from patients, and B cell isolation was directly performed during Ficoll 1.077 g/mL centrifugation, following the manufacturer’s instructions. However, due to the low content of B cells in the peripheral blood of normal subjects (usually less than 10% of the lymphocytes), larger volumes of peripheral blood were collected (500 mL). Thus, the use of the RossetteSep kit was not economically viable for normal samples. In addition, harvest of the fine, barely visible B cell layer formed at the interphase between diluted plasma and Ficoll is usually inefficient. An alternative method, the Dynabeads Untouched Human B cells kit (Invi-trogen, Carlsbad, CA) was chosen for isolating NBC. Despite being more time consuming, this method is more efficient and less expensive. PBMC concentrates were obtained by centrifuga-tion over Ficoll, and NBC isolated using the kit, following the manufacturer’s instructions. En-richment was determined by labelling with CD19-FITC, CD3-PE, and CD5-PE-Cy7 (BD Biosciences), followed by acquisition in a FACScalibur flow cytometer (BD Biosciences), and analysis using the CellQuest software. Purity of CD19+ cells was 93.5±1.41% (mean±s.e.m.) in NBC and 97.43±0.62% in CLL, including 0.33±0.14% of CD19+CD5- potential normal B cells within the CLL fractions (range 0–1.05%). The percentage of ZAP-70 positive cells within the CD19+CD5+ fraction of CLL was determined from aliquots of peripheral blood subjected to red cell lysis, permeabilization with the Cytofix/Cytoperm kit, and labelling with CD19-FITC, ZAP-70-PE, CD5-PE-Cy7, and CD3-APC (BD Biosciences).
Cell culture and determination of apoptosis
Following purification, three fractions of the purified CLL and NBC were processed: a) at time zero (“Pre”); b) after being cultured for 18 hours in RPMI-1640 medium supplemented with 10% fetal calf serum (Cambrex, East Rutherford, NJ) (“Ctrl”); and c) as b, but with adding 10 ng/mL of human recombinant IL-4 (BD Biosciences, San Diego, CA) (“IL-4”). Apoptosis of the cultured cells was determined by dual labelling with annexin V and propidium iodide (BD Bio-sciences), and flow cytometry analysis.
RNA isolation
Only samples with R.I.N. (RNA Integrity Number)>7.0 were further studied. Though the
RNA 6000 Kit allowed to detect the presence of small RNA, this fraction was specifically ana-lysed using the Small RNA Kit.
Microarray analysis
From each RNA sample, 100 ng were labeled with cyanine 3-pCp (Cy3-pCp) using Agilent miRNA Complete Labeling and Hyb Kits, according to the manufacturer's protocol. The la-beled miRNAs were hybridized onto Human miRNA Microarray Kit (V3, 8 × 15k) targeting 866 human and 89 human viral miRNAs. After hybridization, the microarray slides were washed and scanned in an Agilent G2565CA DNA Microarray Scanner. Images were analyzed with the Agilent Feature Extraction software. The automatically generated datasets were statis-tically analyzed and visualized using the GeneSpring GX software (Agilent). The miRNAs regu-lated by IL-4 were identified using the one-way ANOVA test (p<0.05) between samples Pre,
Ctrl, and IL-4, with post hoc Tukey HSD analysis. The computation of p-values was performed using the Benjamini-Hochberg FDR correction. Those entities that passed the analysis with in-creases or dein-creases above 2-fold for comparisons IL-4 vs Pre, and IL-4 vs Ctrl concurrently and with the same direction of change were considered miRNAs regulated by IL-4. The same analyses were performed for comparisons between condition Pre vs all the others, and between condition Ctrl vs all the others. Our initial analysis performed with the first 8 patients showed that changes identified for comparison IL-4 vs all the others coincided with those identified for comparison IL-4 vs Ctrl using the Student’s t test. Though significant changes for comparison between condition Pre vs all the others were also identified (induced by cell culture), our main purpose was to identify miRNAs regulated by IL-4. For this reason, Pre sample was judged as dispensable from that time, and was not included in subsequent patients. Samples Ctrl and IL-4 from patient CLL03 did not pass the quality controls. Thus, our final analysis included 8 Pre, 15 Ctrl, and 15 IL-4 samples from 16 patients (S1 Table) and 3 paired Ctrl and IL-4 NBC sam-ples. Datasets were deposited at the Gene Expression Omnibus database under accession num-ber GSE62137. Hierarchical clustering analysis was performed using the Ward’s linkage method on euclidean distances. Fold changes of miRNAs regulated by IL-4 were compared be-tween patients by Pearson correlation analysis using SigmaStat.
Quantitative PCR (qPCR)
For miRNA expression, RNA samples were retrotranscribed with the miScript II RT Kit (Qia-gen) using the miScript HiSpec buffer for mature miRNA detection only, followed by qPCR with the miScript SYBR Green PCR Kit (Qiagen) in an ABI Prism 7000 Sequence Detection System, using the miScript primer assays (Qiagen) for miR-21-3p, miR-362-3p, miR-362-5p, miR-500a-3p, miR-502-3p, miR-532, miR-532-3p, and RNU6-6P, the latter used as reference for normalization (cat. nos. MS00009086, MS00009562, MS00009569, MS00031920,
include the mRNA and miRNA fractions, GAPDH was also used for miRNA normalization. Next, the averageΔCt value for the Ctrl samples was subtracted from all theΔCt values, result-ing in theΔΔCt values. Finally, the relative expression values, expressed as fold change com-pared to the average Ctrl samples, were generated using the formula 2−ΔΔCt. Individual fold changes for IL-4 samples compared to Pre and Ctrl samples were calculated as the ratios be-tween their respective relative expression values.
Semiquantitative RT-PCR
The levels of expression of VMP1 were measured using the GeneAmp RNA PCR Core Kit in a GeneAmp PCR System 9700 (both from Thermo Fisher Scientific), following the manufactur-er’s instructions. First, RNA samples were retrotranscribed using random hexamers. Then, VMP1 sequences were amplified from the resulting RNA/cDNA hybrids using as primers the 5’-TTGTCCAGATGAAGAGGGCA-3’and 5’-TCAAACATCCAGGACAACCAGT-3’ oligo-nucleotides, that map at exon 6 and exon 12, respectively, and 30 cycles of PCR. As reference, GAPDH sequences were amplified using the 5’-TCATGACCACAGTCCATGCC- 3’and 5’ -CATGAGGTCCACCACCCTGT-3’oligonucleotides and 23 cycles of PCR. The amplified fragments were visualized following electrophoresis in agarose gels containing SYBR Safe stain (Thermo Fisher Scientific).
Results
MiRNA expression profile of CLL
To define the set of miRNAs significantly expressed in CLL, we examined the cumulative dis-tributions of mature miRNAs according to their signal intensity values in the arrays performed from the 8 Pre, 15 Ctrl, and 15 IL-4 CLL samples, which described an abrupt rise between the intensity values of−9 and−7, then a plateau up to−4, and a slow increase between−3 and 9
(S1 Fig). The cumulative distribution for the 3 Ctrl and 3 IL-4 NBC samples followed the same description with slight differences (S1 Fig). The absence of miRNAs significantly expressed be-tween intensity levels of−7 and−4 led us to choose−4 as a positivity cut-off, which defined
129 and 149 miRNAs as significantly expressed in CLL (S2 Table) and NBC (S3 Table), respec-tively. Both lists share similarities, including the same top 10 miRNAs: miR-150-5p, miR-142-3p, miR-29a-miR-142-3p, miR-21-5p, miR-16-5p, let-7g-5p, miR-29b-miR-142-3p, let-7f-5p, miR-29c-miR-142-3p, and let-7a-5p. However, 41 miRNAs were differentially expressed between CLL and NBC according to the Student t test (cut-off 2-fold, p<0.05), being 29 overexpressed in CLL, including
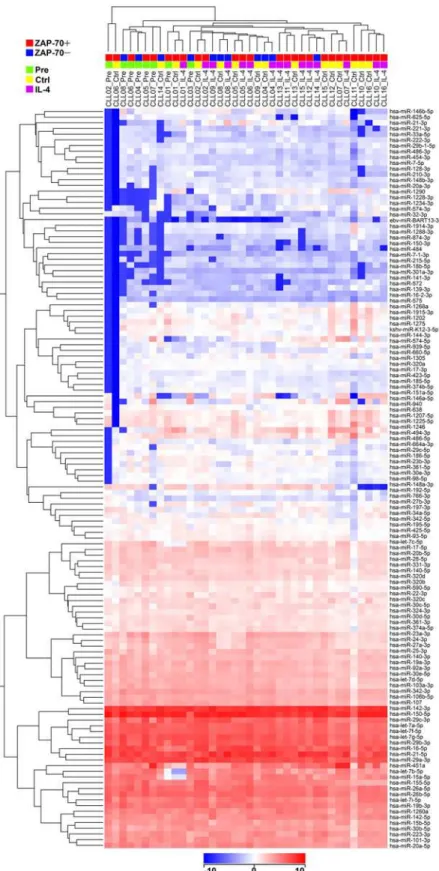
miR-150-5p, miR-29a-3p, miR-29b-3p, let-7a-5p, miR-26a-5p, miR-451a, miR-155-5p, miR-101-3p, miR-28-5p, miR-144-5p, miR-486-5p, or miR-486-miR-101-3p, and 12 underexpressed, including 181a-5p, 222-3p, 126-3p, 365a-3p, 181b-5p, 199a-3p, or miR-582-5p (Table 1). Hierarchical clustering analysis using conditions Pre, Ctrl, and IL-4, and the 129 miRNAs expressed in CLL, tended to segregate samples Pre from samples Ctrl and IL-4, and within the two latter, ZAP-70 positive from ZAP-70 negative (Fig 1). Moreover, compari-son between ZAP-70 positive (n = 11) and negative (n = 5) patients by the Student t test (p<0.05) using the mean values of all the available samples from each patient, revealed a set of
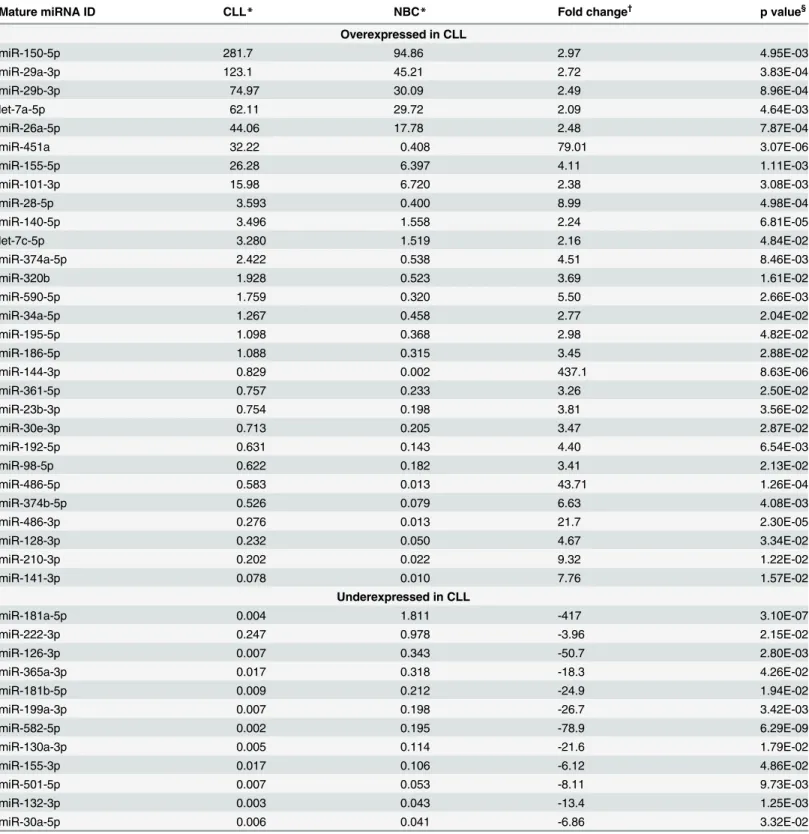
Table 1. MiRNAs diferentially expressed in CLL and NBC.
Mature miRNA ID CLL* NBC* Fold change†
p value§
Overexpressed in CLL
miR-150-5p 281.7 94.86 2.97 4.95E-03
miR-29a-3p 123.1 45.21 2.72 3.83E-04
miR-29b-3p 74.97 30.09 2.49 8.96E-04
let-7a-5p 62.11 29.72 2.09 4.64E-03
miR-26a-5p 44.06 17.78 2.48 7.87E-04
miR-451a 32.22 0.408 79.01 3.07E-06
miR-155-5p 26.28 6.397 4.11 1.11E-03
miR-101-3p 15.98 6.720 2.38 3.08E-03
miR-28-5p 3.593 0.400 8.99 4.98E-04
miR-140-5p 3.496 1.558 2.24 6.81E-05
let-7c-5p 3.280 1.519 2.16 4.84E-02
miR-374a-5p 2.422 0.538 4.51 8.46E-03
miR-320b 1.928 0.523 3.69 1.61E-02
miR-590-5p 1.759 0.320 5.50 2.66E-03
miR-34a-5p 1.267 0.458 2.77 2.04E-02
miR-195-5p 1.098 0.368 2.98 4.82E-02
miR-186-5p 1.088 0.315 3.45 2.88E-02
miR-144-3p 0.829 0.002 437.1 8.63E-06
miR-361-5p 0.757 0.233 3.26 2.50E-02
miR-23b-3p 0.754 0.198 3.81 3.56E-02
miR-30e-3p 0.713 0.205 3.47 2.87E-02
miR-192-5p 0.631 0.143 4.40 6.54E-03
miR-98-5p 0.622 0.182 3.41 2.13E-02
miR-486-5p 0.583 0.013 43.71 1.26E-04
miR-374b-5p 0.526 0.079 6.63 4.08E-03
miR-486-3p 0.276 0.013 21.7 2.30E-05
miR-128-3p 0.232 0.050 4.67 3.34E-02
miR-210-3p 0.202 0.022 9.32 1.22E-02
miR-141-3p 0.078 0.010 7.76 1.57E-02
Underexpressed in CLL
miR-181a-5p 0.004 1.811 -417 3.10E-07
miR-222-3p 0.247 0.978 -3.96 2.15E-02
miR-126-3p 0.007 0.343 -50.7 2.80E-03
miR-365a-3p 0.017 0.318 -18.3 4.26E-02
miR-181b-5p 0.009 0.212 -24.9 1.94E-02
miR-199a-3p 0.007 0.198 -26.7 3.42E-03
miR-582-5p 0.002 0.195 -78.9 6.29E-09
miR-130a-3p 0.005 0.114 -21.6 1.79E-02
miR-155-3p 0.017 0.106 -6.12 4.86E-02
miR-501-5p 0.007 0.053 -8.11 9.73E-03
miR-132-3p 0.003 0.043 -13.4 1.25E-03
miR-30a-5p 0.006 0.041 -6.86 3.32E-02
*Relative mean values of 16 CLL and 3 NBC cases, whose values were calculated as the mean of all available samples (Pre, Ctrl, IL-4), except in the case of miRNAs modulated by IL-4, where these samples were excluded.
†CLL vs NBC.
§Student t test CLL vs NBC.
Fig 1. Hierarchical clustering analysis on the 129 miRNAs expressed in CLL using all the CLL samples.Microarray analysis was performed in 16 CLL patients, using different conditions: Pre (n = 8), Ctrl (n = 15), and IL-4 (n = 15), being all the Ctrl and IL-4 samples paired. The ZAP-70 status of the patients, positive (n = 11) and negative (n = 5), and the conditions of the samples, are indicated on the top. The relative levels of expression of miRNAs are depicted according to the shown log2color scale on the bottom.
ordered according to their levels of expression (Fig 1). The 5p and 3p variants of a miRNA were often expressed at divergent levels and grouped in different sets, as is the case for miR-150-5p and miR-150-3p, or miR-21-5p and miR-21-3p. From the miR-17~92 cluster, miR-17-5p, miR-19a-3p, miR-19b-3p, miR-20a-miR-17-5p, and miR-92a-3p were expressed at high levels, and miR-17-3p, and miR-20a-3p, at low levels. However, it was not a rule, since there were exam-ples of paired 5p and 3p miRNAs expressed at similar levels, such as 142-3p and miR-142-5p, or miR-140-3p and miR-140-5p.
Correlations between miRNAs and spontaneous apoptosis induced by
cell culture
The levels of spontaneous apoptosis (Ctrl samples) and following IL-4 treatment were mea-sured in 13 out of the 16 patients studied by microarray. The percentages of apoptotic cells were 28.9±4.01 (mean±s.e.m.) for Ctrl samples and 8.87±1.04 for IL-4 samples. The relation-ship between spontaneous apoptosis and baseline miRNA expression was examined by Pearson correlation analysis, resulting in significant negative correlations for 29 miRNAs, most of them expressed at high levels, including miR-29a-3p, let-7g-5p, miR-29b-3p, let-7f-5p, let-7a-5p, miR-26b-5p, miR-19b-3p, or miR-155-5p, and positive correlations for 9 miRNAs, all of them expressed at low levels, including miR-1246, or miR-638 (S4 Table). These results suggest that both groups may play anti- or pro-apoptotic roles, respectively. The ANOVA test with post hoc analysis for condition Pre vs conditions Ctrl and IL-4 (cut-off 2-fold, p<0.05) using all the
available microarray experiments from the 16 patients, identified 12 mature miRNAs up-regu-lated by cell culture in CLL (S5 Table). From this list, miR-1246 and miR-1290 were positively correlated with spontaneous apoptosis, further suggesting that they are candidates to play pro-apoptotic roles in CLL.
Identification of miRNA changes induced by IL-4 in CLL
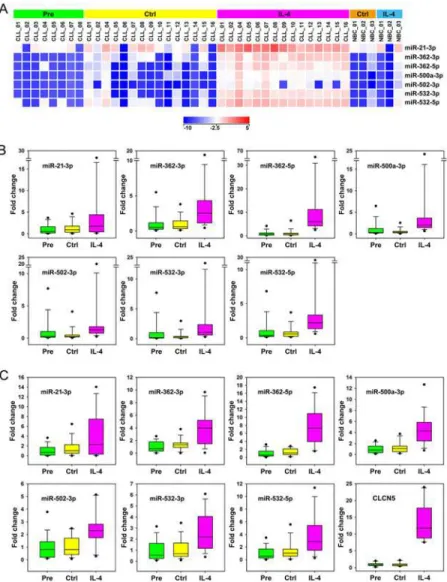
The ANOVA test with post hoc analysis for condition IL-4 vs conditions Pre and Ctrl identi-fied 7 mature miRNAs regulated by IL-4 in CLL (Fig 2AandS6 Table): miR-21-3p, miR-362-3p, miR-362-5p, miR-500a-miR-362-3p, miR-502-miR-362-3p, miR-532-miR-362-3p, and miR-532-5p, all of them higher than 10-fold up-regulated on average. An identical set of 7 miRNAs had emerged in our first analysis, restricted to the 7 patients for which paired samples Pre, Ctrl and IL-4 were available (data not shown). Student paired t test for comparison IL-4 vs Ctrl (n = 15) identified an iden-tical set of miRNAs and added to the list miR-21-5p (2.05-fold up-regulated), and miR-630 (9.95-fold down-regulated) (S6 Table). The latter was 94.6-fold higher for comparison Ctrl vs
Table 2. MiRNAs diferentially expressed in ZAP-70 positive and negative patients.
Mature miRNA ID ZAP-70 Pos* ZAP-70 Neg* Fold change†
p value§
hsa-miR-29c-3p 53.79 93.01 -1.73 4.7E-02
hsa-miR-30b-5p 11.98 17.93 -1.50 2.0E-02
hsa-miR-320b 1.740 2.418 -1.39 4.6E-02
hsa-miR-29c-5p 0.473 1.102 -2.33 8.3E-03
hsa-miR-146b-5p 0.184 1.464 -7.96 1.3E-02
hsa-miR-210-3p 0.144 0.432 -3.01 4.7E-02
*Relative mean values of 11 ZAP-70 Pos and 5 ZAP-70 Neg cases, whose values were calculated as the mean of all available samples (Pre, Ctrl, IL-4).
†ZAP-70 Pos vs ZAP-70 Neg.
§Student t test ZAP-70 Pos vs ZAP-70 Neg.
Pre, suggesting that IL-4, rather than inducing miR-630, partially counteracted its spontane-ously induced up-regulation during cell culture. MiR-21 maps several hundred base pairs downstream of the last exon of VMP1, and miR-362, miR-500a, miR-502, and miR-532 within the third intron of CLCN5. Both are genes regulated by IL-4 according to our previous study [12], suggesting that regulation by IL-4 of these miRNAs is linked to that of their carrier genes. In general, their levels of change significantly correlated with each other (Table 3). In NBC, the whole set was up-regulated by IL-4 in 1 out of 3 cases (NBC_03) and miR-21-3p in another case (NBC_01) (Fig 2A).
Fig 2. Identification of the miRNAs regulated by IL-4 in CLL.(A) Heat maps for expression of miRNAs significantly regulated by IL-4 in CLL (n = 15) following one-way ANOVA with Tukey HSD post hoc analysis for comparison of condition IL-4 vs Pre and Ctrl and above 2-fold change for both comparisons (p<0.05).
Three NBC samples were included as controls. Relative expression levels are depicted according to the shown log2color scale. (B, C) Validation of miRNAs regulated by IL-4 in CLL by qPCR, using RNU6-6P (B)
and GAPDH (C) as references. Box whiskers representations of qPCR validations of the set of 7 miRNAs regulated by IL-4 in CLL are shown. Validation of up-regulation of the carrier gene CLCN5 by IL-4 in CLL, using GAPDH as reference, is included in C (right bottom panel). QPCR data are expressed as fold changes. For each assay, the average of Pre samples was set as 1. MiRNAs are ordered alphabetically.
Validation of miRNAs and carrier genes regulated by IL-4 identified by
microarray analysis
The miRNAs regulated by IL-4 were assayed by qPCR, using RNU6-6P (Fig 2B) and GAPDH (Fig 2C) as references. ANOVA analysis for comparison of condition IL-4 vs conditions Pre and Ctrl confirmed the significant up-regulation of all the miRNAs included in this set (p<0.05, data not shown). The commercial qPCR assays used in this study confirmed
up-regu-lation of CLCN5 by IL-4 in CLL (Fig 2C, right bottom panel), though not that of VMP1 (data not shown). Validation of VMP1 up-regulation by IL-4 in CLL was achieved by means of a semiquantitative RT-PCR assay (Fig 3).
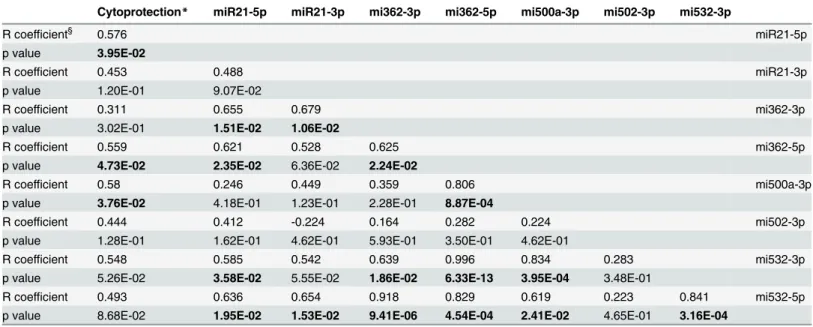
Table 3. Correlations between the levels of cytoprotection and the amount of change in the levels of miRNAs by IL-4, and between the changes in the miRNAs with each other.
Cytoprotection* miR21-5p miR21-3p mi362-3p mi362-5p mi500a-3p mi502-3p mi532-3p
R coefficient§ 0.576 miR21-5p
p value 3.95E-02
R coefficient 0.453 0.488 miR21-3p
p value 1.20E-01 9.07E-02
R coefficient 0.311 0.655 0.679 mi362-3p
p value 3.02E-01 1.51E-02 1.06E-02
R coefficient 0.559 0.621 0.528 0.625 mi362-5p
p value 4.73E-02 2.35E-02 6.36E-02 2.24E-02
R coefficient 0.58 0.246 0.449 0.359 0.806 mi500a-3p
p value 3.76E-02 4.18E-01 1.23E-01 2.28E-01 8.87E-04
R coefficient 0.444 0.412 -0.224 0.164 0.282 0.224 mi502-3p
p value 1.28E-01 1.62E-01 4.62E-01 5.93E-01 3.50E-01 4.62E-01
R coefficient 0.548 0.585 0.542 0.639 0.996 0.834 0.283 mi532-3p
p value 5.26E-02 3.58E-02 5.55E-02 1.86E-02 6.33E-13 3.95E-04 3.48E-01
R coefficient 0.493 0.636 0.654 0.918 0.829 0.619 0.223 0.841 mi532-5p
p value 8.68E-02 1.95E-02 1.53E-02 9.41E-06 4.54E-04 2.41E-02 4.65E-01 3.16E-04
*Cytoprotection was calculated as the difference in apoptosis between conditions IL-4 vs Ctrl (n = 13)
§Pearson correlation analysis using fold changes between conditions IL-4 vs Ctrl expressed as log
2values; p values of less than 0.05 are typed in
bold characters
doi:10.1371/journal.pone.0124936.t003
Fig 3. Validation of up-regulation of the carrier gene VMP1 by IL-4 in CLL.Two of the CLL patients, CLL06 and CLL14, were assayed by a semiquantitative RT-PCR assay. GAPDH was used as reference. The size of the molecular weight markers (M) is indicated to the left. The size of the expected PCR fragments were 606 bp for VMP1 and 464 bp for GAPDH.
Correlations between ZAP-70 status, miRNA regulation by IL-4, and
apoptosis
Correlation analyses between the levels of change of each miRNA and the baseline levels of ex-pression of ZAP-70, and CD38, were performed to determine whether the miRNA response to IL-4 was related to CLL prognostic markers, but no significant correlations were found (data not shown). In contrast, the levels of cytoprotection correlated significantly with the levels of change of miR-21-5p, miR-362-5p, and miR-500a-3p (Table 3), providing additional evidence to suggest that these miRNAs could play a role in the anti-apoptotic response induced by IL-4 in CLL.
Discussion
IL-4 is a key survival signal provided to CLL cells by the microenvironment. IL-4 induces pro-found gene and protein expression changes, which confer cytoprotection against cell death in-duced spontaneously or by cytotoxic drugs. Here, we have studied how IL-4 affects miRNA expression, an essential regulatory component of gene and protein expression regulation, which may help to understand the mechanisms sustaining CLL pathogenesis. By the use of a microarray platform which allows measuring the levels of expression of 955 mature miRNAs, we first identified 129 miRNAs expressed at significant levels in CLL. The miRNAs expressed at the highest levels coincided with those reported by previous studies, and were similar to those expressed by NBC in our study, though several divergences emerged between CLL and NBC, such as the previously reported overexpression of miR-150-5p, miR-29a-3p, miR-155-5p, or miR-101-3p, underexpression of miR-181a-miR-155-5p, or miR-181b-5p [14–19], and others not firmly established yet, including the highly divergent 451a, 28-5p, 144-5p, miR-486-5p, or miR-486-3p, within the overexpressed, and miR-126-3p, miR-365a-3p, miR-199a-3p, or miR-582-5p, within the underexpressed.
Hierarchical clustering analysis grouped the Pre samples together, and Ctrl and IL-4 sam-ples mixed, illustrating that cell culture on its own induces changes, as previously observed for gene expression [12]. Mixed Ctrl and IL-4 samples moderately grouped according to ZAP-70 status, indicating that this marker has a broad impact on miRNA expression in CLL. This is substantiated by differential expression of several miRNAs according to ZAP-70 status, includ-ing both the 3p and 5p variants of miR-29c, which is recurrently found down-regulated in ZAP-70 positive patients, 146b-5p, as in the recent study by Negrini et al [25], and miR-210-3p. These results support their potential use as prognostic biomarkers.
Correlation analysis between the baseline levels of miRNAs and spontaneous apoptosis indi-cated a relatively high number of candidate miRNAs with a potential anti-apoptotic or pro-apo-ptotic function. From this list, most miRNAs need functional validation, using a similar approach as that provided for the cytoprotective effects of miR-17-5p in the study by Bomben et al [35]. IL-4 is a strong anti-apoptotic stimulus for CLL cells, and the responsible mechanism has not been elucidated yet, though gene expression changes are likely involved. Many genes regulated by IL-4 have been proposed as potentially involved [12], though most of them will also require direct assessment. Because miRNAs control gene expression, it is possible that miR-NAs regulated by IL-4 contribute to gene expression changes and to the anti-apoptotic function. We have found up-regulation of 21 (5p and 3p), 362 (3p and 5p), 500a-3p, miR-502-3p, and miR-532 (3p and 5p) by IL-4 in CLL. All these miRNAs were also up-regulated in at least 1 out of 3 NBC, indicating that their regulation by IL-4 is not restricted to CLL cells.
miR-21 transcripts, a pri-miR-21 arising from the miR-21 promoter located at the last introns of the VMP1 gene, and a VMP1-miR-21 transcript arising from the VMP1 promoter, both of which bypass the polyadenylation signals of VMP1 [38]. Because expression of VMP1 is induced by IL-4 [12], miR-21 up-regulation by IL-4 is likely produced through VMP1-miR-21 transcrip-tion. Concomitant up-regulation by IL-4 of the miRNAs comprised at the third exon of the CLCN5 gene suggests that they were likely produced also, rather than through transcription from their own promoters, as a consequence of being embedded within the CLCN5 primary transcript, another gene previously found up-regulated by IL-4 in CLL and NBC [12]. Thereaf-ter, these primary transcripts would be successfully processed to produce the mature miRNAs.
MiR-21 is the miRNA most recurrently found overexpressed in human cancer [39], and its oncogenic role has been proven [27]. It has been found overexpressed in CLL [14,18], in associ-ation with promoter hypomethylassoci-ation [40]. High level of expression of miR-21 associates to worse prognosis and chemotherapy resistance in CLL [41,42] and in cancer in general [43]. At the cellular level, an anti-apoptotic role has been proposed for miR-21, through repression of diverse pro-apoptotic targets, including PDCD4 and PTEN, resulting in activation of anti-apo-ptotic pathways such as Ras and NFκB [44]. Our data showed that 21-5p and some miR-NAs hosted in the CLCN5 gene were significantly correlated to cytoprotection by IL-4 in CLL, further indicating these miRNAs as candidates to prevent cell death. This hypothesis should be directly assessed in future studies. Some of the miRNAs hosted in the CLCN5 gene have also been related to cancer, e.g., high expression of miR-362 is associated to worse prognosis and apoptosis resistance in colorectal and gastric cancer [45,46], that of miR-500a to hepatocellular carcinoma [47], and that of miR-502 to diverse types of cancer through a polymorphism in its target gene SET8 [48], and to colon cancer by inhibiting autophagy [49].
In summary, the present study identifies the miRNAs regulated by IL-4 in CLL and the probable responsible mechanism, contributing to the understanding of the anti-apoptotic re-sponse to IL-4, which could be relevant in evasion of apoptosis of CLL cells, resistance to che-motherapy, and leukemogenesis. Our data indicate that the IL-4 pathway and the miRNAs induced by IL-4 are promising targets for the development of novel therapies in CLL.
Supporting Information
S1 Fig. Cumulative distributions of mature miRNAs according to their signal intensity val-ues.Microarrays performed on CLL and NBC were analysed with the flag“detected”set at
“higher than 75%”. The absence of miRNAs significantly expressed between intensity levels of
−7 and−4 led us to exclude values inferior to−7 as not distinguishable from background, and
to choose−4 as a positivity cut-off, which defined 129 and 149 miRNAs as significantly
ex-pressed in CLL and NBC. (TIF)
S1 Table. Characteristics of CLL patients. (XLSX)
S2 Table. MiRNAs expressed in CLL patients. (XLSX)
S3 Table. MiRNAs expressed in NBC. (XLSX)
S4 Table. Correlations between baseline expression of miRNAs and the levels of spontane-ous apoptosis in CLL.
S5 Table. MiRNA changes induced by cell culture not counteracted by IL-4 in CLL. (XLSX)
S6 Table. MiRNA changes induced by IL-4 in CLL, and comparison with changes in NBC. (XLSX)
Author Contributions
Conceived and designed the experiments: NRL MJAG AP. Performed the experiments: NRL MJAG SSR AMGS AM AP. Analyzed the data: NRL MJAG AP. Contributed reagents/materi-als/analysis tools: JGE JMM AMGA. Wrote the paper: AP.
References
1. Okada H, Banchereau J, Lotze MT. Interleukin-4. In Thompson AW, Lotze MT, editors. The Cytokine Handbook, Vol. I. London: Academic Press; 2003. pp 227–262.
2. Dancescu M, Rubio-Trujillo M, Biron G, Bron D, Delespesse G, Sarfati M. Interleukin 4 protects chronic lymphocytic leukemic B cells from death by apoptosis and upregulates Bcl-2 expression. J Exp Med. 1992; 176: 1319–1326. PMID:1402678
3. Douglas RS, Capocasale RJ, Lamb RJ, Nowell PC, Moore JS. Chronic lymphocytic leukemia B cells are resistant to the apoptotic effects of Transforming Growth Factor-β. Blood. 1997; 89: 941–947.
PMID:9028325
4. Coscia M, Pantaleoni F, Riganti C, Vitale C, Rigoni M, Peola S, et al. IGHV unmutated CLL B cells are more prone to spontaneous apoptosis and subject to environmental prosurvival signals than mutated CLL B cells. Leukemia. 2011; 25: 828–837. doi:10.1038/leu.2011.12PMID:21372840
5. Steele AJ, Prentice AG, Cwynarski K, Hoffbrand AV, Hart SM, Lowdell MW, et al. The JAK3-selective inhibitor PF-956980 reverses the resistance to cytotoxic agents induced by interleukin-4 treatment of chronic lymphocytic leukemia cells: potential for reversal of cytoprotection by the microenvironment. Blood. 2010; 116: 4569–4577. doi:10.1182/blood-2009-09-245811PMID:20716767
6. Chiorazzi N. Implications of new prognostic markers in chronic lymphocytic leukemia. Hematology Am Soc Hematol Educ Program. 2012; 2012: 76–87. doi:10.1182/asheducation-2012.1.76PMID: 23233564
7. Zamorano J, Mora AL, Boothby M, Keegan AD. NF-kappa B activation plays an important role in the IL-4-induced protection from apoptosis. Int Immunol. 2001; 13: 1479–1487. PMID:11717189
8. Furman RR, Asgary Z, Mascarenhas JO, Liou HC, Schattner EJ. Modulation of NF-kappa B activity and apoptosis in chronic lymphocytic leukemia B cells. J Immunol. 2000; 164: 2200–2206. PMID: 10657675
9. Cuní S, Pérez-Aciego P, Pérez-Chacón G, Vargas JA, Sánchez A, Martín-Saavedra FM, et al. A sus-tained activation of PI3K/NF-kappaB pathway is critical for the survival of chronic lymphocytic leukemia B cells. Leukemia. 2004; 18: 1391–1400. PMID:15175625
10. Thieu VT, Nguyen ET, McCarthy BP, Bruns HA, Kapur R, Chang CH, et al. IL-4-stimulated NF-kappaB activity is required for Stat6 DNA binding. J Leukoc Biol. 2007; 82: 370–379. PMID:17513694
11. Bhattacharya N, Reichenzeller M, Caudron-Herger M, Haebe S, Brady N, Diener S, et al. Loss of coop-erativity of secreted CD40L and increased dose-response to IL4 on CLL cell viability correlates with en-hanced activation of NF-kB and STAT6. Int J Cancer. 2015; 136: 65–73. doi:10.1002/ijc.28974PMID: 24828787
12. Ruiz-Lafuente N, Alcaraz-García MJ, Sebastián-Ruiz S, Gómez-Espuch J, Funes C, Moraleda JM, et al. The gene expression response of chronic lymphocytic leukemia cells to IL-4 is specific, depends on ZAP-70 status and is differentially affected by an NFκB inhibitor. PLoS ONE. 2014; 9: e109533. doi: 10.1371/journal.pone.0109533PMID:25280001
13. Di Leva G, Garofalo M, Croce CM. MicroRNAs in cancer. Annu Rev Pathol. 2014; 9: 287–314. doi:10. 1146/annurev-pathol-012513-104715PMID:24079833
14. Fulci V, Chiaretti S, Goldoni M, Azzalin G, Carucci N, Tavolaro S, et al. Quantitative technologies estab-lish a novel microRNA profile of chronic lymphocytic leukemia. Blood. 2007; 109: 4944–4451. PMID: 17327404
16. Lawrie CH, Ballabio E, Dyar OJ, Jones M, Ventura R, Chi J, et al. MicroRNA expression in chronic lym-phocytic leukaemia. Br J Haematol. 2009; 147: 398–402. doi:10.1111/j.1365-2141.2009.07857.x
PMID:19681887
17. Vargova K, Curik N, Burda P, Basova P, Kulvait V, Pospisil V, et al. MYB transcriptionally regulates the miR-155 host gene in chronic lymphocytic leukemia. Blood. 2011; 117: 3816–3825. doi:10.1182/ blood-2010-05-285064PMID:21296997
18. Zhu DX, Zhu W, Fang C, Fan L, Zou ZJ, Wang YH, et al. MiR-181a/b significantly enhances drug sensi-tivity in chronic lymphocytic leukemia cells via targeting multiple anti-apoptosis genes. Carcinogenesis. 2012; 33: 1294–1301. doi:10.1093/carcin/bgs179PMID:22610076
19. Li S, Moffett HF, Lu J, Werner L, Zhang H, Ritz J, et al. MicroRNA expression profiling identifies activat-ed B cell status in chronic lymphocytic leukemia cells. PLoS ONE. 2011; 6: e16956. doi:10.1371/ journal.pone.0016956PMID:21408091
20. Smonskey MT, Block AW, Deeb G, Chanan-Khan AA, Bernstein ZP, Miller KC, et al. Monoallelic and biallelic deletions of 13q14.3 in chronic lymphocytic leukemia: FISH vs miRNA RT-qPCR detection. Am J Clin Pathol. 2012; 137: 641–646. doi:10.1309/AJCPP31FSSRQTTAQPMID:22431542
21. Rodríguez AE, Hernández JÁ, Benito R, Gutiérrez NC, García JL, Hernández-Sánchez M, et al. Molec-ular characterization of chronic lymphocytic leukemia patients with a high number of losses in 13q14. PLoS ONE. 2012; 7: e48485. doi:10.1371/journal.pone.0048485PMID:23152777
22. Dijkstra MK, van Lom K, Tielemans D, Elstrodt F, Langerak AW, van 't Veer MB, et al. 17p13/TP53 dele-tion in B-CLL patients is associated with microRNA-34a downreguladele-tion. Leukemia. 2009; 23: 625–
627. doi:10.1038/leu.2008.264PMID:18818704
23. Zenz T, Mohr J, Eldering E, Kater AP, Bühler A, Kienle D, et al. MiR-34a as part of the resistance net-work in chronic lymphocytic leukemia. Blood. 2009; 113: 3801–3808. doi: 10.1182/blood-2008-08-172254PMID:18941118
24. Mraz M, Malinova K, Kotaskova J, Pavlova S, Tichy B, Malcikova J, et al. MiR-34a, 29c and miR-17-5p are downregulated in CLL patients with TP53 abnormalities. Leukemia. 2009; 23: 1159–1163.
doi:10.1038/leu.2008.377PMID:19158830
25. Negrini M, Cutrona G, Bassi C, Fabris S, Zagatti B, Colombo M, et al. MicroRNAome expression in chronic lymphocytic leukemia: comparison with normal B cell subsets and correlations with prognostic and clinical parameters. Clin Cancer Res. 2014; 20: 4141–4153. doi: 10.1158/1078-0432.CCR-13-2497PMID:24916701
26. Costinean S, Zanesi N, Pekarsky Y, Tili E, Volinia S, Heerema N, et al. Pre-B cell proliferation and lym-phoblastic leukemia/high-grade lymphoma in E(mu)-miR155 transgenic mice. Proc Natl Acad Sci USA. 2006; 103: 7024–7029. PMID:16641092
27. Medina PP, Nolde M, Slack FJ. OncomiR addiction in an in vivo model of microRNA-21-induced pre-B-cell lymphoma. Nature. 2010: 467: 86–90. doi:10.1038/nature09284PMID:20693987
28. Santanam U, Zanesi N, Efanov A, Costinean S, Palamarchuk A, Hagan JP, et al. Chronic lymphocytic leukemia modeled in mouse by targeted miR-29 expression. Proc Natl Acad Sci USA. 2010; 107: 12210–12215. doi:10.1073/pnas.1007186107PMID:20566844
29. Sandhu SK, Fassan M, Volinia S, Lovat F, Balatti V, Pekarsky Y, et al. B-cell malignancies in microRNA Eμ-miR-17~92 transgenic mice. Proc Natl Acad Sci USA. 2013; 110: 18208–18213. doi:10.1073/pnas. 1315365110PMID:24145403
30. Raveche ES, Salerno E, Scaglione BJ, Manohar V, Abbasi F, Lin YC, et al. Abnormal microRNA-16 locus with synteny to human 13q14 linked to CLL in NZB mice. Blood. 2007; 109: 5079–5086. PMID: 17351108
31. Klein U, Lia M, Crespo M, Siegel R, Shen Q, Mo T, et al. The DLEU2/miR-15a/16-1 cluster controls B cell proliferation and its deletion leads to chronic lymphocytic leukemia. Cancer Cell. 2010; 17: 28–40.
doi:10.1016/j.ccr.2009.11.019PMID:20060366
32. Calin GA, Ferracin M, Cimmino A, Di Leva G, Shimizu M, Wojcik SE, et al. A MicroRNA signature asso-ciated with prognosis and progression in chronic lymphocytic leukemia. N Engl J Med. 2005; 353: 1793–1801. PMID:16251535
33. Papakonstantinou N, Ntoufa S, Chartomatsidou E, Papadopoulos G, Hatzigeorgiou A, Anagnostopou-los A, et al. Differential microRNA profiles and their functional implications in different immunogenetic subsets of chronic lymphocytic leukemia. Mol Med. 2013; 19: 115–123. doi:10.2119/molmed.2013. 00005PMID:23615967
35. Bomben R, Gobessi S, Dal Bo M, Volinia S, Marconi D, Tissino E, et al. The miR-17*92 family
regu-lates the response to Toll-like receptor 9 triggering of CLL cells with unmutated IGHV genes. Leukemia. 2012; 26: 1584–1593. doi:10.1038/leu.2012.44PMID:22343732
36. Lu TX, Munitz A, Rothenberg ME. MicroRNA-21 is up-regulated in allergic airway inflammation and reg-ulates IL-12p35 expression. J Immunol. 2009; 182: 4994–5002. doi:10.4049/jimmunol.0803560PMID: 19342679
37. Thapa DR, Bhatia K, Bream JH, D’Souza G, Rinaldo CR, Wolinsky S, et al. B-cell activation induced microRNA-21 is elevated in circulating B cells preceding the diagnosis of AIDS-related non-Hodgkin lymphomas. AIDS. 2012; 26: 1177–1180. doi:10.1097/QAD.0b013e3283543e0ePMID:22487708
38. Ribas J, Ni X, Castanares M, Liu MM, Esopi D, Yegnasubramanian S, et al. A novel source for miR-21 expression through the alternative polyadenylation of VMP1 gene transcripts. Nucleic Acids Res. 2012; 40: 6821–6833. doi:10.1093/nar/gks308PMID:22505577
39. Pan X, Wang ZX, Wang R. MicroRNA-21: a novel therapeutic target in human cancer. Cancer Biol Ther. 2010; 10: 1224–1232. PMID:21139417
40. Baer C, Claus R, Frenzel LP, Zucknick M, Park YJ, Gu L, et al. Extensive promoter DNA hypermethyla-tion and hypomethylahypermethyla-tion is associated with aberrant microRNA expression in chronic lymphocytic leu-kemia. Cancer Res. 2012; 72: 3775–3785. PMID:22710432
41. Rossi S, Shimizu M, Barbarotto E, Nicoloso MS, Dimitri F, Sampath D, et al. MicroRNA fingerprinting of CLL patients with chromosome 17p deletion identify a miR-21 score that stratifies early survival. Blood. 2010; 116: 945–952. doi:10.1182/blood-2010-01-263889PMID:20393129
42. Ferracin M, Zagatti B, Rizzotto L, Cavazzini F, Veronese A, Ciccone M, et al. MicroRNAs involvement in fludarabine refractory chronic lymphocytic leukemia. Mol Cancer. 2010; 9: 123. doi: 10.1186/1476-4598-9-123PMID:20504344
43. Wang W, Li J, Zhu W, Gao C, Jiang R, Li W, et al. MicroRNA-21 and the clinical outcomes of various carcinomas: a systematic review and meta-analysis. BMC Cancer. 2014; 14: 819. doi: 10.1186/1471-2407-14-819PMID:25376700
44. Buscaglia LE, Li Y. Apoptosis and the target genes of microRNA-21. Chin J Cancer. 2011; 30: 371–
380. PMID:21627859
45. Christensen LL, Tobiasen H, Holm A, Schepeler T, Ostenfeld MS, Thorsen K, et al. MiRNA-362-3p in-duces cell cycle arrest through targeting of E2F1, USF2 and PTPN1 and is associated with recurrence of colorectal cancer. Int J Cancer. 2013; 133: 67–78. doi:10.1002/ijc.28010PMID:23280316 46. Xia JT, Chen LZ, Jian WH, Wang KB, Yang YZ, He WL, et al. MicroRNA-362 induces cell proliferation
and apoptosis resistance in gastric cancer by activation of NF-κB signaling. J Transl Med. 2014; 12: 33. doi:10.1186/1479-5876-12-33PMID:24495516
47. Yamamoto Y, Kosaka N, Tanaka M, Koizumi F, Kanai Y, Mizutani T, et al. MicroRNA-500 as a potential diagnostic marker for hepatocellular carcinoma. Biomarkers. 2009; 14: 529–538. doi:10.3109/ 13547500903150771PMID:19863192
48. Song F, Zheng H, Liu B, Wei S, Dai H, Zhang L, et al. An miR-502-binding site single-nucleotide poly-morphism in the 3'-untranslated region of the SET8 gene is associated with early age of breast cancer onset. Clin Cancer Res. 2009; 15: 6292–6300. doi:10.1158/1078-0432.CCR-09-0826PMID: 19789321