Constraints on Biological Mechanism from
Disease Comorbidity Using Electronic
Medical Records and Database of Genetic
Variants
Steven C. Bagley1‡*, Marina Sirota2‡, Richard Chen3, Atul J. Butte2, Russ B. Altman1,4
1Department of Genetics, Stanford University, Stanford, California, United States of America,2UCSF Institute for Computational Health Sciences, San Francisco, California, United States of America, 3Personalis, Inc., Menlo Park, California, United States of America,4Department of Bioengineering, Stanford University, Stanford, California, United States of America
‡
These authors share first authorship on this work. *[email protected]
Abstract
Patterns of disease co-occurrence that deviate from statistical independence may represent important constraints on biological mechanism, which sometimes can be explained by shared genetics. In this work we study the relationship between disease co-occurrence and commonly shared genetic architecture of disease. Records of pairs of diseases were com-bined from two different electronic medical systems (Columbia, Stanford), and compared to a large database of published disease-associated genetic variants (VARIMED); data on 35 disorders were available across all three sources, which include medical records for over 1.2 million patients and variants from over 17,000 publications. Based on the sources in which they appeared, disease pairs were categorized as having predominant clinical, genetic, or both kinds of manifestations. Confounding effects of age on disease incidence were controlled for by only comparing diseases when they fall in the same cluster of simi-larly shaped incidence patterns. We find that disease pairs that are overrepresented in both electronic medical record systems and in VARIMED come from two main disease classes, autoimmune and neuropsychiatric. We furthermore identify specific genes that are shared within these disease groups.
Author Summary
Diseases do not always occur together at random, and patterns of disease association may reflect important biological constraints on disease mechanism. When a disease pair occurs more (or less) often than would be expected by chance given the frequencies of each dis-ease separately, that may signal the presence of shared causal factors. These shared factors may be genetic, environmental, or interactions of the two. To characterize the kinds of possible disease causes, we compared data from electronic medical records, which record a11111
OPEN ACCESS
Citation:Bagley SC, Sirota M, Chen R, Butte AJ, Altman RB (2016) Constraints on Biological Mechanism from Disease Comorbidity Using Electronic Medical Records and Database of Genetic Variants. PLoS Comput Biol 12(4): e1004885. doi:10.1371/journal.pcbi.1004885
Editor:Maricel Kann, University of Maryland Baltimore County, UNITED STATES
Received:October 14, 2015
Accepted:March 29, 2016
Published:April 26, 2016
Copyright:© 2016 Bagley et al. This is an open access article distributed under the terms of the
Creative Commons Attribution License, which permits unrestricted use, distribution, and reproduction in any medium, provided the original author and source are credited.
Data Availability Statement:The aggregate Columbia electronic medical record data are available as an appendix to a published article, as described in our Methods section. Corresponding aggregate data from the Stanford electronic medical record system are described in our paper, and available as Supplemental files in csv format. The original Stanford EMR data is not available because of reasons of patient confidentiality. Qualified parties may inquire through the Stanford Center for Clinical Informatics (http://med.stanford.edu/
disease manifestations, with information about genetic variants of disease. In particular, we find pairs of diseases that occur more or less often than expected by chance for patients in two electronic medical record systems, and compare them to disease pairs sharing a sta-tistically significant number of genes in a database of disease-associated genetic variants. Overrepresented pairs appearing in both source types come from two main disease classes, autoimmune and neuropsychiatric.
Introduction
When two diseases occur together in the same individuals more or less often than would be expected by chance, this may signal the operation of important biological processes. Pairs of diseases occurring more than expected are called synergistic; such interactions are familiar from clinical practice when the occurrence of a disease may raise the risk of a second disease. Pairs occurring less than expected are called protective; these interactions, sometimes called
“inverse comorbidities,”are less common, but intriguing. Disease pairs which consistently
diverge from independence in either direction may provide clues towards identifying core genetic, pathway, physiological, or environmental constraints that alter disease risk and repre-sent an important starting point for elaborating a mechanistic understanding of disease and for locating possible drug targets. Because discovery of disease patterns has been haphazard, it is attractive to systematically search for these patterns across a wide range of diseases, without adhering to prior conceptions of disease class, associated features, or expected comorbidities. In this work, we integrate clinical and genomic data across diseases to systematically assess their co-occurrence.
Consistent co-occurrence and conditional dependence in disease phenotypes arises from multiple, non-exclusive, factors: (1) shared genetics, including causal effects of single genes and effects of neighboring genes in linkage disequilibrium, (2) shared environmental exposures, (3) complex interactions in which a phenotype enhances or moderates the risk of another, (4) ascertainment, selection, or referral bias, (5) artifacts of the diagnostic system, where two puta-tively separate diseases are linked via large overlap of shared features, and (6) random varia-tion. Untangling these factors requires use and integration of both phenotypic and genetic data.
Historically, non-independent phenotype associations are noticed in an opportunistic way when the effect size is large, and otherwise they are detected more accurately through observa-tional studies and meta-analyses [1], or via comprehensive epidemiologic surveys. However, such studies and surveys are expensive to conduct and therefore often do not methodically examine disease combinations. In contrast, electronic medical records (EMR) represent a source of coded medical data that is typically large and, because these records are routinely col-lected to support clinical and administrative operations, the marginal cost to researchers is small; EMR data may therefore facilitate systematic comparison of disease co-occurrence [2].
Complementary information about disease relationships can be drawn from genomic stud-ies. In particular, VARiants Informing MEDicine, or VARIMED [3], is a hand-curated data-base of published disease-associated (primarily common) genetic variants. Although it is limited to known genetic variants, it is large and provides an opportunity for detecting the overlapping and shared genetic bases of diseases.
We combine EMR data with genetic data to compare and contrast disease co-occurrence patterns, systematically comparing statistically significant disease comorbidity patterns in EMR data with disease pairs having statistically significant genetic overlap in VARIMED, and VARIMED database is property of Personalis, Inc. As
noted in the paper, because VARIMED is proprietary, the relevant subset of 35 diseases, with associated genes, chromosome number, and PubMed ID of the source of each association were extracted and used for the analysis we report here. This dataset is included in the Supplement.
Funding:This work was funded by: National Institute of Mental Health,http://www.nimh.nih.gov, grant number 5P50MH094267 for SCB, and RBA; National Institutes of Healthhttp://www.nih.govLM05652 for RBA; National Institute of General Medical Sciences,
http://www.nigms.nih.gov, grant number GM102365 for RBA. Pfizer, Inc., grant for RBA; National Human Genome Research Institute,http://www.genome.gov/, grant number 5-U01HG007436-03 for MS and AJB; The Stanford Translational Research Integrated Database Environment is supported by the National Center for Research Resourceshttp://www.nih.gov/ about/almanac/organization/NCRR.htm, and the National Center for Advancing Translational Sciences
https://ncats.nih.gov/, through grant UL1 RR025744. The funders had no role in study design, data collection and analysis, decision to publish, or preparation of the manuscript.
characterize the pairs by the predominant influence as (1) clinical and genetic if they both co-occur in the clinical data and share a significant genetic component, (2) clinical without genetic if they co-occur only in the clinical records, or (3) genetic without clinically observable effect if we find only a significant genetic overlap without a corresponding EMR result.
There are several important assumptions to consider here including the penetrance and cau-sality of the genetic relationships that we examine as well as interactions between the genetics and the environment. Furthermore, EMR data are prone to selection and ascertainment bias, and errors from inaccuracies in chart coding. The lifetime of the EMR induces an observation window on the patients represented there, underrecording data from patients for disease pairs with widely separated ages of disease onset, and generating false inverse comorbidities. In order to avoid the confounding effect of age on the pair occurrence counts, we introduce a method for clustering diseases through similarity of their incidence pattern by age.
Other researchers have explored similar ideas. Patterns have been detected using linked administrative and clinical databases. Goldacre and colleagues [4] used data from the Oxford Record Linkage Study to find disease associations, such as an expected association between schizophrenia and lung cancer, and a protective association between schizophrenia and rheu-matoid arthritis. A later study using similar data [5] found inverse associations between Par-kinson’s disease and several kinds of cancer. Rzhetsky et al. [2] developed a mathematical model of ICD9-coded data from a single EMR to infer genetic overlap. Using genomics data from early GWAS studies, Sirota et al. [6] used summary data to define a signed genetic varia-tion score and cluster autoimmune disorders. Jung et al. [7] applied a similar method to study-ing autoimmune disorders when paired with autism. Li et al. [8] used data from several EMRs and from VARIMED to identify the genetic architecture of novel risk factor-disease associa-tions. Ibáñez et al. [9] compared gene expression profiles for previously identified inversely comorbid neuropsychiatric/cancer disease pairs, and found corresponding up- and down-regu-lation patterns. Melamed et al. [10] used data from a large database of insurance claims in com-bination with known genetic associations for Mendelian disorders to identify cancer driver genes. Glicksberg et al. [11] compared the overlap in disease pairs using EMR data and a data-base of genetic variants, retaining those pairs where both diseases appeared together in PubMed articles.
In this paper, we present a framework for integrating clinical and molecular data to study disease co-occurrence. Because disease risk varies with patient age, and because the co-occur-rence of disease is therefore confounded by age, we introduce a method to define age-specific disease clusters and carry out pairwise comparisons of disease co-occurrence. We explicitly model disease pair under and overrepresentation. To reduce bias, we conduct the analysis in two independent clinical databases, and require statistically significant deviation from indepen-dence in both. We identify a highly significant group of autoimmune disorders, a set of diseases with known environmental triggers, and some results which question the clinical manifestation of previously described disease associations.
Results
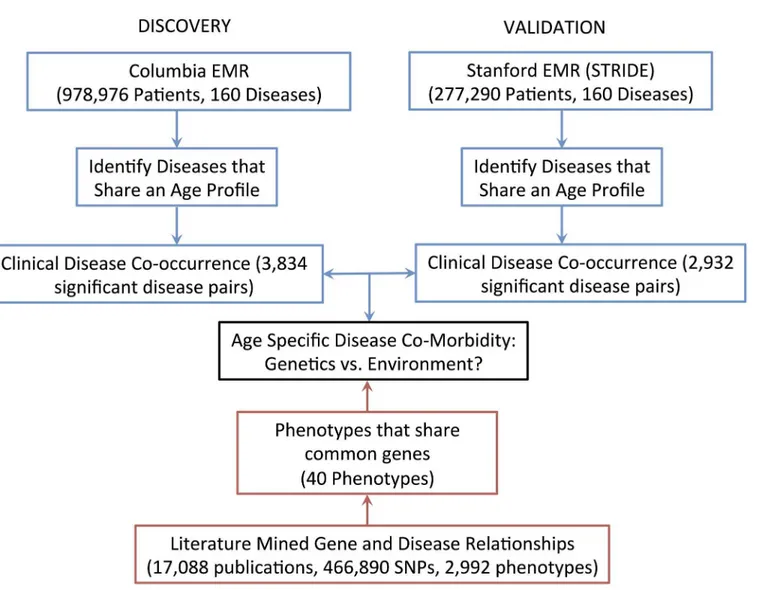
Data on disease pairs were drawn from Columbia and Stanford electronic medical record sys-tems, and compared to data on disease pairs with genetic overlap from the VARIMED data-base. The overall information flow is shown inFig 1.
Disease comorbidities were assessed for significance using a conventional 2 × 2 table record-ing the presence or absence of each disease; a patient contributes a count to one of the four cells (Table 1.) In aggregate, there are three possibilities: (1) independence, where the value of
than predicted from independence, and the pairs are overrepresented, or (3) protective interac-tions, wheredis smaller than predicted, and the pairs are underrepresented.
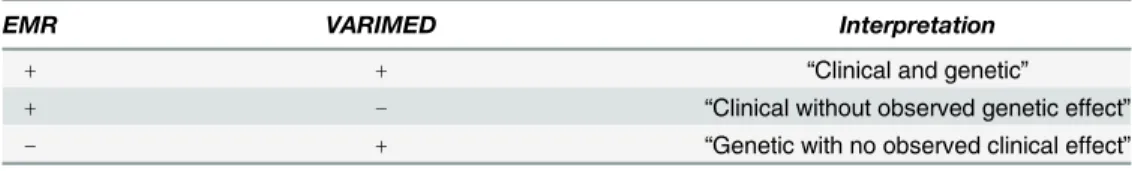
Disease pairs were collated by the sources in which they were found to be significant: (1) sig-nificant in both EMRs and sigsig-nificant in VARIMED, or“clinical and genetic,”, (2) in both EMRs but not in VARIMED, or“clinical without genetic,”and (3) in VARIMED but not in both EMRs, or“genetic without observed clinical effect.”(SeeTable 2.) Appearance in a clinical database represents the interaction between genetic predispositions, environmental exposures, and socioeconomic and phenotypic factors that lead to presentation for evaluation and treatment.
Fig 1. The overall information flow.Clinical data on disease co-occurrence from the Columbia and Stanford EMRs were compared to the literature-mined gene and disease relationships in the VARIMED database.
doi:10.1371/journal.pcbi.1004885.g001
Table 1. Conventional 2 × 2 table for counting the presence/absence of a disease pair.
not Disease2 Disease 2
not Disease 1 a b
Disease 1 c d
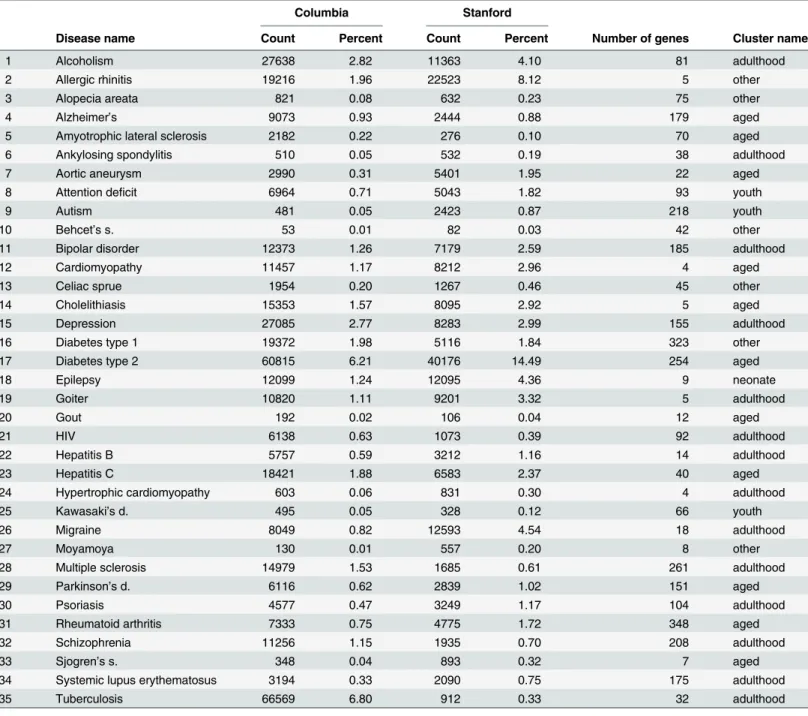
We start with 161 disorders in the available EMR data, of which 35 disorders appear in both EMRs and also in VARIMED; these are listed inTable 3, along with disease counts and fre-quencies for each EMR, and the gene counts from VARIMED.
To avoid the confounding effects of age on disease incidence, we form age-incidence clus-ters, where cluster members have similar age-incidence patterns, and only analyze disease pairs where both members of the pair fall in the same cluster. We use a data-driven method to compute cluster size, finding a locally optimum size of five. For visualization, each cluster is processed by forming the average of the incidence vectors in that cluster; these averages, along with a loess smoother, are shown inFig 2. Plots of all the data points for all examined cluster sizes appear in the Appendix. Conveniently, four of the clusters correspond to differ-ent life-stages (neonate, youth, adulthood, and aged) and were assigned those names by hand for ease of reference and to aid interpretation; the names are also listed in the final column of
Table 3. The fifth cluster contains data from predominantly younger patients, but is noisier and less consistent than the other clusters; it is labelled“other.”No significant results were found for diseases in the“neonate”cluster, so that cluster does not appear in the tables below. A complete list of all EMR disorders appearing in each cluster appears in the Supplement.
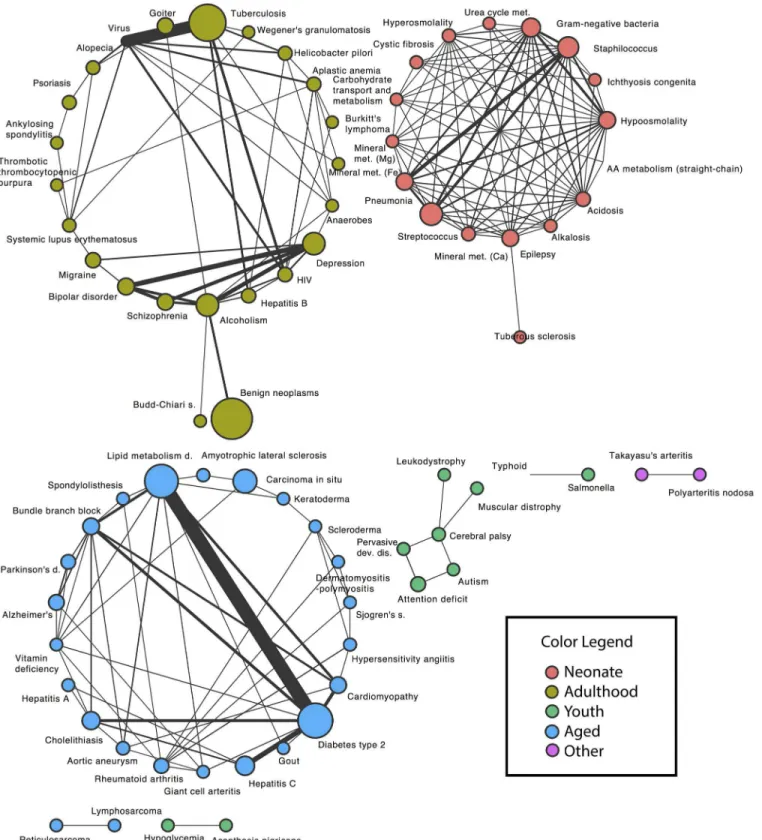
Significant disease pairs are presented in overview here and described in detail in the following sections. For each of the two EMRs, a significant disease pair is either under or overrepresented. We consider only those results that show concordant results, either both underrepresented, or both overrepresented, in the two EMRs. The structure of the overrepre-sented disease pairs is seen in the network diagram inFig 3; this figure uses data from the larger EMR (Columbia) to set the node size from disease frequency. There are three large components in the network, which have been coded by the color of the age-incidence cluster that forms each component; all have a compact, densely connected structure with only a few sparse ties, in spite of coming from an arbitrarily chosen list of common and rare diseases. The strongest effect is shown with thick link, marking the connection between lipid metabo-lism disorders and type 2 diabetes. The small light-green cluster (middle of lower row in fig-ure) highlights the connections between autism, pervasive developmental disorder, attention deficit, and cerebral palsy.
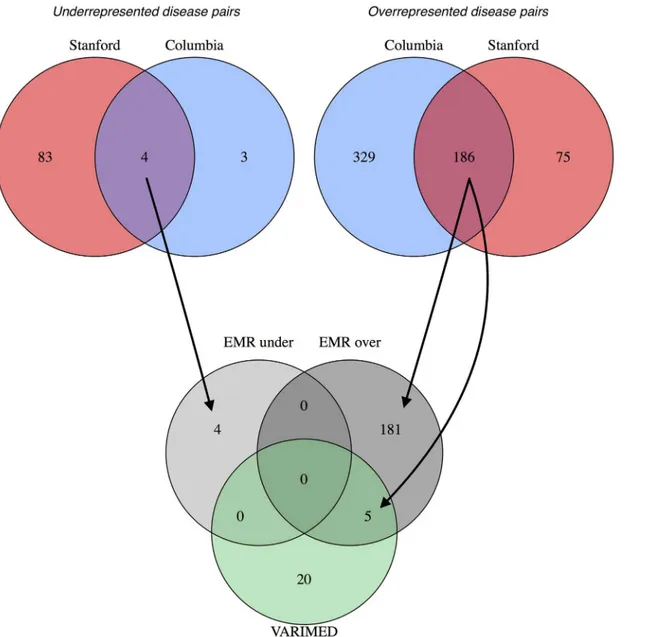
The set relationship of disease-pairs from the EMR data compared to the genetic variants is shown in the Venn diagram (Fig 4). For the underrepresented disease pairs, four are shared between Columbia and Stanford, but none appear in the intersection with VARIMED. For the overrepresented disease pairs, 186 are shared between Columbia and Stanford, and five of those remain when intersected with VARIMED.
Table 2. Informal names for each combination of statistically significant results from EMRs and VARIMED.
EMR VARIMED Interpretation
+ + “Clinical and genetic”
+ − “Clinical without observed genetic effect”
− + “Genetic with no observed clinical effect”
+ = significant,
−= not significant.
“Clinical and genetic”
results
In this section we report the results that are significant in both EMRs (Columbia and Stanford) and in VARIMED. We refer to these as“clinical and genetic.”For disease pairs significant in Columbia, Stanford, and in VARIMED, none were protective, and five were synergistic. The results, which fall into two classes, autoimmune and neuropsychiatric, are shown inTable 4. Information about the genes and gene overlap for the five overrepresented pairs appears in
Table 5.
Table 3. Counts and frequencies (as percent) for diseases that occur in both EMR data sets and in VARIMED.Number of genes is from VARIMED. Cluster names were assigned by hand to facilitate comprehension, as described in the text.
Columbia Stanford
Disease name Count Percent Count Percent Number of genes Cluster name
1 Alcoholism 27638 2.82 11363 4.10 81 adulthood
2 Allergic rhinitis 19216 1.96 22523 8.12 5 other
3 Alopecia areata 821 0.08 632 0.23 75 other
4 Alzheimer’s 9073 0.93 2444 0.88 179 aged
5 Amyotrophic lateral sclerosis 2182 0.22 276 0.10 70 aged
6 Ankylosing spondylitis 510 0.05 532 0.19 38 adulthood
7 Aortic aneurysm 2990 0.31 5401 1.95 22 aged
8 Attention deficit 6964 0.71 5043 1.82 93 youth
9 Autism 481 0.05 2423 0.87 218 youth
10 Behcet’s s. 53 0.01 82 0.03 42 other
11 Bipolar disorder 12373 1.26 7179 2.59 185 adulthood
12 Cardiomyopathy 11457 1.17 8212 2.96 4 aged
13 Celiac sprue 1954 0.20 1267 0.46 45 other
14 Cholelithiasis 15353 1.57 8095 2.92 5 aged
15 Depression 27085 2.77 8283 2.99 155 adulthood
16 Diabetes type 1 19372 1.98 5116 1.84 323 other
17 Diabetes type 2 60815 6.21 40176 14.49 254 aged
18 Epilepsy 12099 1.24 12095 4.36 9 neonate
19 Goiter 10820 1.11 9201 3.32 5 adulthood
20 Gout 192 0.02 106 0.04 12 aged
21 HIV 6138 0.63 1073 0.39 92 adulthood
22 Hepatitis B 5757 0.59 3212 1.16 14 adulthood
23 Hepatitis C 18421 1.88 6583 2.37 40 aged
24 Hypertrophic cardiomyopathy 603 0.06 831 0.30 4 adulthood
25 Kawasaki’s d. 495 0.05 328 0.12 66 youth
26 Migraine 8049 0.82 12593 4.54 18 adulthood
27 Moyamoya 130 0.01 557 0.20 8 other
28 Multiple sclerosis 14979 1.53 1685 0.61 261 adulthood
29 Parkinson’s d. 6116 0.62 2839 1.02 151 aged
30 Psoriasis 4577 0.47 3249 1.17 104 adulthood
31 Rheumatoid arthritis 7333 0.75 4775 1.72 348 aged
32 Schizophrenia 11256 1.15 1935 0.70 208 adulthood
33 Sjogren’s s. 348 0.04 893 0.32 7 aged
34 Systemic lupus erythematosus 3194 0.33 2090 0.75 175 adulthood
35 Tuberculosis 66569 6.80 912 0.33 32 adulthood
Prior work has found considerable genetic sharing between many autoimmune diseases [6], [12]; specific results include, ankylosing spondylitis and psoriasis [13]. The association between ankylosing spondylitis and lupus has been reported, but is extremely rare [14]. Rheumatoid arthritis and secondary Sjogren’s syndrome have a well-known association. The other two results are previously identified associations between neuropsychiatric disorders; bipolar disor-der and schizophrenia [15], and bipolar disorder and depression, although there may also be diagnostic overlap, as depression and bipolar disorder can be confused clinically.
We furthermore identify specific genes which are common to these two groups (Table 5). In the autoimmune subgroup those include well known associations in the HLA region such as
HLA-DRA,HLA-E[16], interleukin receptors (IL13,IL23RandIL2RA) [17,18], [19],BTNL2
[20] andMICA[21]. Interleukins are any of a class of glycoproteins produced by leukocytes for regulating immune responses. While these genes have been previously associated with autoim-mune diseases, they provide an interesting opportunity to explore shared therapeutic targets and diagnostic markers across these phenotypes.
In the neuropsychiatric subgroup some genes that are of interest includeANK3,CACNA1C,
CDH13,ITIH4andPDE7B. Ankyrins are a family of proteins that are believed to link the
inte-gral membrane proteins and play key roles in activities such as cell motility, activation, prolifer-ation, contact, and the maintenance of specialized membrane domains. Ankyrin 3 is an immunologically distinct gene product from ankyrins 1 and 2, and was originally found at the axonal initial segment and nodes of Ranvier of neurons in the central and peripheral nervous systems.CACNA1Cis a voltage-dependent calcium channel and has been previously linked to several neurodegenerative diseases [22], [23].CACNA1Cis also an associated gene of the one of the most highly significant SNPs for both bipolar disorder and schizophrenia in a cross-dis-order genome wide analysis [15]. Cadhedrin,CDH13, is a known ADHD-susceptibility gene that has been investigated in other neuropsychiatric disorders [24], [25], [26]. Some of the Fig 2. The incidence-by-age patterns of the five clusters identified.Using data from Stanford’s EMR, each graph shows the incidence at each age, averaged over all disorders in the cluster. The loess smoother marks the overall trend with a colored band. The same cluster colors are used throughout this paper. See the text for description of the cluster names.
Fig 3. Network structure of the significant disease pairs that occur in both EMRs.Each node represents a disease, with the node size scaled to the disease frequency in the Columbia EMR. Each edge connects statistically significant pairs, with the edge width scaled to the effect size (observed number divided by expected number). Node color corresponds to the cluster colors inFig 2.
other shared genes such asITIH4, inter-alpha-trypsin inhibitor heavy chain family, member 4,
andPDE7B, phosphodiesterase 7B do not have clearly known links to the neuropsychiatric
phenotypes and might be interesting to explore further.
“Clinical without observed genetic effect”
results
In this section we report disease pairs that are significant in both EMRs, but not significant in VARIMED (“clinical without observed genetic effect”). One protective interaction was found: alcoholism and goiter. This pair in the Columbia dataset has an observed/expected ratio of Fig 4. Venn diagrams showing the overlap of the disease pairs from the two electronic medical records and from VARIMED.At the top, the leftmost diagram shows the overlap of statistically significant disease pairs that are underrepresented in Columbia and in Stanford; the rightmost diagram is for overrepresented pairs. The bottom diagram shows the overlap between the conjunctions (overlapping regions) of the upper diagrams and the disease pairs in VARIMED. Arrows show how the results from the EMR sources were combined with the VARIMED results. The counts of disease pairs shown do not correspond exactly to those in Tables6and7because the VARIMED results here include discordant pairs, underrepresented in one EMR and overrepresented in the other.
0.501 (p<1.55 × 10⁻²²); in the Stanford dataset, 0.297 (
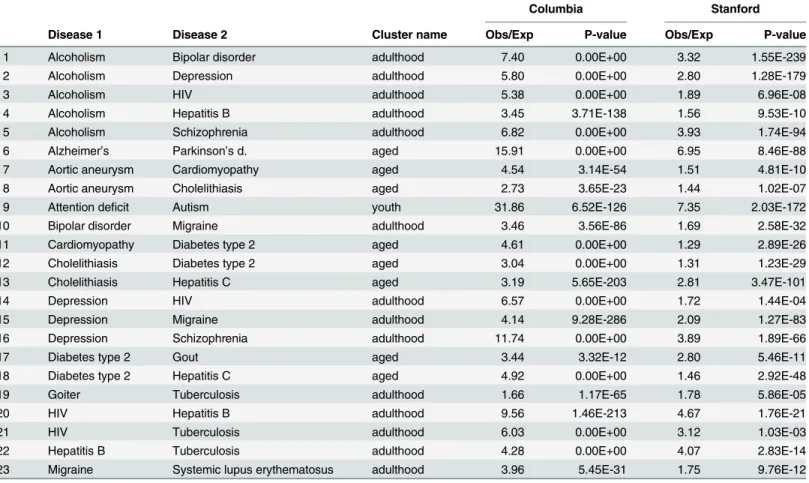
p<6.16 × 10−61).Table 6shows the 23
overrepresented interactions.
As expected, disorders with clear environmental triggers are apparent in both lists: alcohol, injection drug use (HIV, hepatitis B and C), and diet (diabetes type 2, and gout). Of the protec-tive pairs, alcoholism and goiter have been previously noted to be underrepresented [27].
Most of the detected synergistic interactions are well-known. These include: alcoholism and bipolar disorder, alcoholism and depression, alcoholism and schizophrenia, depression and schizophrenia, and the alcoholism and injection drug-associated pairs. Of those less familiar, references are provided here: depression and migraine [28], migraine and lupus [29], cardio-myopathy and diabetes [30], aortic aneurysm and cardiomyopathy [31], diabetes type 2 and gout [32], attention deficit and autism [33]. The association between alzheimer’s and parkin-sonism is very likely due to diagnostic overlap, given known differences in mechanism but dif-ficulties in the clinical diagnosis of dementia subtypes. Lack of clear genetic signal for all these pairs does not completely rule out any genetic connection, as some disorders may have not yet Table 4. Results for overrepresented (synergistic) disease pairs that are significant in Columbia and Stanford EMRs and in VARIMED.Results are sorted by cluster and by Obs/Exp within each cluster.
Columbia Stanford
Disease 1 Disease 2 Cluster name Obs/Exp P-value Obs/Exp P-value
1 Ankylosing spondylitis Psoriasis adulthood 7.13 6.22E-10 2.57 6.85E-04
2 Ankylosing spondylitis Systemic lupus erythematosus adulthood 46.88 3.13E-102 3.24 2.56E-04
3 Bipolar disorder Depression adulthood 16.27 0.00E+00 7.07 0.00E+00
4 Bipolar disorder Schizophrenia adulthood 22.34 0.00E+00 10.16 0.00E+00
5 Rheumatoid arthritis Sjogren’s s. aged 35.29 2.33E-111 10.92 1.51E-117
Obs/Exp = Observed/Expected.
doi:10.1371/journal.pcbi.1004885.t004
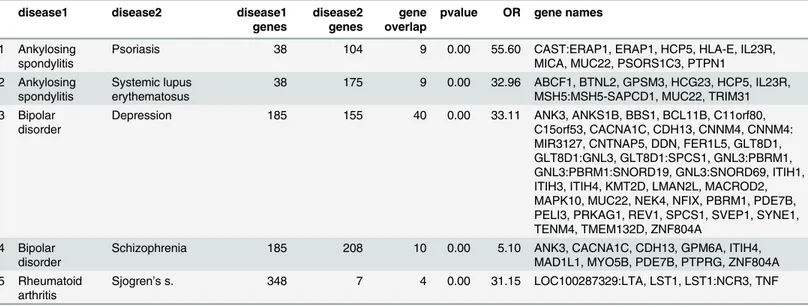
Table 5. Results of overrepresented disease pairs that are significant in Columbia and Stanford EMRs and in VARIMED, showing the genetic infor-mation from VARIMED.disease1/2 genes = number of genes for each disease, gene overlap = number of shared genes, pvalue = pvalue from Fisher exact test, OR = odds ratio, gene names = the gene symbols for the shared genes. Colons connect groups of genes all mapped from the same variant.
disease1 disease2 disease1
genes
disease2 genes
gene overlap
pvalue OR gene names
1 Ankylosing spondylitis
Psoriasis 38 104 9 0.00 55.60 CAST:ERAP1, ERAP1, HCP5, HLA-E, IL23R,
MICA, MUC22, PSORS1C3, PTPN1 2 Ankylosing
spondylitis
Systemic lupus erythematosus
38 175 9 0.00 32.96 ABCF1, BTNL2, GPSM3, HCG23, HCP5, IL23R, MSH5:MSH5-SAPCD1, MUC22, TRIM31 3 Bipolar
disorder
Depression 185 155 40 0.00 33.11 ANK3, ANKS1B, BBS1, BCL11B, C11orf80,
C15orf53, CACNA1C, CDH13, CNNM4, CNNM4: MIR3127, CNTNAP5, DDN, FER1L5, GLT8D1, GLT8D1:GNL3, GLT8D1:SPCS1, GNL3:PBRM1, GNL3:PBRM1:SNORD19, GNL3:SNORD69, ITIH1, ITIH3, ITIH4, KMT2D, LMAN2L, MACROD2, MAPK10, MUC22, NEK4, NFIX, PBRM1, PDE7B, PELI3, PRKAG1, REV1, SPCS1, SVEP1, SYNE1, TENM4, TMEM132D, ZNF804A
4 Bipolar disorder
Schizophrenia 185 208 10 0.00 5.10 ANK3, CACNA1C, CDH13, GPM6A, ITIH4,
MAD1L1, MYO5B, PDE7B, PTPRG, ZNF804A 5 Rheumatoid
arthritis
Sjogren’s s. 348 7 4 0.00 31.15 LOC100287329:LTA, LST1, LST1:NCR3, TNF
been subject to scrutiny through GWAS studies, or have only modest effect sizes not reaching statistical significance.
“Genetic without observed clinical effect”
results
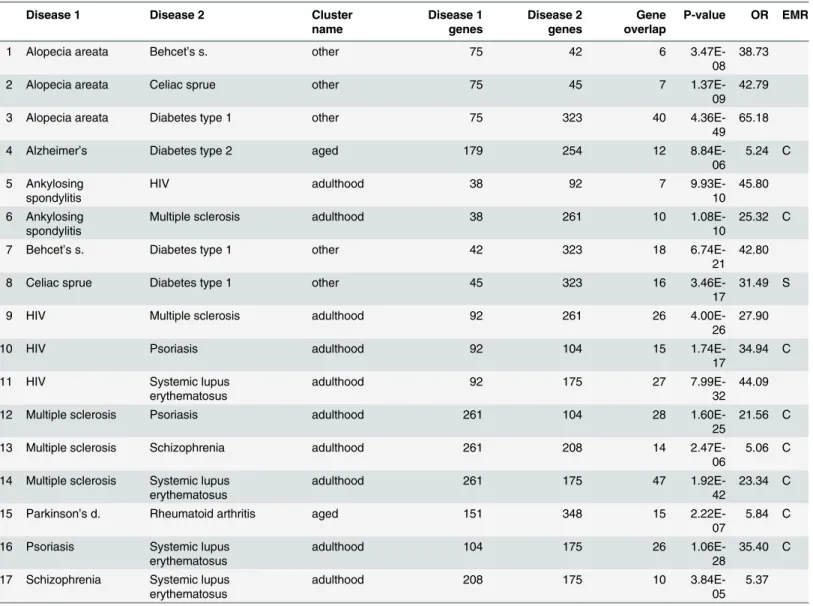
In this section we report disease pairs that have significant overlap of genetic variants in VAR-IMED, but are not significant in both EMRs. There are 17 such pairs, shown inTable 7; when the disease pair was significant in one EMR, that was recorded in the“EMR”column.
The group of“genetic without observed clinical effect”are those which have significant genetic overlap in VARIMED, but not in both EMRs. Nearly all are autoimmune disorders, and may represent pairs with sharing detected at the level of genes that do not produce path-way interactions leading to disease phenotypes, or rare interactions that do not achieve statisti-cal significance.
Discussion
In this paper we present a method to identify statistically significant disease pairs which display significant comorbidity in two EMRs and share common genetic background in a large data-base of disease-associated variants; we explicitly model the under and overrepresentation of disease pairs, and control for the confounding effects of age on disease incidence by only Table 6. Results for overrepresented disease pairs that are significant in Columbia and Stanford EMRs but not in VARIMED.
Columbia Stanford
Disease 1 Disease 2 Cluster name Obs/Exp P-value Obs/Exp P-value
1 Alcoholism Bipolar disorder adulthood 7.40 0.00E+00 3.32 1.55E-239
2 Alcoholism Depression adulthood 5.80 0.00E+00 2.80 1.28E-179
3 Alcoholism HIV adulthood 5.38 0.00E+00 1.89 6.96E-08
4 Alcoholism Hepatitis B adulthood 3.45 3.71E-138 1.56 9.53E-10
5 Alcoholism Schizophrenia adulthood 6.82 0.00E+00 3.93 1.74E-94
6 Alzheimer’s Parkinson’s d. aged 15.91 0.00E+00 6.95 8.46E-88
7 Aortic aneurysm Cardiomyopathy aged 4.54 3.14E-54 1.51 4.81E-10
8 Aortic aneurysm Cholelithiasis aged 2.73 3.65E-23 1.44 1.02E-07
9 Attention deficit Autism youth 31.86 6.52E-126 7.35 2.03E-172
10 Bipolar disorder Migraine adulthood 3.46 3.56E-86 1.69 2.58E-32
11 Cardiomyopathy Diabetes type 2 aged 4.61 0.00E+00 1.29 2.89E-26
12 Cholelithiasis Diabetes type 2 aged 3.04 0.00E+00 1.31 1.23E-29
13 Cholelithiasis Hepatitis C aged 3.19 5.65E-203 2.81 3.47E-101
14 Depression HIV adulthood 6.57 0.00E+00 1.72 1.44E-04
15 Depression Migraine adulthood 4.14 9.28E-286 2.09 1.27E-83
16 Depression Schizophrenia adulthood 11.74 0.00E+00 3.89 1.89E-66
17 Diabetes type 2 Gout aged 3.44 3.32E-12 2.80 5.46E-11
18 Diabetes type 2 Hepatitis C aged 4.92 0.00E+00 1.46 2.92E-48
19 Goiter Tuberculosis adulthood 1.66 1.17E-65 1.78 5.86E-05
20 HIV Hepatitis B adulthood 9.56 1.46E-213 4.67 1.76E-21
21 HIV Tuberculosis adulthood 6.03 0.00E+00 3.12 1.03E-03
22 Hepatitis B Tuberculosis adulthood 4.28 0.00E+00 4.07 2.83E-14
23 Migraine Systemic lupus erythematosus adulthood 3.96 5.45E-31 1.75 9.76E-12
Obs/Exp = Observed/Expected.
comparing diseases when they fall in the same cluster of similarly-shaped incidence patterns. The method is fast, easy to interpret, and can be extended in a straightforward manner to other EMRs, data from national health systems, and large insurance databases.
Our primary aim is to identify disease pairs which might share a common mechanism or treatment option for further exploration and research. We link disease pairs that are under or overrepresented in EMR data to statistically significant overlapping genes sets for the same pairs. The genetic variants are known to have phenotypic effects, while EMRs capture a Table 7. Results for disease pairs that are significant in VARIMED after removing pairs that are significant in both Columbia and Stanford EMRs.
Disease 1 Disease 2 Cluster
name Disease 1 genes Disease 2 genes Gene overlap
P-value OR EMR
1 Alopecia areata Behcet’s s. other 75 42 6
3.47E-08 38.73
2 Alopecia areata Celiac sprue other 75 45 7
1.37E-09 42.79
3 Alopecia areata Diabetes type 1 other 75 323 40
4.36E-49 65.18
4 Alzheimer’s Diabetes type 2 aged 179 254 12
8.84E-06
5.24 C
5 Ankylosing spondylitis
HIV adulthood 38 92 7
9.93E-10 45.80
6 Ankylosing spondylitis
Multiple sclerosis adulthood 38 261 10
1.08E-10
25.32 C
7 Behcet’s s. Diabetes type 1 other 42 323 18
6.74E-21 42.80
8 Celiac sprue Diabetes type 1 other 45 323 16
3.46E-17
31.49 S
9 HIV Multiple sclerosis adulthood 92 261 26
4.00E-26 27.90
10 HIV Psoriasis adulthood 92 104 15
1.74E-17
34.94 C
11 HIV Systemic lupus
erythematosus
adulthood 92 175 27
7.99E-32 44.09
12 Multiple sclerosis Psoriasis adulthood 261 104 28
1.60E-25
21.56 C
13 Multiple sclerosis Schizophrenia adulthood 261 208 14
2.47E-06
5.06 C
14 Multiple sclerosis Systemic lupus erythematosus
adulthood 261 175 47
1.92E-42
23.34 C
15 Parkinson’s d. Rheumatoid arthritis aged 151 348 15
2.22E-07
5.84 C
16 Psoriasis Systemic lupus erythematosus
adulthood 104 175 26
1.06E-28
35.40 C
17 Schizophrenia Systemic lupus erythematosus
adulthood 208 175 10
3.84E-05 5.37
Disease 1/2 genes = number of genes for each disease in VARIMED, Gene overlap = number of shared genes,
OR = Odds ratio,
EMR = which EMR had result, C = Columbia,
S = Stanford.
broad collection of diseases states that are severe enough to require diagnosis and treatment, and represent a constellation of genetic predispositions, environmental influences, and social and economic factors that affect when diseases are detected. Many of the predisposing factors in EMRs are not measured, but we can find pairs that have known genetic associa-tions and also find pairs that do not. As always for candidate generation or prioritization methods, the question arises of how to validate novel results, given that validating experi-ments have not yet been conducted. By contrasting results in two EMRs and in a database of genetic variants, we have reduced the chance that the same biases are operating across all data sources.
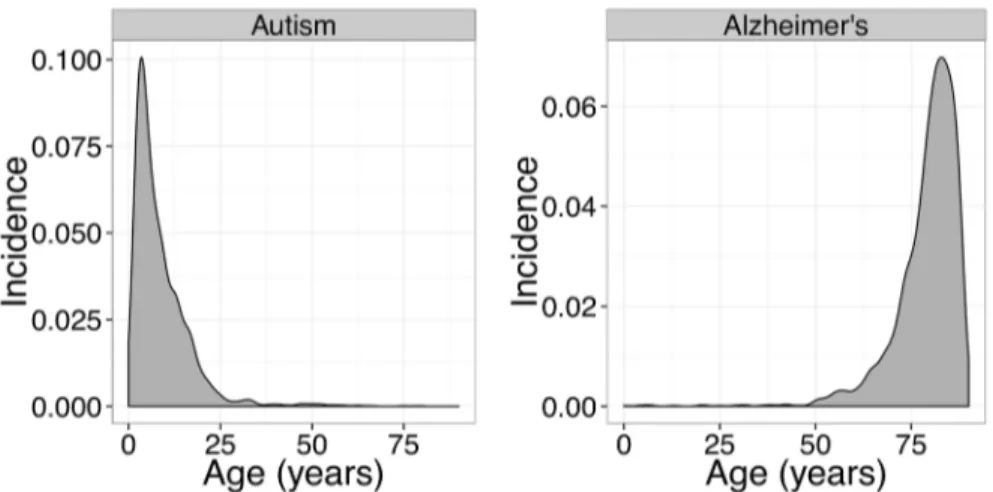
There are several limitations of our approach which should be recognized. Our method only compares diseases when they fall in the same cluster. This is a simple, but conservative, match on age patterns, and should enrich results for true positives at the expense of missing other true positives that would only be found in cross-cluster comparisons. For example, because autism and Alzheimer’s disease would fall in different age-incidence clusters and would not be com-pared, possible interactions between those disorders would not be detected. VARIMED, while large, contains only published results, reflecting investigators’choices of important areas of study, including, as we found, autoimmune disorders and neuropsychiatric disorders. Also, VARIMED focuses primarily on common variation as most genetic association has been based on genotype-based GWAS. VARIMED (and other databases) are not randomly sampled from the space of biological phenomena, and the absence of a genetic variant may only mean that such have not yet been investigated. It is likely that our method will fail in such circumstances to identify comorbid pairs using the conjunction of data from EMRs and from VARIMED, which is a source of bias. In addition, we link to EMR records on the basis of a straightforward, but necessarily imprecise, mapping through a disease name. We restrict the genetic analysis to the genes and do not consider the allele-specific relationships (risk-enhancing or risk-moderat-ing). Although both gender and ethnicity are known to be important covariates for the preva-lence of disease, because the available Columbia data were not stratified by gender or ethnicity, neither were used in this study. This would be particularly important for autoimmune disor-ders with their known gender dependence; combining the gendisor-ders for analysis, as we had to do, may have diluted statistical signal, and would explain the appearance of results inTable 7. Finally, the set of diseases examined was restricted to the 161 in the original Rzhetsky study, and further restricted by the limited overlap with VARIMED; although drawing from both common and rare diseases, the set is small compared to the full range coded by ICD9. Prior studies have found multiple protective interactions between CNS disorders and cancers [34] but, unfortunately, few cancers were in the list of disorders analyzed here. In spite of these limi-tations, we hope this study can serve as a proof of principle for integrating EMR and genetics data to uncover relationships between diseases. Using larger data sets, and incorporating important covariates and the direction of allele-specific risk would important validating exten-sions of the current work. Furthermore, text mining of EMR clinical notes and other databases of environmental exposures could represent an opportunity for identifying non-genetic causes of diseases.
Materials and Methods
Ethics statement
Our validation data set used patient records from Stanford’s electronic medical record system, STRIDE (Stanford Translational Research Integrated Database Environment). The data request was judged to be exempt from human subject concerns by the Stanford Institutional Review Board, and was also approved by its Data Privacy Office. The Stanford data were retrieved June 6, 2013. Encounter records contained a masked patient identifier, current age, gender, ethnicity, icd9, and age at visit. (Gender was not used because gender information was not generally available for the Columbia data. Ethnicity was not used for the same reason.) Because of small numbers of very old patients, ages were censored at 90 years for privacy rea-sons by STRIDE staff prior to our use.
Clinical data analysis
For the electronic medical record data, the discovery data set comes from the composite data for the Columbia EMR, published as an online appendix of [2], which lists counts of diseases and disease pairs for a total of 161 disorders. As described in the original article,“We selected disorders that represent a broad spectrum of maladies, from common to rare, affecting diverse physiological systems, yet we also placed special emphasis on neurological phenotypes.”
The total number of patients was 1,478,976, however because these records include data on healthy hospital employees, the total was lowered by 500,000 as described in their Appendix 2, p 19. Disease count data were extracted from their Appendix 3, and disease-pair count data were extracted from Supplemental Information Data Set 1. Separately, the mapping from ICD9 codes to disease names was taken from their Appendix 3; a small number of mapping errors were corrected by hand.
For validation, patient-level data were retrieved from STRIDE (Stanford Translational Research Integrated Database Environment) [35] for the same 161 diseases to allow for direct comparison with the Columbia data. The raw data contained 1,057,132 records for 397,474 patients. We focus our analysis on data starting in the year 2008, which was the year of compre-hensive EMR rollout. When there were fewer than 50 patients with a disease, that disease was judged too rare to contribute to the incidence frequencies in a meaningful way, and was removed. This left data for 277,290 patients. Also, disease pairs were removed if any of the cells in the 2 × 2 table had observed or expected values less than 5.
The EMR records were aggregrated and processed to retain the earliest occurrence of each ICD9 code for each patient, which were then consolidated using the ICD9-to-disease mapping from [2] to produce a table of patient counts for each disease name. A similar procedure was used to count disease pairs.
Correcting for age bias through clustering
To control for the confounding effects of age, disease pairs were analyzed only when both diseases could be put in the same age-incidence cluster. Clusters were formed so as to be as large as possible (to maximize the number of subsequent disease comparisons), while simulta-neously imposing within-cluster homogeneity, so that each cluster had similar age-incidence patterns. The age-incidence clustering used from patient-level data for Stanford; corresponding details for the Columbia data were not available.
Each disease was represented as a 91-dimensional vector containing counts of the number of patients whose earliest onset of that disease occurred for each of the ages 0 years through 90 years. For normalization, each vector was divided by its length to produce unit vectors. Hierar-chical clustering with Ward’s method for linkage was chosen to produce clusters that were compact and of similar size.
Cluster size was determined in a data-driven manner by systemically searching through possible clustering methods and cluster scoring measures. The methods and measures were taken from those provided by the R package COMMUNAL and are listed in the Supplemental Material. The cluster measures (also known as cluster indices) provide scores for each method and each cluster size. The measures were combined into a composite score by standardizing each measure (zero mean, unit variance) and then averaging. All measures were converted to have the same sense, so that larger values were associated with more desirable clusters. Any measure with a monotonic function (either increasing or decreasing) of cluster size for all methods and measures was removed because such a measure would be minimized or maxi-mized at the extremes of the search range for cluster size, and thus not be responsive to pat-terns in the data.
Pairs of diseases that showed significant comorbidity pairs were identified in the Columbia data and verified in the Stanford data, so all pairs reported here were statistically significant in both. In addition, only pairs that were underrepresented in both EMRs or overrepresented in both EMRs were retained, ensuring consistent directionality; discordant pairs were not ana-lyzed. Statistical significance was computed using the Fisher exact test. Bonferroni correction was applied using the number of diseases in each cluster. The conventional level of significance, 0.05, was used for all tests.
Fig 5. Incidence-by-age graphs for autism and Alzheimer’s disease.Because of the gross disparities in these patterns, patients at risk for one disorder would be a low risk for the second disorder at any given age, reducing the observed comorbidity.
Genetic analysis
Genetic associations came from VARIMED, a hand-curated database of published phenotype-associated genetic variants [3]. As of May, 2015, this database contained variants from 17,088 publications, with 466,890 SNPs associated with 2,992 diseases or traits. SNPs were mapped to genes using the dbSNP annotation database. Sometimes, a variant maps to more than one gene. In such cases, we use colons to separate the genes in a single group; this notation is used inTable 5. Phenotype descriptions were mapped by hand to the set of 161 disease names used for the Columbia and Stanford data. There were 35 diseases that appeared in Columbia, Stan-ford, and in VARIMED (Table 3). Because VARIMED is proprietary, the relevant subset of 35 diseases, with associated genes, chromosome number, and PubMed ID of the source of each association were extracted and used for the analysis we report here. This dataset is included in the Supplement.
Genetic variants that were significantly associated with each phenotype of interest were obtained from VARIMED and mapped to gene names. In this study, we used significant dis-ease-SNP associations (p<10−6) with known risk alleles and published odds ratios. The
num-ber of genes associated with each of the 35 diseases of interest are shown inTable 3. We furthermore focus our analysis on the gene level, specifically calculating enrichment of the number of overlapping genes between two phenotypes of interest. We report the number of genes shared by the disease pair if the overlap was determined as significant by the Fisher exact test using Bonferroni correction for the number of tests.
A network diagram (Fig 3) showing the structure of the disease pairs and their clusterings was created using the Cytoscape software tool. In the network diagram, a node represents a dis-ease. Two nodes are connected if that disease pair is statistically significant in the EMR data and appears in the same age-incidence cluster. The size of a node represents the frequency of that disease in the larger EMR (Columbia). The edge width represents the effect size for that pair (observed number divided by expected number). The node color indicates cluster mem-bership, using the same colors as inFig 2.
Supporting Information
S1 Appendix. Contains information about the Columbia and Stanford EMR data sets, and details on the age-incidence clustering method.
(PDF)
S1 File. Subset of VARIMED used in our analysis, with disease name, gene name, chromo-some, and PubMed ID.
(CSV)
S2 File. Diseases and disease clusters.
(CSV)
S3 File. Disease pairs from Columbia EMR with statistically significant under or overrepre-sentation.
(CSV)
S4 File. Disease pairs from Stanford EMR with statistically significant under or overrepre-sentation.
(CSV)
S5 File. Disease pairs in intersection of Columbia and Stanford EMRs.
S6 File. Disease pairs from VARIMED with statistically significant gene overlap.
(CSV)
Acknowledgments
We thank Timothy Sweeney, MD, PhD, for discussions about clustering, and assistance with the R COMMUNAL package.
Author Contributions
Conceived and designed the experiments: SCB MS. Performed the experiments: SCB MS. Ana-lyzed the data: SCB MS RBA. Contributed reagents/materials/analysis tools: RC AJB. Wrote the paper: SCB MS AJB RBA.
References
1. Catalá-López F, Suárez-Pinilla M, Suárez-Pinilla P, Valderas JM, Gómez-Beneyto M, Martinez S, et al. Inverse and Direct Cancer Comorbidity in People with Central Nervous System Disorders: A Meta-Analysis of Cancer Incidence in 577,013 Participants of 50 Observational Studies. Psychotherapy and psychosomatics. 2014; 83(2):89–105. doi:10.1159/000356498PMID:24458030
2. Rzhetsky A, Wajngurt D, Park N, Zheng T. Probing genetic overlap among complex human pheno-types. Proceedings of the National Academy of Sciences. 2007; 104(28):11694–11699. doi:10.1073/ pnas.0704820104
3. Chen R, Davydov EV, Sirota M, Butte AJ. Non-synonymous and synonymous coding SNPs show simi-lar likelihood and effect size of human disease association. PLoS One. 2010; 5(10):e13574. doi:10. 1371/journal.pone.0013574PMID:21042586
4. Goldacre M, Kurina L, Yeates D, Seagroatt V, Gill L. Use of large medical databases to study associa-tions between diseases. Qjm. 2000; 93(10):669–675. doi:10.1093/qjmed/93.10.669PMID:11029477 5. Fois AF, Wotton CJ, Yeates D, Turner MR, Goldacre MJ. Cancer in patients with motor neuron disease,
multiple sclerosis and Parkinson’s disease: record linkage studies. Journal of Neurology, Neurosurgery & Psychiatry. 2010; 81(2):215–221. doi:10.1136/jnnp.2009.175463
6. Sirota M, Schaub MA, Batzoglou S, Robinson WH, Butte AJ. Autoimmune disease classification by inverse association with SNP alleles. PLoS genetics. 2009; 5(12):e1000792. doi:10.1371/journal. pgen.1000792PMID:20041220
7. Jung J, Kohane IS, Wall D. Identification of autoimmune gene signatures in autism. Translational psy-chiatry. 2011; 1(12):e63. doi:10.1038/tp.2011.62PMID:22832355
8. Li L, Ruau DJ, Patel CJ, Weber SC, Chen R, Tatonetti NP, et al. Disease Risk Factors Identified Through Shared Genetic Architecture and Electronic Medical Records. Science translational medicine. 2014; 6(234):234ra57–234ra57. doi:10.1126/scitranslmed.3007191PMID:24786325
9. Ibáñez K, Boullosa C, Tabarés-Seisdedos R, Baudot A, Valencia A. Molecular Evidence for the Inverse Comorbidity between Central Nervous System Disorders and Cancers Detected by Transcriptomic Meta-analyses. PLoS genetics. 2014; 10(2):e1004173. doi:10.1371/journal.pgen.1004173PMID:24586201 10. Melamed RD, Emmett KJ, Madubata C, Rzhetsky A, Rabadan R. Genetic similarity between cancers and comorbid Mendelian diseases identifies candidate driver genes. Nature communications. 2015; 6. doi:10.1038/ncomms8033PMID:25926297
11. Glicksberg BS, Li L, Cheng WY, Shameer K, Hakenberg J, Castellanos R, et al. An Integrative Pipeline for Multi-Modal Discovery of Disease Relationships. In: Pacific Symposium on Biocomputing. Pacific Symposium on Biocomputing. vol. 20. World Scientific; 2015. p. 407–418.
12. Cotsapas C, Voight BF, Rossin E, Lage K, Neale BM, Wallace C, et al. Pervasive sharing of genetic effects in autoimmune disease. PLoS genetics. 2011; 7(8):e1002254. doi:10.1371/journal.pgen. 1002254PMID:21852963
13. Exarchou S, Lindström U, Askling J, Eriksson JK, Forsblad-d’Elia H, Neovius M, et al. The prevalence of clinically diagnosed ankylosing spondylitis and its clinical manifestations: a nationwide register study. Arthritis research & therapy. 2015; 17(1):118. doi:10.1186/s13075-015-0627-0
14. Kook M, Yoo H, Hong M, Yoo W. Coexisting systemic lupus erythematosus and ankylosing spondylitis: a case report and review of the literature. Lupus. 2011;p. 0961203311428461.
16. Rioux JD, Goyette P, Vyse TJ, Hammarström L, Fernando MM, Green T, et al. Mapping of multiple sus-ceptibility variants within the MHC region for 7 immune-mediated diseases. Proceedings of the National Academy of Sciences. 2009; 106(44):18680–18685. doi:10.1073/pnas.0909307106
17. Wellcome Trust Case Control Consortium & The Australo-Anglo-American Spondylitis Consortium (TASC). Association scan of 14,500 nonsynonymous SNPs in four diseases identifies autoimmunity variants. Nature genetics. 2007; 39(11):1329–1337. doi:10.1038/ng.2007.17PMID:17952073 18. Capon F, Di Meglio P, Szaub J, Prescott NJ, Dunster C, Baumber L, et al. Sequence variants in the
genes for the interleukin-23 receptor (IL23R) and its ligand (IL12B) confer protection against psoriasis. Human genetics. 2007; 122(2):201–206. doi:10.1007/s00439-007-0397-0PMID:17587057 19. Rueda B, Orozco G, Raya E, Fernandez-Sueiro JL, Mulero J, Blanco FJ, et al. The IL23R Arg381Gln
non-synonymous polymorphism confers susceptibility to ankylosing spondylitis. Annals of the rheu-matic diseases. 2008; 67(10):1451–1454. doi:10.1136/ard.2007.080283PMID:18199597
20. Orozco G, Eerligh P, Sánchez E, Zhernakova S, Roep BO, González-Gay MA, et al. Analysis of a func-tional BTNL2 polymorphism in type 1 diabetes, rheumatoid arthritis, and systemic lupus erythematosus. Human immunology. 2005; 66(12):1235–1241. doi:10.1016/j.humimm.2006.02.003PMID:16690410 21. Lee Y, Bae SC, Kim JH, Song G. Meta-analysis of the association between functional MICA-TM
poly-morphisms and systemic lupus erythematosus, rheumatoid arthritis and ankylosing spondylitis. Zeit-schrift für Rheumatologie. 2015; 74(2):146–152. doi:10.1007/s00393-014-1409-9PMID:25060517 22. Green EK, Grozeva D, Jones I, Jones L, Kirov G, Caesar S, et al. The bipolar disorder risk allele at
CACNA1C also confers risk of recurrent major depression and of schizophrenia. Molecular psychiatry. 2010; 15(10):1016–1022. doi:10.1038/mp.2009.49PMID:19621016
23. Bigos KL, Mattay VS, Callicott JH, Straub RE, Vakkalanka R, Kolachana B, et al. Genetic variation in CACNA1C affects brain circuitries related to mental illness. Archives of General Psychiatry. 2010; 67 (9):939–945. doi:10.1001/archgenpsychiatry.2010.96PMID:20819988
24. Rivero O, Sich S, Popp S, Schmitt A, Franke B, Lesch KP. Impact of the ADHD-susceptibility gene CDH13 on development and function of brain networks. European Neuropsychopharmacology. 2013; 23(6):492–507. doi:10.1016/j.euroneuro.2012.06.009PMID:22795700
25. Terracciano A, Tanaka T, Sutin AR, Sanna S, Deiana B, Lai S, et al. Genome-wide association scan of trait depression. Biological psychiatry. 2010; 68(9):811–817. doi:10.1016/j.biopsych.2010.06.030 PMID:20800221
26. Edwards AC, Aliev F, Bierut LJ, Bucholz KK, Edenberg H, Hesselbrock V, et al. Genome-wide associa-tion study of comorbid depressive syndrome and alcohol dependence. Psychiatric genetics. 2012; 22 (1):31. doi:10.1097/YPG.0b013e32834acd07PMID:22064162
27. Knudsen N, Bülow I, Laurberg P, Perrild H, Ovesen L, Jørgensen T. Alcohol consumption is associated
with reduced prevalence of goitre and solitary thyroid nodules. Clinical endocrinology. 2001; 55(1):41–
46. doi:10.1046/j.1365-2265.2001.01325.xPMID:11453951
28. Lipton R, Hamelsky S, Kolodner K, Steiner T, Stewart W. Migraine, quality of life, and depression A pop-ulation-based case–control study. neurology. 2000; 55(5):629–635. doi:10.1212/WNL.55.5.629PMID: 10980724
29. Markus H, Hopkinson N. Migraine and headache in systemic lupus erythematosus and their relation-ship with antibodies against phospholipids. Journal of neurology. 1992; 239(1):39–42. doi:10.1007/ BF00839210PMID:1541968
30. SeferovićPM, Paulus WJ. Clinical diabetic cardiomyopathy: a two-faced disease with restrictive and
dilated phenotypes. European heart journal. 2015;p. ehv134.
31. Cook J, Carta L, Galatioto J, Ramirez F. Cardiovascular manifestations in Marfan syndrome and related diseases; multiple genes causing similar phenotypes. Clinical genetics. 2015; 87(1):11–20. doi:10. 1111/cge.12436PMID:24867163
32. Kodama S, Saito K, Yachi Y, Asumi M, Sugawara A, Totsuka K, et al. Association between serum uric acid and development of type 2 diabetes. Diabetes care. 2009; 32(9):1737–1742. doi: 10.2337/dc09-0288PMID:19549729
33. Taurines R, Schwenck C, Westerwald E, Sachse M, Siniatchkin M, Freitag C. ADHD and autism: differ-ential diagnosis or overlapping traits? A selective review. ADHD Attention Deficit and Hyperactivity Dis-orders. 2012; 4(3):115–139. doi:10.1007/s12402-012-0086-2PMID:22851255
34. Tabarés-Seisdedos R, Dumont N, Baudot A, Valderas JM, Climent J, Valencia A, et al. No paradox, no progress: inverse cancer comorbidity in people with other complex diseases. The lancet oncology. 2011; 12(6):604–608. doi:10.1016/S1470-2045(11)70041-9PMID:21498115