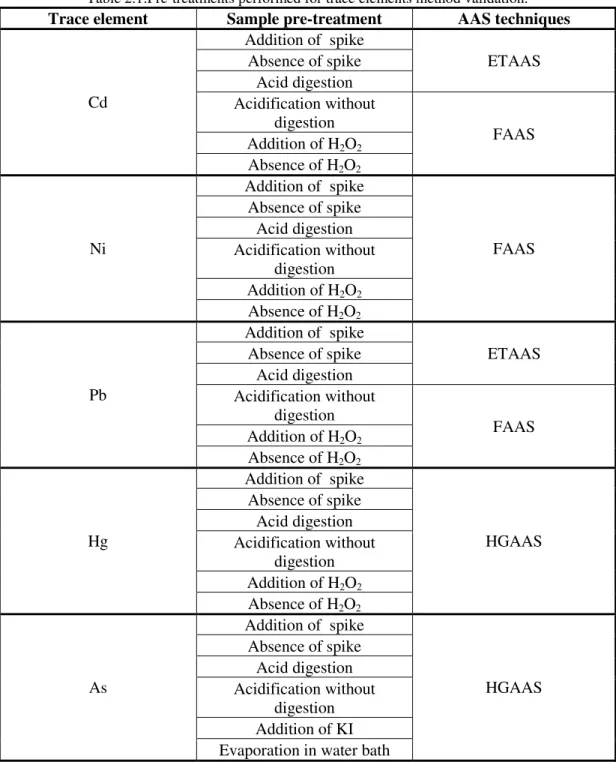
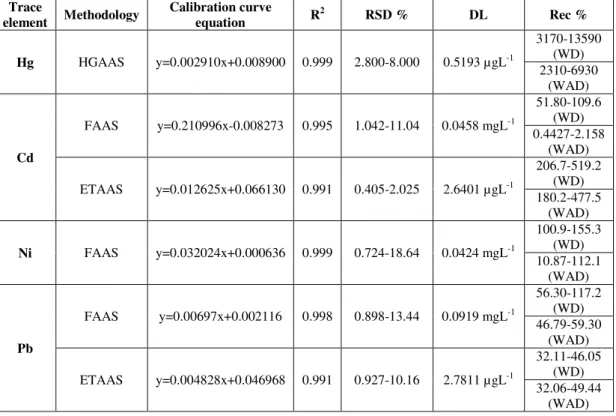
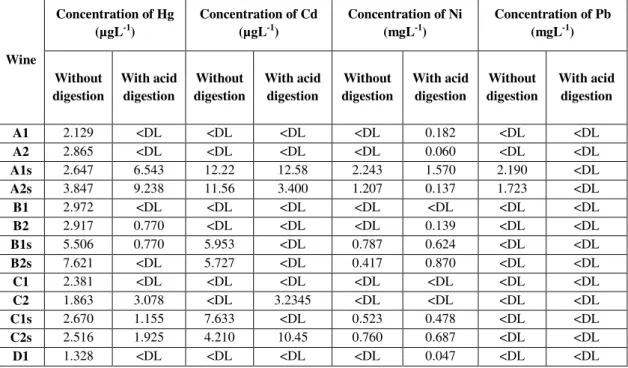
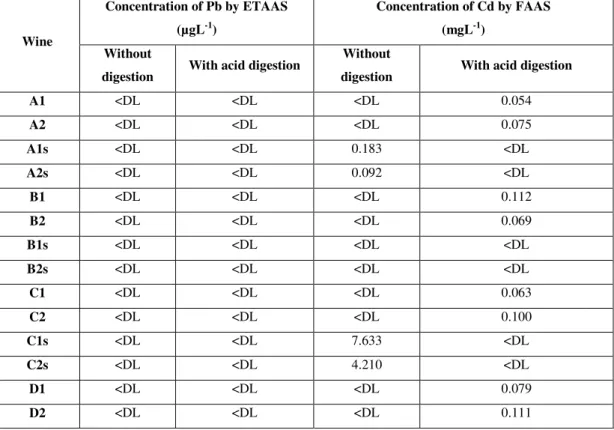
Trace elements quantification in Portuguese red wines
Texto
Imagem


Documentos relacionados
A disponibilidade de locais de abrigo é um elemento chave para a persistência e conservação de populações de carnívoros. Este trabalho avaliou a influência de
The work here (1) extends and generalizes Grunsky ’s equation beyond its original conditions, (2) establishes an underlying hydro-climate generalized model for average
Nous avons comparé les résultats obtenus par chromatographie en phase gazeuse avec ceux obtenus par chroma- tographie sur papier en vue d'apprécier les possibilités et les avantages
A maioria das lesões que afectam este complexo articular envolve a base do segundo metatársico 38,41 , de tal forma que o sinal radiográfico mais frequente e fiável da
Este é um relato de experiência de um caso como de mãe de um neonato prematuro e teve como objetivo relatar a experiência da visita domiciliar no âmbito da Atenção
Relativamente aos ensaios cíclicos, em termos de amortecimento equivalente, verificou-se, para os níveis de deformação impostos, uma tendência clara para a melhoria
De modo a determinar o potencial energético dos combustíveis florestais em cultivos de Pinus elliottii, foi analisada a melhor época de coleta deste material em função da
Se bem direcionados, os estudantes poderão utilizarem seus próprios dispositivos móveis celulares ou smartphones em sala de aula como ferramenta de suporte para as várias disciplinas
