GROWTH PARAMETERS ESTIMATES OF MAUROLICUS STEHMANNI
PARIN & KOBYLIANSKY 1996 (TELEOSTEI, STERNOPTICHYDAE) FROM SOUTH
AND SOUTHEASTERN BRAZILIAN WATERS
Andre Bellucco1, Ana Hara1; Eduardo Machado Almeida2 & Carmen Lucia Del Bianco Rossi-Wongtschowski1*
1
Instituto Oceanográfico da Universidade de São Paulo (Praça do Oceanográfico, 191 05508-900, São Paulo, SP, Brasil)
2
Instituto Brasileiro do Meio Ambiente e dos Recursos Naturais Renováveis - IBAMA (Praça da Feirinha, s/n, 68.375-000 Porto Trombetas, Oriximiná, Pará, PA, Brasil)
A
B S T R A C TThis paper on the otolith microstructure analysis of Maurolicus stehmanni presents estimates of the species growth parameters and longevity. The species inhabits the outer shelf and slope of the southern and southeastern Brazilian Exclusive Economic Zone (EEZ). Growth parameters are important for the knowledge of the species′ life history and rational management. M. stehmanni
constitutes an important link between the initial and final components of the alimentary chain of the open sea ecosystem, being one of the main food items for squids and large pelagic fish. Among the various applied methods those which presented the most coherent values for growth parameters and were best adapted to the von Bertallanfy′s equation were: L∞= 55mm K= 0.0088/day and to= 5.5 days Maurolicus stehmanni′s longevity is of less than one year (around 220 days) and the sagita daily otolith rings are useful for the determination of its age.
R
E S U M OEste estudo, baseado na análise da microestrutura dos otólitos de Maurolicus stehmanni, apresenta estimativas dos parâmetros de crescimento e longevidade para esta espécie que habita a plataforma externa e o talude da ZEE sul-sudeste do Brasil. Estes parâmetros são importantes para o conhecimento da estratégia de vida da espécie e para o manejo deste recurso, que constitui um importante elo entre os componentes iniciais e finais da teia alimentar no ecossistema de mar aberto, sendo um dos principais itens na dieta das lulas e grandes peixes pelágicos. Dentre os vários métodos aplicados, os valores dos parâmetros de crescimento mais coerentes com a estratégia da espécie e que melhor se ajustaram à equação de von Bertallanfy foram: L∞= 55mm K= 0.0088/dia e to= 5.5 dias. A espécie vive cerca de 220 dias e as marcas diárias nos otólitos sagita são apropriadas para a determinação da idade.
Descriptors: Maurolicus stehmanni, Daily growth, Growth equations, Mortality, Brazilian EEZ, Sternoptichydae.
Descritores: Maurolicus stehmanni, Anéis diários, Idade, Crescimento, ZEE Brasil, Sternoptichydae.
I
NTRODUCTIONAbundance and distribution studies have shown that Maurolicus stehmanni is the most numerous pelagic fish population in southern and southeastern Brazilian waters. Greig (2000) estimated the population biomass of the species at on million tons using acoustic scanning. Many species of the __________
Contr. no. 862 do Inst. oceanogr. da Usp.
genus are reported to be importantlinks between the initial and the final components of the food web in the open sea ecosystem, very often serving as food for squids and large pelagic fish such as tuna (Ankenbrandt, 1985; Haimovici et al., 1994; Ribeiro, 1996; Zavalla-Camin, 1981). Salvanes & Stockley (1996)concluded that a very closely related species,
fecundity, short life span and early maturation. Diel vertical migrations have been reported for M. stehmanni (Almeida, 2001) and other species of the genus (Kaartvedt et al., 1998). Maurolicus stehmanni
stands in the mesopelagic zone (at about 200 meters) in daytime, moving towards the surface at dusk for feeding. It is very well known that for mesopelagic species this vertical migration provides a good balance between food catchability (food intake) and predator avoidance (Clark & Levy, 1988). Most of the species′ diets are composed of zooplankton, mainly copepods and euphausiids (Kaartvedt et al., 1998; Ribeiro, 1996).
Parin & Kobyliansky (1996) showed that the genus Maurolicus consists of 15 allopatric species, M. stehmanni being distributed in the Western South Atlantic along the continental slope of South America, between 34° and 40°S. Many studies show similarities as regards their habitats and reproductive strategies (Salvanes & Stockley, 1996; Kristoffersen & Salvanes, 1998; Landeata & Castro, 2002). Unfortunately, growth studies have mainly been undertaken on Maurolicus muelleri (Gj∅saeter, 1981; Ikeda, 1994; Goodson et al., 1995; Salvanes et al.,
1996; Salvanes & Stockley, 1996; Ikeda, 1996; Kristoffersen & Salvanes, 1998), with the following results: maximum size 70 mm, first spawning at about one year old and life span of about three years. Only a few studies have estimated Maurolicus Von Bertalanffy′s growth parameters for this species (Yuuki, 1984).
Despite the importance of Maurolicus stehmanni in Brazilian waters, only Almeida (2001) wrote about the species growth and age based on annual otolith increment analysis. However the author himself considers his results inconclusive and points out the need for the evaluation of age and growth by means of otolith microstructure analysis. The aim of this paper is to present Maurolicus stehmanni growth parameters, based on the analysis of otolith microstructure.
M
ATERIAL ANDM
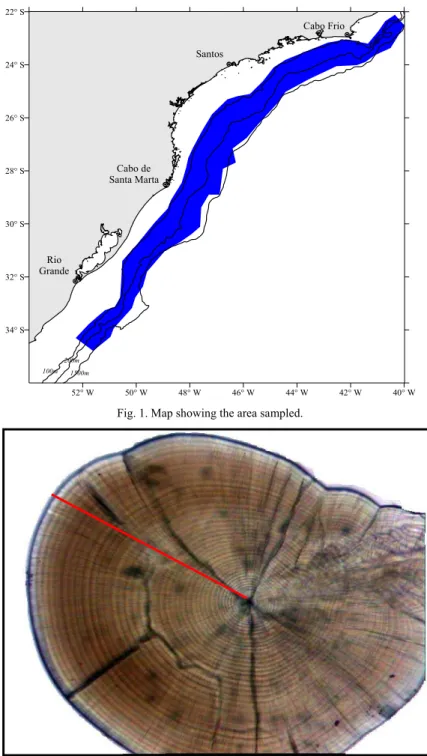
ETHODSDuring three hydroacoustic cruises undertaken by the R.V. “Atlântico Sul”, pelagic fish schools were detected and samples were collected using a mid-water trawl. These cruises took place in July-September 1996, April-May 1997 and November-December 1997, and were limited, to the north, by the Cabo de São Tomé (22ºS) and, to the south, by the Arroio Chuí (34ºS), at depths of between 100 and 1800 meters (Fig. 1). Hydrographic conditions were measured using a CTD-sounder at each of a total of 150 oceanographic stations. The samples collected were weighed and a subsample of each was counted and frozen.
After the cruises, the defrosted fish were measured in the laboratory to the nearest mm (standard total length (Sl) and total length (TL), these lengths being from the snout to the caudal peduncle and from the snout to the caudal fin, respectively), weighed (g), and sexed and the dried
sagittae otoliths were then stored for microstructure analysis.
The microstructural examination of the otoliths was undertaken in accordance with Campana & Neilson (1985), Secor et al. (1992) and Campana (2001).
Ten fish specimens were selected per 2 mm class interval ranging from 14 to 50 mm standard lengths, and the left otoliths were analyzed. To enhance the accuracy of the observation of the otolith increments they were mounted on glass slides using polyester resin, with their inner face turned downwards. In view of the fragility of these structures, the preparatory stage was carried out manually: first, the sagittae were ground with dry sandpaper of 1200 grit size, to the proximity of the nucleus; thereafter, they were ground with a finer sandpaper (9µ), altering the direction of the grinding by about 90º, until the scratches caused by the first sandpapering were obliterated; finally, to remove all the scratches, the otoliths were polished with a polishing cloth with diamond slurry, through circular movements.
The observation of the rings was carried out in accordance with Campana (1992) under the ligth transmitted by a microscope connected to a video camera and image analysis software. The otolith radius (Or) (the distance between the core of the nucleus and the margin) was, first, measured and then the increments along it were counted (Fig. 2).
The rings closest to the nucleus were too light to be seen and to solve this problem the mean number of incrementa contained in the first 20µ from the nucleus, along the radius, was obtained and this position adopted to begin the counting of the increments. The mean number of increments, within this distance, was calculated for 37 otoliths; six other were later added to the number of increments found in each sagitta. When the visibility of the rings was unclear under the radius the number of increments was taken from another position of the otoliths.
Two readers were involved in the counting. First, each reader (A ; B) made two readings (A1, A2,
and B1, B2). Then individual results were compared
Fig. 1. Map showing the area sampled.
Fig. 2. The sagitta otolith with radius indicated in red.
When any disagrement remained the otolith increments were counted simultaneously by the two readers (A4B4), observing the computer screen
connected to the microscope. If the readings were
unable to agree the otolith was rejected. The data on otolith lengths, otolith radii and number of rings were put into a data bank, to perform biological and related biometric analysis.
100m 200m
1500m
52° W 50° W 48° W 46° W 44° W 42° W 40° W 34° S
32° S 30° S 28° S 26° S 24° S 22° S
Rio Grande
Cabo de Santa Marta
Santos
A barplot was built to show the distribution of the standard length classes and sex of the species. The relationship between otolith and fish growth was established by plotting the values for standard length against otolith radii (Or). The values of Or and number of rings and also standard lengths and number of rings were analyzed, applying linear and exponential regression analysis and taking into account the resulting determination coefficient index and the parameters. Residual analysis was performed for the relationship between Sl and Or.
In order to verify which set of Von Bertalanffy′s model parameters was most appropriate to describethe growth of M. stehmanni three analyses were performed:
1- Ford Walford, as described in Vazzoler (1981) and Pauly (1984). For this purpose, as no full sequence of number of ring values was available for all length classes, sequences of 5 increment data were brought together and the average length values calculated. 2- Fishparmsoftware (Saila et al., 1988), and 3- Minimum square methodology (iterative) (Sparre & Venema, 1998) using the tool Solver from Excel,
with previously fixed and non-fixed values of L∞. The biggest fish used to calculate growth parameters was of 47 mm Sl, but fish of 50 mm appeared in the catches. The maximum length values entering the iterative method were fixed at between 50 and 60 mm.
Longevity was calculated in accordance with Pauly (1984).
R
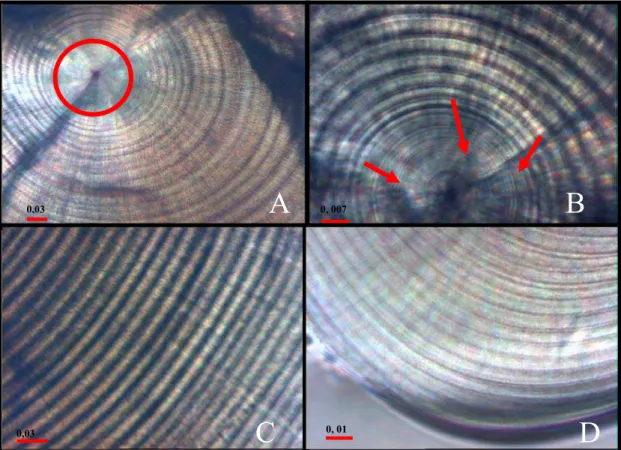
ESULTSThe saggitae otoliths of M. stehmanni are slightly rounded and laterally compressed in small fish, although in the larger ones their overall shape changes, becoming irregular with prominences on both ventral and dorsal faces. The distal face plane contains the acoustic sulcus and presents a convex proximal face. In the anterior and ventral region of the otolith there is a rostrum with concavities.
It is possible to distinguish different areas within this structure (Fig. 3): a clear central zone with smooth increments of varying width, sometimes unclear. This area is often delimited by a check and after it there is a dark and narrow area of irregular
Fig. 3. Sagitta otolith. A- the circled area shows the nuclear region with few visible rings. B- the arrows indicate the discontinuous region, irregular increments. C- intermediate region with regular increments. D- marginal region of a medium size otolith.
0,03 0, 007
0, 01
0,03
C
D
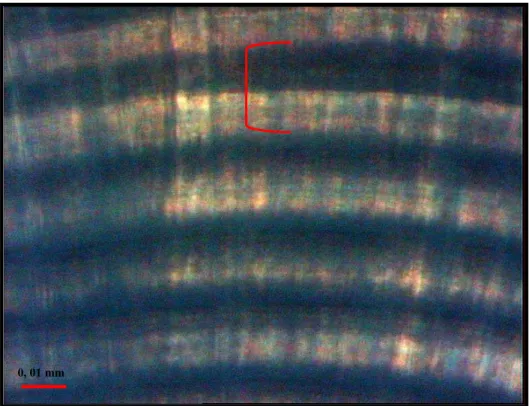
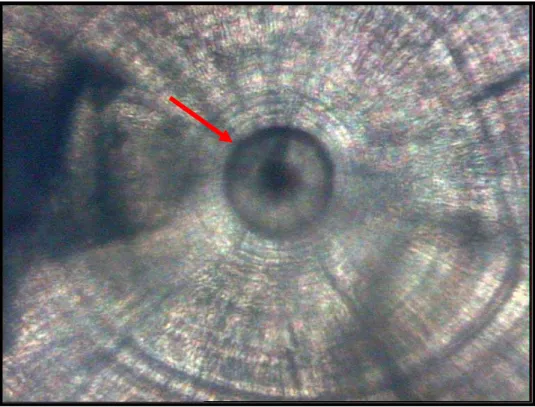
increments. The next region is the widest and here the increments are bipartite, present in a regular sequence, very similar to the typical structure of daily increments described by Campana & Neilson (1985) and Campana (1992) (Fig. 4). Moreover, the width of the increments increases along the otolith radius in this area. According to the otolith length, the marginal region presents high complexity with the smaller otoliths presenting well-defined increments, while the larger otoliths show very slight and overlapping increments. A dark ring is frequently observed about 5 to 7 µm from the nucleus (Fig. 5). Irregular checks of varying width are foundalong the sagitta.
The area of easiest reading of the sagittae
occursin the middle part between central and marginal regions, containing, in intermediate size otoliths, a large number of complete rings for which no well-developed margin is present. Counting the larger otoliths is difficult as a consequence of an increase in the curvature of their surface and the very close deposition of rings at the margin.
Although 212 otoliths were selected for analysis, 32 were lost during the preparation or mounting processes. In some cases, no reading was possible along the whole otolith radius (complete reading: 20 µm from the central position to the margin) because the marginal region was below the polished plane, making it difficult to see. Otoliths with partial readings, comprising a total of 36, were discarded from the analysis. Finally, 144 otoliths were read completely, 24 males, 37 females and 83 of fish of indistinguishable sex under macroscopical gonad observation (Fig. 6). Individuals of 23 mm Sl or less were mostly sexually undifferentiated due to the transportation or freezing processes and their gonads were invisible to the naked eye.
For fishes between 14 mm and 47 mm standard lengths the lower and higher numbers of rings were, respectively, 44 and 200. On average, 6 increments were found within the 20 µm .
Fig. 4. The bipartite structure of an increment.
Fig. 5. Sagitta otolith. The arrow indicates the probable hatch ring.
0 2 4 6 8 10 12 14 16 18 20
1 2 3 4 5 6 7 8 9 10 11 12 13 14 15 16 17
length (mm)
N
u
m
b
e
r
o
f
in
d
iv
id
u
a
ls
Males Females
Sexually indeterminated
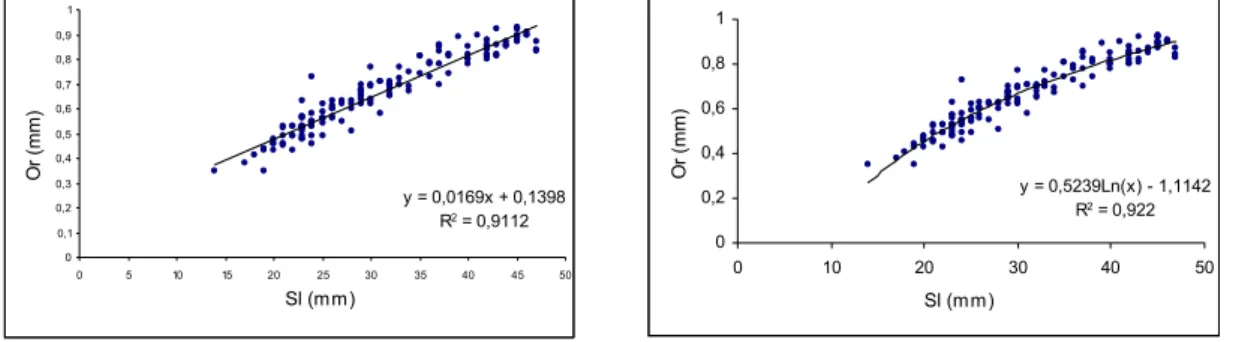
The linear and non-linear equations applied to Sl, Or and their relationships to the number of rings are shown in Figures 7, 8 and 9, respectively. On those scatter plots, exponential non-linear regression provides the best fit as between Or x Sl and Or x
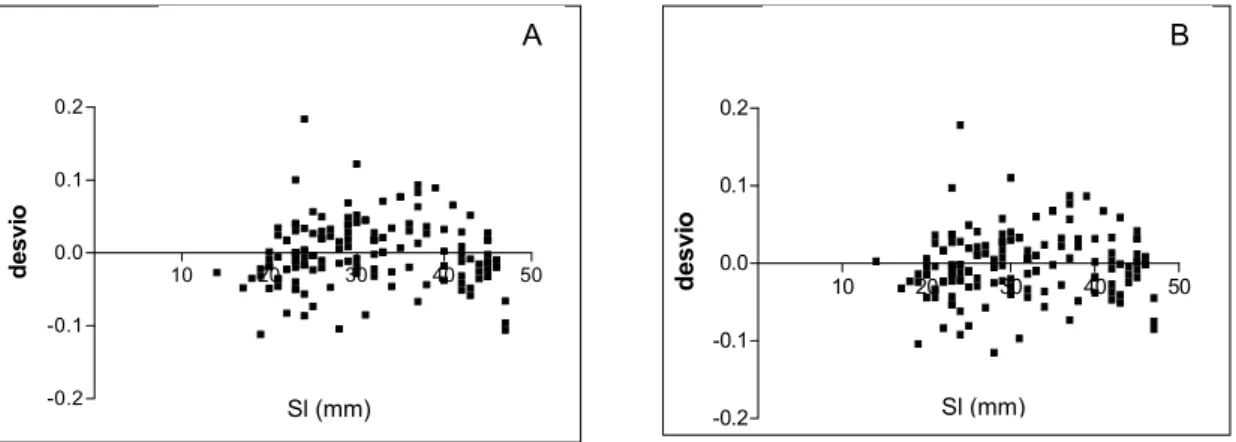
Number of Rings, as shown by the determination coefficient index. Between Sl x Number of Rings, the index was very similar but the linear equation presented the best value. Residual analysis for the regression between Sl and Or is given in Figure 10.
Fig. 7. Relationship between otolith radius (Or) and standard length (Sl).
Fig. 8. Relationship between number of rings and standard length (Sl).
Fig. 9. Relationships between otolith radius (Or) and number of rings.
The growth parameters and longevity estimates calculated in accordance with different methods are presented in Table 1. The minimum and maximum L∞ values were 53 mm and 70.18 mm; K,
1.64 and 3.54 year-1; and t0, 19.11 and 5.80 days,
respectively. Longevity values were between 0.83 and 1.55 years.
y = 0,0169x + 0,1398
R2 = 0,9112
0 0,1 0,2 0,3 0,4 0,5 0,6 0,7 0,8 0,9 1
0 5 10 15 20 25 30 35 40 45 50
Sl (mm) O r (m m )
y = 0,5239Ln(x) - 1,1142
R2 = 0,922
0 0,2 0,4 0,6 0,8 1
0 10 20 30 40 50
Sl (mm) O r (m m )
y = 19,431Ln(x) - 56,78
R2 = 0,8659
0 10 20 30 40 50 60
0 50 100 150 200
nº of rings
Sl
(mm
)
y = 0,1934x + 11,741
R2 = 0,8676
0 10 20 30 40 50 60
0 50 100 150 200
nº of rings
Sl
(
mm)
y = 0,0035x + 0,3209
R2 = 0,8784
0 0,2 0,4 0,6 0,8 1 1,2
0 50 100 150 200
nº of rings
O
r
(m
m
)
y = 0,3555Ln(x) - 0,9411 R2 = 0,9203
0 0,2 0,4 0,6 0,8 1 1,2
0 50 100 150 200
nº of rings
O
r
Fig. 10. Residual analysis of the relation between standard length and otolith radius. A-Linear regression. B- Nonlinear regression.
Table 1. The growth parameters and longevity estimates by different methods.
Method Linf K Annual K t0 Annual t0 Longevity (years)
Ford Walford 55.38 0.0057 2.08 11.9 0.032 1.44
Fishpam 70.18 0.0053 1.93 -7.7 -0.021 1.55
Iterative 1 (Linf not fixed) 76.3 0.0045 1.64 -13.2 -0.03 1.83
Iterative 2 (Fixed Linf) 53 0.0097 3.54 8.03 0.022 0.85
Iterative 3 (Fixed Linf) 55 0.0088 3.21 5.54 0.015 0.093
Iterative 4 (Fixed Linf) 58 0.0078 2.84 2.07 0.005 1.06
Iterative 5 (Fixed Linf) 60 0.0072 2.63 -0.065 -0.001 1.14
Almeida (2001) 48.5 0.46 -0.59 6.52
D
ISCUSSIONSince daily increment patterns were first recognized in otoliths (Pannella, 1971; 1974; Campana & Neilson, 1985; Gartner, 1991; Gj∅saeter et al., 1984; Linkowski, 1996; Brothers et al., 1976), they have been widely used as an accurate measurement for fish aging and are applied for the evaluation of stock (Molony & Sheaves, 2002). These increments are bipartite structures occurring through differential deposition of calcium carbonate and collagen-like protein during each day (Campana & Neilson, 1985). The otolith microstructure approach also provides a powerful tool for environmental and ecological studies (Campana & Neilson, 1985; Molony & Sheaves, 2002).
Age determination is usually exposed to many sources of error, some of them having serious effects on fish stock calculations (Campana, 2001; Neilson, 1992). For this reason, some methodological demands have to be met so to avoid mistakes, such as the two readers counting independently of each other.
There is a difficulty in reading bigger otoliths as a consequence of the characteristics of the structure of the deposited material itself. The otolith has three-dimensional growth, and the bigger it is, the wider will be the deposition of carbonate and other elements. During the otolith preparatory phase the
priority is to obtain a flat surface in which the nucleus is included and visible, giving a starting point for the readings. In these cases the optical microscope resolution (1000X), even under immersion oil, was sometimes unable to provide clear definition of the increments.
The definition of the increments is also difficult to identify in other regions of the otoliths, in which a slight alteration in the microscope focus may cause great variations in the number of rings, sometimes as much as doubling it. Intermediate rings have been found in other species that have had their daily deposition validated (Campana & Neilson, 1985), and have been called subdaily rings. The
sagittae otoliths of tropical fish are known to grow from 3 to 10 times faster than in those from cold waters, and they often show subdaily rings (Pannella, 1980) and checks, a dark-broad discontinuity zone which is probably related to environmental conditions or to migratory behavior.
There are many similarities between M. stehmanni increment characteristics (like shape and daily increments) and those of other fish (Campana & Neilson, 1985; Gartner, 1991; Gj∅saeter et al., 1984; Pannella, 1971; Reñones et al., 1999, Linkowski, 1996; Brothers et al., 1976). Gartner (1991) described different regions for myctophid species, according to the charactersitcs of the increments and the presence
Results-1:Nonlinear regression (curve fit):Residuals
10 20 30 40 50
-0.2 -0.1 0.0 0.1 0.2
Ls(mm)
d
e
s
v
io
Results-1:Linear regression:Residuals
10 20 30 40 50
-0.2 -0.1 0.0 0.1 0.2
Ls(mm)
d
e
s
v
io
A
B
of the checks, and their correspondence with larval, post-larval and post-metamorphic phases (Fig. 3). The dark increment often seen near nucleus of M. stehmanni is probably formed at hatching as confirmed by Ekau & Blay (2000) in Sarotherodon melanotheron.
Validation is usually undertaken using chemical markers (commonly tetracyclin) and observation of the otolith’s increments after a certain period. The mesopelagic and migratory behavior of M. stehmanni makes its maintenance and consequently any laboratory growth experiments and validation very complex. Moreover, the large number of successful validation studies carried out on hundreds of fish suggests that the likelihood of increments with these characteristics not deposited on a daily basis is small (Molony & Sheaves, 2002).
In the light of the fact that the deposition of the otoliths is regulated by endogenous and exogenous elements, that its diel vertical migration provides significant fluctuations in temperature, pressure and food availability thus modifying daily metabolic conditions, and that the deposition of the otoliths of M. stehmanni is similar to that of proven species, we may conclude that the deposition of its rings is daily.
The relationship between standard length and otolith radius length is best described by a non-linear equation as could be seen for the determination coefficient index, with the otoliths′ growth ratio decreasing in older fish after they have reached a certain length. Nevertheless, the residual analysis was similar in both regressions showing that the difference was subtle. This non-linear relation between Or and Sl was verifiable since the rings are deposited continuously and the width increments diminish, almost overlapping near the otoliths edge. This fact has often been verified for other species (Secor et al., 1989; Moksness & Fossum, 1992; Xiao, 1996).
Fish growth is commonly described by using Von Bertalanffy’s equation the parameters of which have physiological significance (Beverton & Holt, 1993) and for that reason has been chosen to define the relationship between Sl and number of rings.
As an r-strategist speciesit is expected that characteristics of M. stehmanni should be: high productivity, early expected mature life, fast development and growth, large numbers of offspring at an early age, first maturity at a low age, a high K value and a low value of L∞.
For M. stehmanni a higher K value might be expected in comparison to those of other species of the genus living in colder waters because of its greater metabolic rate and smaller size. For Maurolicus japonicus, Yuuki (1984) gives annual K values ranging between 1.42 (spring brood) and 0.96 (autumn brood) and a lifetime of around 20 months.
In the analysis of the results of the present study, it was found that the minimum square (iterative) methodologies 2 and 3 provided more reasonable growth parameter estimates, according to the biological characteristics of the species. According to this, M. stehmanni′s growth parameters on Brazilian coastal waters are: L∞ =53 ; 55 mm; K= 0.0097 ; 0.0088/day and to= +8.03 ; 5.5 days.
The low L∞values fixed for the maximum size found were foreseen for a real L∞ value. The species cannot take more than a year to attain its L∞, since the number of rings found never exceeds 200. These estimates gave higher K values as was expected for an r-strategist. Vaughan & Kanciruk (1982) have also confirmed that a non-linear methodology provides the best results for VBGF estimation.
FISHPARM and the first iterative methodology applied gave similar results, since these methods use similar algorithms to calculate growth parameters. Those calculations might be overestimating L∞, because fish over 50 mm never appeared in the samples. Furthermore, the longevity values exceed one year and thus do not correspond to the number of rings found. The application of the Ford- Walford method should always be regarded with suspicion since it is based on the correlation of two dependent variables and should be abandoned, as commented by Vaughan & Kanciruk (1982). Besides, except for the L∞, the other growth parameter values are not in accordance with what is known of the biological characteristics of the species.
Based on the annual otolith rings of M. stehmanni Almeida (2001) found an asymptotic length value of 48.5mm, a very low K growth rate and an expected lifetime of three years, which he observed were not to be expected in the light of values for other species of the genus. In accordance with Almeida’s idea a study based on daily otolihs rings like the present one best describes the species′ growth parameters.
A
CKNOWLEDGEMENTSThe authors wish to thank all of the many people who helped for during the research cruises collecting samples. The research project was supported by the Revizee Program, carried out in under the auspices of the Environment Ministry and the CNPq, which provided scholarships for the students Belluco and Hara.
R
EFERENCESBeverton, R. J. H. & Holt, S. J. 1993. On the dynamics of exploited fish populations. London, Chapman & Hall. Fish and Fisheries Series, 11:538 p.
Brothers, E. B.; Mathews, C. P. & Lasker, R. 1976. Daily growth increment in otoliths from larval and adult fishes. Fish. Bull., 74:1-8.
Campana, S. E. & Neilson, J. D. 1985. Microstructure of fish otoliths. Can. J. Fish. Aquat. Sci. 42:1014-1032. Campana, S. E. 1992. Measurement and interpretation of the
microstructure of fish otoliths. In:Stevenson, D. K. & Campana, S. E. eds. Otolith microstructure examination and analysis. Can. Spec. Publ. aquat. Sci., 117:59-71.
Campana, S. E. 2001. Accuracy, precision and quality control in age determination, including a review of the use and abuse of age validation methods. J. Fish. Biol., 59:197-242.
Clark, C. W. & Levy, D. A. 1988. Diel vertical migration by juvenile sockeye salmon and the antipredation window. Am. Nat., 131:271-290.
Ekau, W. & Blay, J. 2000. Validation of daily increment deposition and early development in the otoliths of
Sarotherodon melanotheron. J. Fish. Biol., 57:1539– 1549.
Gartner, J. V. Jr. 1991. Life histories of three species of lanternfishes (Pisces: Myctophidae) from the eastern Gulf of Mexico. 1. Morphological and microstructural analysis of sagittal otoliths. Mar. Biol., 111(1):11-21. Gjøsaeter, J.; Dayratne, P.; Bergstad, O. A.; Gjøsaeter, H.;
Sousa, M. I. & Beck, I. M. 1984. Ageing of tropical fish by growth rings in the otoliths. FAO Fisheries Circular, nº 776.
Gjøsaeter, J. 1981. Life history and ecology of Maurolicus muelleri (Gonastomatidae) in Norwegian waters. FiskDir. Skr., Ser. Hav. Unders., 17(3):109-131.
Goodson, M. S.; Giske, J. & Rosland, R. 1995. Growth and ovarian development of Maurolicus muelleri during spring. Mar. Biol., 124:185-195.
Haimovici, M.; Martins, A. S.; Figueiredo, J. L. & Vieira, P. C. 1994. Demersal bony fish of the outer shelf and upper slope of the southern Brazil subtropical convergence ecosystem. Mar. Ecol. Prog. Ser., 108(1-2):59-77. Ikeda, T. 1994. Growth and life cycle of the mesopelagic fish
Maurolicus muelleri (Sternoptychidae) in Toyama Bay, southern Japan Sea. Bull. Plankton Soc. Japan, 40(2):127-138.
Ikeda, T. 1996. Metabolism, body composition, and energy budget of the mesopelagic fish Maurolicus muelleri in the sea of Japan. Fish. Bull. 94(1):49-58.
Kaartvedt, S.; Knutsen, T. & Holst, J. C. 1998. Schooling of the vertically migrating mesopelagic fish Maurolicus muelleri on light summer nights. Mar. Ecol. Prog. Ser., 170:287-290.
Kristoffersen, J. B. & Salvanes, A. G. V. 1998. Life history of Maurolicus muelleri in fjordic and oceanic environments. J. Fish. Biol., 53:1324-1341.
Landaeta, M. F. & Castro, L. R. 2002. Spring spawning and early nursery zone of the mesopelagic fish Maurolicus parvipinnis at the coastal upwelling zone off Talcahuano, central Chile. Mar. Ecol. Prog. Ser., 226:179-191. Linkowski, T. B. 1996. Lunar rhythms of vertical migrations
coded in otolith microstructure of North Atlantic lanternfish, genus Hygophum (Myctophidae). Mar. Biol. 124:495-508.
Moksness, E. & Fossum, P. 1992. Daily growth rate and hatching-date distribution of Norwegian spring-spawning herring ( Clupea harengus L.). ICES J. mar. Sci., 49:217-221.
Molony, B. W. & Sheaves, M. J. 2002. Otolith increment widths as tools to record and assess environmental changes in estuarine areas. Mar. Tec. Soc. J. 36(1):44-51.
Neilson, J. D. 1992. Sources of error in otolith microstructure examination. In Stevenson, D. K. & Campana, S. E. eds. Otolith microstructure examination and analysis. Can. Spec. Publ. aquat. Sci., 117:115-125.
Pannella, G. 1971. Fish otoliths: daily growth layers and periodical patterns. Science, 173:1124-1127.
Pannella, G. 1974. Otolith growth patterns: an aid in age determination in temperate and tropical fishes. In: Bagenal, T. B. ed. Ageing of fishes. London, Unwin Bros. Ltd. p. 28-39.
Pannella, G. 1980. Growth patterns in fish sagittae. 519-556 In: Rhoads, D. C. & Lutz, R. A. eds. Skeletal growth of aquatic organisms: Biological records of environmental change. New York, Plenum Press. 725p.
Parin, N. V. & Kobyliansky, S. G. 1996. Diagnoses and distribution of fifteen species recognized in genus
Maurolicus Cocco (Sternoptychidae, Stomiiformes), with a key to their identification. Cybium, 20(2):185-195.
Pauly, D. 1984. Fish population dynamics in tropical waters. ICLARM. 325p.
Reñones, O.; Morales-Nin, B. & Deudero, S. 1999. Population size structure, age and growth of Nucrates ductor in the small scale FADs fishery of Mallorca Island (western Mediterranean). Sci. Mar., 63(3-4):355-366.
Saila, R. & Prager, M. H. 1988. Fishparm software. In: BASIC Fishery Biology Programs. Elsevier.
Salvanes, A. G. V. & Stockley, B. M. 1996. Spatial variation of growth and gonadal developments of Maurolicus muelleri in the Norwegian Sea and in Norwegian fjord. Mar. Biol., 126 (2):321-332.
Salvanes, A. G. V.; Bergstad, O. A.; Gordon, J. D. M.; Kristoffersen, J. B.; Lewis, J. L.; Stockley, B. M.; Thorkildsen, S. & Ullebust, H. 1996. Ecological investigations of the mesopelagic and deep-water, demersal fishes at the continental margin of the southeastern Norwegian sea and of the mesopelagic fishes in Herdlefjorden and Storfjorden. Inst. Fisk. Mar. Biol. Rapp., 9: 16p.
Secor, D. H.; Dean, J. M. & Baldevarona, R. B. 1989. Comparison of otolith growth and somatic growth in larval and juvenile fishes based on otolith length/fish length relationships. Rapp. P.-v. Réun. Cons. Int. Explor. Mer, 191:431-428.
Secor, D. H.; Dean, I. M. & Laban, E. H. 1992. Otolith Removal and preparation for microstrutural examination. In: Stevenson, D. K. & Campana, S. E. eds. Otolith microstructure examination and analysis. Can. spec. Publ. aquat. Sci., 117:19-57.
Vaughan, D. S. & Kanciruk, P. 1982. An empirical comparison of estimation procedures for the von Bertalanffy growth equation. J. Cons. Int. Explor. Mer., 40:211-219.
Vazzoler, A. E. A. de M. 1981. Manual de métodos para estudos biológicos de populações de peixes: crescimento e reprodução. Brasília, CNPq. Programa Nacional de Zoologia. 108 p.
Xiao, Y. 1996. How does somatic growth rate affect otolith size in fishes. Can. J. Fish. aquat. Sci., 53:1675-1682.
Yuuri, Y. 1984. Age and growth of a Sternoptychidae fish
Maurolicus muelleri in the South Western waters of the sea of Japan. Bull. Jap. Soc. Scient. Fish., 59(11):1849-1854.
Sources of Unpublished Material
Almeida, E. M. 2001. Estrutura da população, crescimento e reprodução de Maurolicus stehmanni Parin & Kobyliansky, 1993 (Teleostei: Sternoptychidae) na Zona Econômica Exclusiva do sul e sudeste do Brasil. M.Sc. Dissertation. Universidade de São Paulo, Instituto Oceanográfico. 118 p.
Greic, A. B. 2000. Determinação da distribuição e estimativa da abundância de Maurolicus muelleri (Gmelin, 1789); (teleostei: Sternoptychidae) por método hidroacústico na região sudeste-sul do Brasil, para a primavera de 1997. M.Sc. Dissertation. Rio Grande, Fundação Universidade do Rio Grande. 104 p.
Ribeiro, M. R. 1996. Estudos sobre o desenvolvimento larval, abundância e distribuição de ovos e larvas de Maurolicus muelleri (Gmelin, 1789) (Teleostei: Sternoptychidae), e possíveis potencialidades ao largo da costa sudeste brasileira, compreedida entre 23oS. (Cabo Frio-RJ) e
29oS (Cabo de Santa Marta Grande-SC). M.Sc.
Dissertation. Universidade de São Paulo, Instituto Oceanográfico. 160 p.
Zavala-Camin, L. A. 1981. Hábitos alimentares e distribuição dos atuns e afins (Osteichthyes - Teleostei) e suas relações ecologicas com outras espécies pelágicas das regiões sudeste e sul do Brasil. Phd. Thesis. Universidade de São Paulo, Instituto de Biociências. 237 p.