ACPD
12, 18067–18105, 2012Climate versus emission drivers of
methane lifetime
J. G. John et al.
Title Page
Abstract Introduction
Conclusions References
Tables Figures
◭ ◮
◭ ◮
Back Close
Full Screen / Esc
Printer-friendly Version
Interactive Discussion
Discussion
P
a
per
|
Dis
cussion
P
a
per
|
Discussion
P
a
per
|
Discussio
n
P
a
per
|
Atmos. Chem. Phys. Discuss., 12, 18067–18105, 2012 www.atmos-chem-phys-discuss.net/12/18067/2012/ doi:10.5194/acpd-12-18067-2012
© Author(s) 2012. CC Attribution 3.0 License.
Atmospheric Chemistry and Physics Discussions
This discussion paper is/has been under review for the journal Atmospheric Chemistry and Physics (ACP). Please refer to the corresponding final paper in ACP if available.
Climate versus emission drivers of
methane lifetime from 1860–2100
J. G. John1, A. M. Fiore1,*, V. Naik2, L. W. Horowitz1, and J. P. Dunne1
1
Geophysical Fluid Dynamics Laboratory/NOAA, Princeton, NJ, USA
2
UCAR/Geophysical Fluid Dynamics Laboratory, Princeton, NJ, USA
*
now at: Department of Earth and Environmental Sciences, and Lamont-Doherty Earth Observatory of Columbia University, Palisades, NY, USA
Received: 31 May 2012 – Accepted: 25 June 2012 – Published: 20 July 2012
Correspondence to: J. G. John (jasmin.john@noaa.gov)
ACPD
12, 18067–18105, 2012Climate versus emission drivers of
methane lifetime
J. G. John et al.
Title Page
Abstract Introduction
Conclusions References
Tables Figures
◭ ◮
◭ ◮
Back Close
Full Screen / Esc
Printer-friendly Version
Interactive Discussion
Discussion
P
a
per
|
Dis
cussion
P
a
per
|
Discussion
P
a
per
|
Discussio
n
P
a
per
|
Abstract
With a more-than-doubling in the atmospheric abundance of the potent greenhouse gas methane (CH4) since preindustrial times, and indications of renewed growth fol-lowing a leveling offin recent years, questions arise as to future trends and resulting climate and public health impacts from continued growth without mitigation. Changes in
5
atmospheric methane lifetime are determined by factors which regulate the abundance of OH, the primary methane removal mechanism, including changes in CH4 itself. We investigate the role of emissions of short-lived species and climate in determining the evolution of tropospheric methane lifetime in a suite of historical (1860–2005) and Rep-resentative Concentration Pathway (RCP) simulations (2006–2100), conducted with
10
the Geophysical Fluid Dynamics Laboratory (GFDL) fully coupled chemistry-climate model (CM3). From preindustrial to present, CM3 simulates an overall 5 % increase in CH4 lifetime due to a doubling of the methane burden which offsets coincident in-creases in nitrogen oxide (NOx) emissions. Over the last two decades, however, the methane lifetime declines steadily, coinciding with the most rapid climate warming
15
and observed slow-down in CH4growth rates, reflecting a possible negative feedback through the CH4 sink. The aerosol indirect effect plays a significant role in the CM3 climate and thus in the future evolution of the methane lifetime, due to the rapid pro-jected decline of aerosols under all four RCPs. In all scenarios, the methane lifetime decreases (by 5–13 %) except for the most extreme warming case (RCP8.5), where it
20
increases by 4 % due to the near-doubling of the CH4abundance, reflecting a positive feedback on the climate system. In the RCP4.5 scenario changes in short-lived climate forcing agents reinforce climate warming and enhance OH, leading to a more-than-doubling of the decrease in methane lifetime from 2006 to 2100 relative to a simulation in which only well-mixed greenhouse gases are allowed to change along the RCP4.5
25
ACPD
12, 18067–18105, 2012Climate versus emission drivers of
methane lifetime
J. G. John et al.
Title Page
Abstract Introduction
Conclusions References
Tables Figures
◭ ◮
◭ ◮
Back Close
Full Screen / Esc
Printer-friendly Version
Interactive Discussion
Discussion
P
a
per
|
Dis
cussion
P
a
per
|
Discussion
P
a
per
|
Discussio
n
P
a
per
|
1 Introduction
Atmospheric methane (CH4) is the second most important anthropogenic greenhouse gas after carbon dioxide (CO2), reflecting its stronger heat-trapping efficiency (100-yr global warming potential of 25) and more-than-doubling in abundance since pre-industrial times (Forster et al., 2007). As a precursor to global tropospheric ozone (O3) 5
(e.g. Prather et al., 2003), the third most important greenhouse gas, methane exerts an additional indirect influence on climate (Shindell et al., 2005), as well as on background levels of surface O3(Fiore et al., 2002), with corresponding adverse impacts on human health (West et al., 2006). We examine here the role of changes in emissions versus climate on atmospheric methane lifetime evolution on decadal-to-century time scales.
10
The contemporary methane budget includes both natural and anthropogenic sources. The largest natural source of methane is wetlands, with smaller
contribu-tions from termites, oceans and methane hydrates. Anthropogenic CH4 sources
in-clude rice paddies, ruminants, coal and natural gas, landfills and biomass burning – together these account for over 60 % of the present-day global budget (Table 7.6 in
15
Denman et al., 2007). The major sink of methane is oxidation by the hydroxyl radical (OH) in the troposphere (Levy, 1971), with smaller losses from absorption by soils, stratospheric destruction, and possible oxidation by atomic chlorine in the marine at-mospheric boundary layer (Allan et al., 2005). While the global sources and sinks of methane are fairly well known and currently in approximate balance (annual source and
20
sink strengths estimated at 582 Tg CH4 and 581 Tg CH4, respectively, Denman et al., 2007), uncertainties exist in their trends and in the contributions from individual source sectors.
Prior studies have established the dominant role of the tropical lower troposphere in oxidation of CH4due to high OH abundance and temperatures (as the CH4+OH
reac-25
tion rate constant is strongly sensitive to temperature,∼2 % K−1) (Logan et al., 1981;
ACPD
12, 18067–18105, 2012Climate versus emission drivers of
methane lifetime
J. G. John et al.
Title Page
Abstract Introduction
Conclusions References
Tables Figures
◭ ◮
◭ ◮
Back Close
Full Screen / Esc
Printer-friendly Version
Interactive Discussion
Discussion
P
a
per
|
Dis
cussion
P
a
per
|
Discussion
P
a
per
|
Discussio
n
P
a
per
|
tropics and 79 %–90 % CH4 loss below 500 hPa (Spivakovsky et al., 2000; Lawrence et al., 2001; Fiore et al., 2008). Using OH estimates constrained by methyl chloro-form (CH3CCl3) measurements for the period 1978–2005, Prinn et al. (2005) derived a methane lifetime of 10.2+−0.90.7yr due to tropospheric OH loss. Dentener et al. (2003) used a chemistry-transport model to calculate a global average tropospheric
life-5
time of 9.0±0.13 yr for the period 1979–1993, while Stevenson et al. (2006)
ob-tained a present-day total lifetime of 8.67±1.32 yr from a multi-model ensemble study;
the multi-model range in total lifetimes in the latter study implies a lifetime range of 9.90+−1.681.76yr with respect to tropospheric OH.
The OH abundance and distribution reflect a complex interplay among various
fac-10
tors including anthropogenic and natural emissions, as well as meteorological pro-cesses that may change with climate. Increases in atmospheric CH4 burden, carbon monoxide (CO), and non-methane volatile organic compounds (NMVOCs) all act to decrease OH concentrations and increase the methane lifetime. Increases in UV (pho-tolysis frequencies viz. J(O1D)), water vapor (H2O), and nitrogen oxide (NOx) sources 15
tend to increase OH, which in turn decreases the atmospheric lifetime of methane. The non-linearities in OH chemistry complicate definitive attributions to individual processes controlling OH (e.g. Spivakovsky et al., 2000).
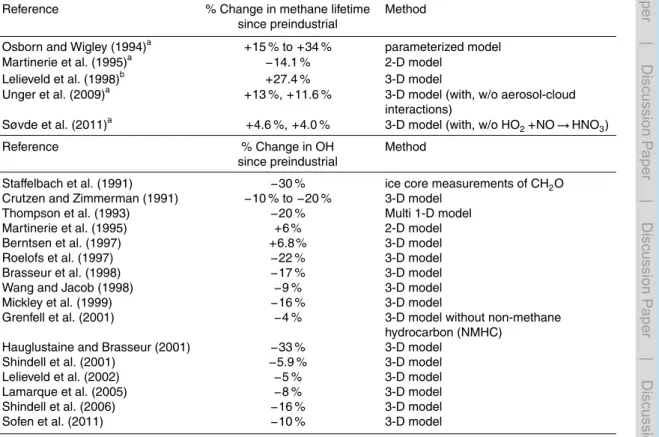
Since the pre-industrial period, the concentration of methane in the atmosphere has risen rapidly from about 700 ppb (Fl ¨uckiger et al., 2002) in 1750, to a present-day value
20
of nearly 1800 ppb. There is as yet no consensus, however, on the change in methane lifetime during this period, with estimates ranging from a 14 % decrease to a 34 % increase (cf. Table 1). This wide range reflects uncertainty in the sign of changes in OH concentrations since the pre-industrial. For example, Staffelbach et al. (1991) inferred a 30 % decrease in polar regions based on ice-core measurements of formaldehyde
25
(CH2O), while model estimates suggest smaller decreases or even increases globally (Table 1).
ACPD
12, 18067–18105, 2012Climate versus emission drivers of
methane lifetime
J. G. John et al.
Title Page
Abstract Introduction
Conclusions References
Tables Figures
◭ ◮
◭ ◮
Back Close
Full Screen / Esc
Printer-friendly Version
Interactive Discussion
Discussion
P
a
per
|
Dis
cussion
P
a
per
|
Discussion
P
a
per
|
Discussio
n
P
a
per
|
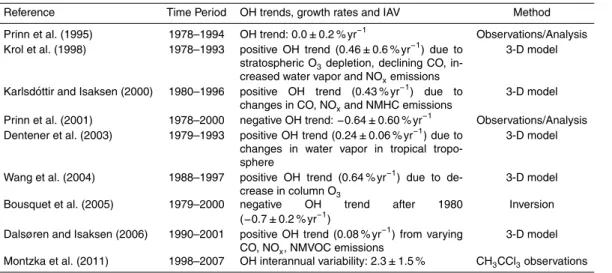
attributing small changes (a few percent of the large CH4atmospheric abundance) un-ambiguously to the many individual processes exerting multiple competing influences on OH is complicated. For example, Krol et al. (1998) report a positive OH trend of 0.46 % yr−1from 1978–1993 due to combination of stratospheric O3loss, reduced car-bon monoxide concentrations, and increases in water vapor abundance and NOx emis-5
sions, while Dentener et al. (2003) attribute an increase in OH trend from 1979–1993 to water vapor in the tropical troposphere (Table 2).
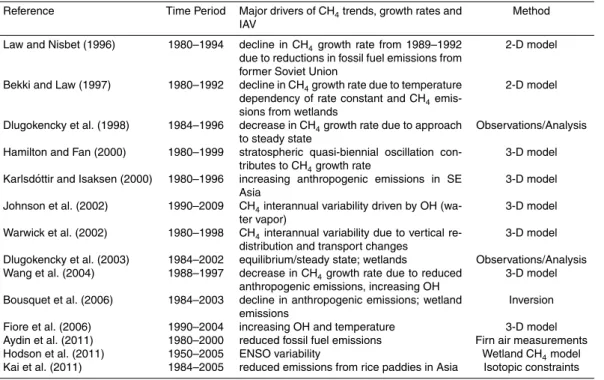
The growth rate of atmospheric methane increased steadily until 1990, after which it declined (Dlugokencky et al., 1998), leading to a leveling offfrom 1999 to 2007. Obser-vations suggest that the atmospheric methane concentration since 2007 is once again
10
on the rise (Rigby et al., 2008). Attribution of the slow-down in growth rate during the 1990s is quite complicated as the changes are small and there are many competing influences at work. Hypotheses to explain the observed CH4trends in recent decades have ranged from a steady-state equilibrium of methane sources and sinks (Dlugo-kencky et al., 1998), to decreases in natural and/or anthropogenic emissions (e.g. Kai
15
et al., 2011), as well as variations in meteorological factors and processes (e.g. Fiore et al., 2006; Hodson et al., 2011; cf. Table 2).
Here we investigate the relative importance of changes in anthropogenic emissions versus climate in contributing to changes in the methane lifetime from 1860 to 2100 in the context of the new set of historical and future emission scenarios (Lamarque et al.,
20
2010; Meinshausen et al., 2011; van Vuuren et al., 2011a) developed for the fifth phase of the Coupled Model Intercomparison Project (CMIP5) (Taylor et al., 2012), in support of the Intergovernmental Panel on Climate Change (IPCC) Fifth Assessment (AR5). We use a state-of-the-art global fully coupled climate-chemistry model, the Geophysical Fluid Dynamics Laboratory Coupled Model version 3 (CM3) to examine the drivers and
25
ACPD
12, 18067–18105, 2012Climate versus emission drivers of
methane lifetime
J. G. John et al.
Title Page
Abstract Introduction
Conclusions References
Tables Figures
◭ ◮
◭ ◮
Back Close
Full Screen / Esc
Printer-friendly Version
Interactive Discussion
Discussion
P
a
per
|
Dis
cussion
P
a
per
|
Discussion
P
a
per
|
Discussio
n
P
a
per
|
2 Model description and simulations
The Geophysical Fluid Dynamics Laboratory CM3 Model incorporates an atmospheric chemistry model within the fully interactive framework of the atmosphere, ocean, land, and sea-ice components (Donner et al., 2011; Naik et al., 2012; Griffies et al., 2011; C. Milly, personal communication, 2012; Shevliakova et al., 2009). We provide here
5
a summary of the features most relevant to the simulation of OH.
The CM3 model simulates interactive tropospheric and stratospheric chemistry, achieved by merging the mechanisms from MOZART-2 (Horowitz et al., 2003) and AM-TRAC (Austin and Wilson, 2006), respectively, as described by Naik et al. (2012) who evaluate global trace gas distributions over recent decades with in situ measurements
10
of O3 and other OH precursors. The model simulates atmospheric concentrations of 97 chemical species, 12 of which are aerosol species. Photolysis rates are not directly affected by changes in aerosols, except through clouds. Global mean CH4and nitrous oxide (N2O) concentrations are restored with a timestep of 1 day, to a lower boundary condition (below 800 hPa) for chemistry. The impact of climate change on CH4 emis-15
sions from wetlands (and any other natural sources); from wildfires; and from other biogenic precursors to OH which can influence the CH4 lifetime (such as NMVOC and soil nitrogen oxide emissions), are not included. Inclusion of these feedbacks would likely alter the findings here, though uncertainties are large (Arneth et al., 2010). The model applies climatological biogenic isoprene and soil NOx emissions as in Horowitz 20
(2006). Lightning NOx (LNOx) is the only natural source that is tied to the model me-teorology and thus can respond to changes in climate. The parameterization of both continental and oceanic lightning NOxis based on empirical relationships between con-vective cloud top heights and lightning flash frequencies as in Horowitz et al. (2003), Price et al. (1997) and Levy et al. (1996).
25
ACPD
12, 18067–18105, 2012Climate versus emission drivers of
methane lifetime
J. G. John et al.
Title Page
Abstract Introduction
Conclusions References
Tables Figures
◭ ◮
◭ ◮
Back Close
Full Screen / Esc
Printer-friendly Version
Interactive Discussion
Discussion
P
a
per
|
Dis
cussion
P
a
per
|
Discussion
P
a
per
|
Discussio
n
P
a
per
|
(HIST) were branched from CONTROL after achieving a stable, realistic climate (L. Horowitz, personal communication, 2012). Both vegetation dynamics and land use (defined as land use change plus harvesting) were activated in the land model compo-nent of CM3 for all historical simulations and future projections.
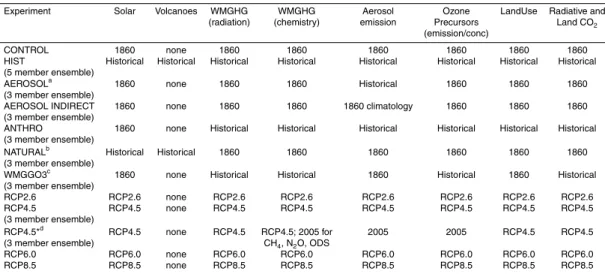
In addition to the historical model ensemble where all forcings vary in time as
de-5
scribed by Lamarque et al. (2010), additional “single-forcing” experiments were con-ducted in which an individual forcing is allowed to vary with time, with other forcings held constant at 1860 levels. The specifications for these 3-member ensemble simu-lations, viz. AEROSOL, AEROSOL INDIRECT, ANTHRO, NATURAL, and WMGGO3, are described in Table 3. In AEROSOL INDIRECT, aerosol and aerosol precursor
emis-10
sions vary as in HIST, but an 1860 climatology taken from years 1–20 of CONTROL is
used for radiation. The difference between the AEROSOL and AEROSOL INDIRECT
simulations therefore reflects the contribution from the aerosol direct effect. Land use fractions are held at 1860 values (i.e. there are no land use transitions) in AEROSOL,
AEROSOL INDIRECT, NATURAL and WMGGO3. CO2 concentrations for radiation
15
and land plant photosynthesis are held constant at the 1860 value of 286.15 ppm in AEROSOL, AEROSOL INDIRECT and NATURAL. These simulations can be used to investigate key drivers of overall historical changes, to isolate the “forced” response (i.e., to anthropogenic emissions), and to separate climate drivers (temperature, H2O, J(O1D), lightning NOx) from anthropogenic emission drivers (CO and NOx emissions,
20
CH4concentrations) of methane lifetime within time periods.
Future projections use time-varying forcings as recommended for the new Repre-sentative Concentration Pathways (RCPs) scenarios developed for CMIP5 in support of IPCC AR5 (Table 3). The year 2100 radiative forcing (RF) of the four projection path-ways ranges from 2.6 to 8.5 W m−2 (Moss et al., 2010). At the low end, RCP2.6 (also
25
called RCP3-PD) is a peak and decline scenario, with greenhouse gas emissions peak-ing early in the century and then declinpeak-ing thereafter (van Vuuren et al., 2011b). In this scenario, RF peaks at∼3 W m−2mid-century and then falls to 2.6 W m−2by 2100. The
ACPD
12, 18067–18105, 2012Climate versus emission drivers of
methane lifetime
J. G. John et al.
Title Page
Abstract Introduction
Conclusions References
Tables Figures
◭ ◮
◭ ◮
Back Close
Full Screen / Esc
Printer-friendly Version
Interactive Discussion
Discussion
P
a
per
|
Dis
cussion
P
a
per
|
Discussion
P
a
per
|
Discussio
n
P
a
per
|
2011) are stabilization without overshoot pathways, with total RF reaching 4.5 W m−2 and 6.0 W m−2 respectively at stabilization (2100). The most drastic warming scenario is RCP8.5 which has rapidly increasing greenhouse gas emissions throughout the next century, and reaches a RF of 8.5 W m−2by 2100 (Riahi et al., 2011).
CH4 emissions (and concentrations) peak in 2010 and then decline rapidly in
5
RCP2.6; are relatively stable, but higher, in RCP4.5 and RCP6.0; and rise rapidly to significantly higher values in RCP8.5. In all four RCP scenarios, emissions of aerosols and their precursors, as well as of non-methane OH precursors (i.e., NOx, NMVOC, CO) are assumed to decline, under the assumption of aggressive air pollution abate-ment strategies (van Vuuren et al., 2011a). An additional 3-member model ensemble
10
(RCP4.5*), identical to RCP4.5, but with aerosol emissions, O3precursors, CH4, N2O and ozone-depleting substances (ODS) for chemistry held at year 2005 values, enables us to isolate the role of a warming climate from that of emission changes of chemically active species on the methane lifetime evolution under the RCP4.5 scenario. Compar-isons across these scenarios can yield process-level insight into the factors dominating
15
the methane lifetime evolution over the next century.
3 Approach
We define the global annual mean lifetime of methane against tropospheric OH,τCH4, as the quotient of the global total atmospheric methane burden [CH4], and the globally integrated tropospheric CH4loss rate,k(T) [OH][CH4]:
20
τCH 4 =
RTOA
surface[CH4] Rtropopause
surface k(T) [OH] [CH4]
(1)
where the rate constant, k(T)=2.45×10⁻¹²e−1775/T (molec−1cm−3s−1) is from JPL
ACPD
12, 18067–18105, 2012Climate versus emission drivers of
methane lifetime
J. G. John et al.
Title Page
Abstract Introduction
Conclusions References
Tables Figures
◭ ◮
◭ ◮
Back Close
Full Screen / Esc
Printer-friendly Version
Interactive Discussion
Discussion
P
a
per
|
Dis
cussion
P
a
per
|
Discussion
P
a
per
|
Discussio
n
P
a
per
|
year 1860 of the appropriate historical ensemble member, and is applied to all simula-tion years.
Results are averaged over ensemble members where available. For our 1860 CON-TROL simulation (Table 3), the mean and standard deviation of τCH4 averaged over 200 yr is 8.06±0.08 yr, which is within the range of preindustrial estimates (6.71–
5
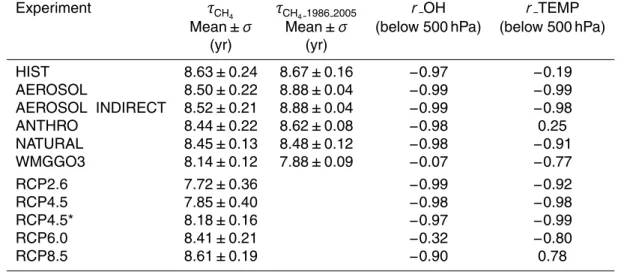
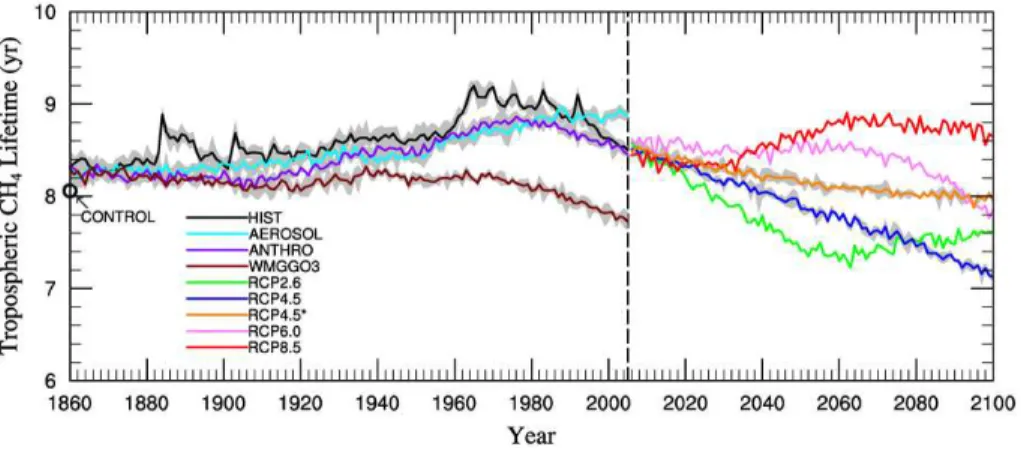
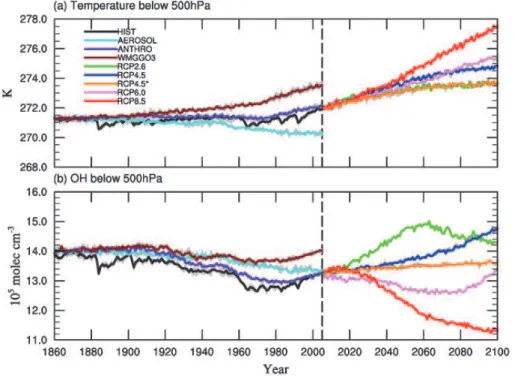
12.8 yr) simulated by other models (Martinerie et al., 1995; Unger et al., 2009; S ¨ovde et al., 2011). Figure 1 shows the temporal evolution of the global annual mean tropo-spheric methane lifetime in the CM3/CMIP5 historical simulations and future projec-tions, and in Table 4 we report the mean and standard deviation ofτCH4, as well as the correlation coefficient ofτCH4 with the global mean lower tropospheric (below 500 hPa) 10
airmass-weighted OH concentration and temperature, over the full length of the model simulations.
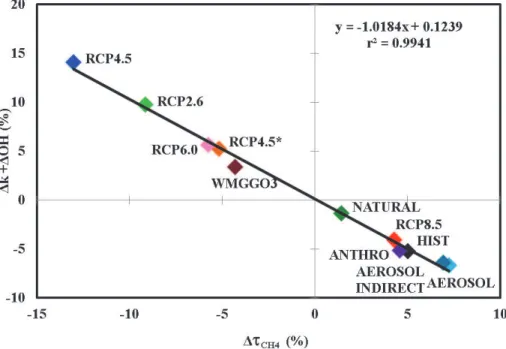
Globally, percent changes in the reaction rate constant (∆k) and in OH abundances in the lower tropical troposphere (∆OH) should sum to the magnitude of the overall percent change in methane lifetime (∆τCH4), as confirmed in Fig. 2 which shows the 15
linearity between these terms, obtained by differencing 20-yr averages from the start and end of the various model simulations (r2=0.99). In Table 5 we present the temper-ature change, along with percent changes ofτCH4,k, OH, CH4, CO emissions, surface
NO emissions, LNOx and J(O
1
D) over 20-yr periods at the beginning and end of the model simulations, noting the non-linear interactions of the individual processes in
con-20
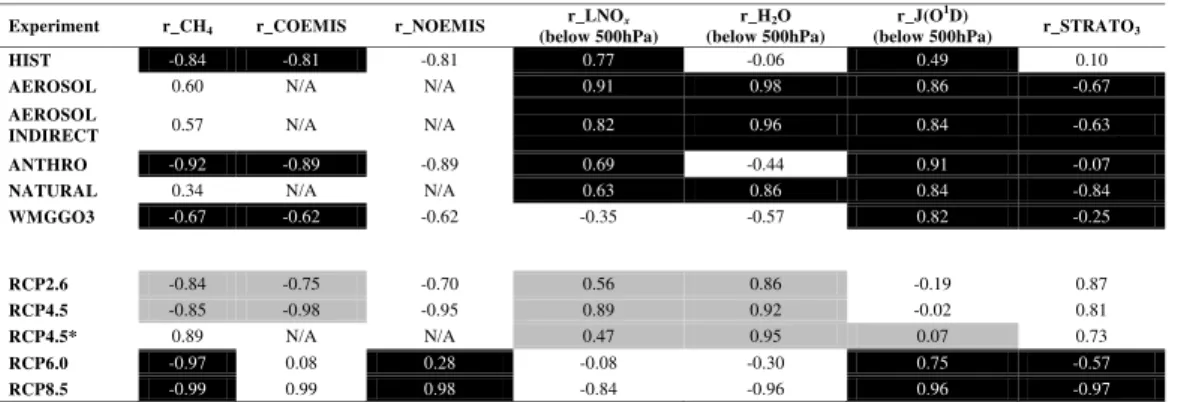
tributing to the net changes in OH, while Table 6 reports the correlations of OH with CH4, CO emissions, surface NO emissions, the lightning NOxsource (which is not in-cluded in the total surface NO emissions), lower tropospheric O3photolysis rates and stratospheric O3 over the full model simulation periods (146 yr for historical and 95 yr for RCPs).
25
ACPD
12, 18067–18105, 2012Climate versus emission drivers of
methane lifetime
J. G. John et al.
Title Page
Abstract Introduction
Conclusions References
Tables Figures
◭ ◮
◭ ◮
Back Close
Full Screen / Esc
Printer-friendly Version
Interactive Discussion
Discussion
P
a
per
|
Dis
cussion
P
a
per
|
Discussion
P
a
per
|
Discussio
n
P
a
per
|
4 Historical period (1860–2005)
We first separate the anthropogenic forcing from natural variability by comparing the HIST and ANTHRO ensembles (Table 3). We then further separate ANTHRO into influ-ences from aerosol versus well-mixed greenhouse gas by comparing AEROSOL (and AEROSOL INDIRECT) with WMGGO3.
5
4.1 Overall drivers of methane lifetime
For the HIST five-member ensemble, the global mean tropospheric methane lifetime over the period 1860 to 2005 is 8.63±0.24 yr (Table 4), with an overall 5 % increase
from 1860–1879 to 1986–2005. τCH4 is strongly anti-correlated with the global mean airmass-weighted OH below 500 hPa (Table 4), which shows an almost 6 % decrease
10
from 1860–1879 to 1986–2005 (Table 5). In a sensitivity simulation in which only emis-sions of NOx, CO, NMVOC, and aerosols (or their precursors) increase from 1860 to 2000, Naik et al. (2012) find a 14 % decrease in methane lifetime from preindustrial to present. We therefore attribute the increase inτCH4 solely to the doubling of the global methane burden in HIST, which offsets the shortening ofτCH4 due to the quadrupling 15
of NOxemissions (Table 5). The warming over the historical period has little impact, as demonstrated by the weak correlation with temperature in Table 4.
The “single-forcing” simulations (Table 3) provide additional insights into the relative importance of individual processes in driving the changes in HIST. The lifetime in-creases in all of the single-forcing simulations, with the exception of WMGGO3 where
20
τCH4 decreases by 4.3 % (Table 5, Fig. 1). The consistency of the overallτCH4changes between ANTHRO and HIST confirms the dominant role of anthropogenic drivers, as opposed to natural forcings, in shaping theτCH4evolution over the historical period. The percent change in the methane loss rate due to the temperature dependence of the re-action rate constant from 1860–1879 to 1986–2005 in ANTHRO is almost double that of
25
ACPD
12, 18067–18105, 2012Climate versus emission drivers of
methane lifetime
J. G. John et al.
Title Page
Abstract Introduction
Conclusions References
Tables Figures
◭ ◮
◭ ◮
Back Close
Full Screen / Esc
Printer-friendly Version
Interactive Discussion
Discussion
P
a
per
|
Dis
cussion
P
a
per
|
Discussion
P
a
per
|
Discussio
n
P
a
per
|
CH4is comparable to that of HIST due to an offsetting larger decrease in OH (Table 5, Fig. 3b). Correlations of OH with CO emissions, CH4and J(O1D) (Table 6) are stronger in ANTHRO as the “forced” signal in HIST is masked by natural variability (e.g. volca-noes) to some extent. Without the effects of natural forcings, the averageτCH4 over the period 1860 to 2005 is 2.2 % lower (compare ANTHRO with HIST in Table 4).
5
The largest increases inτCH4 from 1860–1879 to 1986–2005 occur in the AEROSOL and AEROSOL INDIRECT simulations (∼7 % each in Table 5). These larger increases
as compared to HIST are driven entirely by aerosol-induced climate feedbacks on both temperature and OH, with the OH impact onτCH4 almost double that of the temper-ature effect (Table 5). The overall reduction in OH can be attributed solely to climate
10
change in response to aerosol increases over the historical period because the CH4 burden and emissions of CO and NO are held constant at 1860 values in these simu-lations (Table 3). OH concentrations in AEROSOL and AEROSOL INDIRECT strongly correlate with lightning NOx, water vapor and J(O1D) (all below 500 hPa) (Table 6). The consistency between the AEROSOL INDIRECT and AEROSOL in the evolution of
tro-15
pospheric methane lifetime (identical correlations ofτCH4 against temperature and OH below 500 hPa in Table 4; similar percentage changes in Table 5 and correlations of OH versus the climate factors in Table 6), imply that aerosol-cloud interactions (indirect effect) dominate the CM3 climate response to aerosols (L. Horowitz, personal commu-nication, 2012). τCH4 in our model is therefore sensitive to the aerosol indirect effect 20
(Unger et al., 2009).
In ANTHRO, aerosol-induced cooling is offset by increases in temperature and OH associated with rising greenhouse gases (Fig. 3). Indeed,τCH4 is considerably short-ened in WMGGO3 due to a large warming (Fig. 3a), which leads the CH4+OH reaction rate constant to increase by factors of about 6 and 3.3, respectively, compared to HIST
25
and ANTHRO (4.6 % vs. 0.8 % and 1.4 % in Table 5). In this ensemble, the changes
in CH4 burden, CO and NO emissions are the same as in HIST and ANTHRO
(Ta-bles 3, 5), but rising temperatures (∼2K by 2005) – and the associated rise in water
ACPD
12, 18067–18105, 2012Climate versus emission drivers of
methane lifetime
J. G. John et al.
Title Page
Abstract Introduction
Conclusions References
Tables Figures
◭ ◮
◭ ◮
Back Close
Full Screen / Esc
Printer-friendly Version
Interactive Discussion
Discussion
P
a
per
|
Dis
cussion
P
a
per
|
Discussion
P
a
per
|
Discussio
n
P
a
per
|
serve to driveτCH4down (Table 5), so that the lifetime of methane is markedly reduced in WMGGO3. The single-forcing experiments thus serve to illustrate that the overall changes in HIST and ANTHRO reflect a complex balance among several opposing influences on temperature and OH, both of which determine the overallτCH4 evolution.
4.2 Selected periods within the historical simulations
5
Although we conclude that CH4 anthropogenic emissions drive the overall changes in
τCH4 from 1860 to the present, climate feedbacks are evident for specific time periods in HIST. Following volcanic events such as Krakatoa (1883), Agung (1963), El Chich ´on (1982) and Pinatubo (1991), methane lifetime peaks (Fig. 1), resulting from strong stratospheric aerosol-induced cooling in the model and the associated decrease in
10
water vapor (Figs. 3a, 4b). OH is reduced as a result of the lower atmospheric humidity, as well as decreases in lightning NOx(Fig. 4a); with minima in temperature, OH, water vapor and LNOx coinciding with the peak methane lifetimes occurring in 1884, 1965, 1983 and 1992.
In WMGGO3, the wide scatter of τCH4 with OH over the full simulation period
15
(slope=−0.1) arising from changes in the slope ofτCH4(due to different rates of change of temperature and OH) from 1860–1920, 1921–1970, and 1971–2005, results in an absence of overall correlation (Table 4). Temperature and associated water vapor rise gradually initially, and then more sharply after the 1960s. From 1921–1970, increasing CO emissions, CH4 burden and decreasing photolysis rates drive OH down, counter-20
balancing the competing influences of rising temperature, water vapor, NO and LNOx. In the late 20th century,τCH4 falls continuously as temperature and water vapor con-tinue to rise even more rapidly (Fig. 3a, 4b).
4.3 Trends in recent decades
Over the last 20 yr of HIST τCH4 declines steadily, coinciding with the period of most 25
ACPD
12, 18067–18105, 2012Climate versus emission drivers of
methane lifetime
J. G. John et al.
Title Page
Abstract Introduction
Conclusions References
Tables Figures
◭ ◮
◭ ◮
Back Close
Full Screen / Esc
Printer-friendly Version
Interactive Discussion
Discussion
P
a
per
|
Dis
cussion
P
a
per
|
Discussion
P
a
per
|
Discussio
n
P
a
per
|
water vapor shortenτCH4 (Bekki and Law, 1997; Johnson et al., 2002; Dentener et al., 2003; Fiore et al., 2006). Since the 1970s, we also note an increase in J(O1D) – pre-sumably driven by depletion of stratospheric ozone (Fig. 4c, d) as aerosol changes do not directly affect photolysis rates in these simulations – which also enhances OH formation and shortensτCH4. From 1998–2005,τCH4 continued to fall as stratospheric 5
O3and J(O1D) levelled off, indicating that these factors were not contributing to the OH changes during this period. By 2005,τCH4 in HIST falls to ANTHRO, perhaps in part due to the lack of major volcanic eruptions since Pinatubo.
From 1979–1993, we obtain a global annual mean CH4lifetime versus tropospheric
OH of 8.96±0.09 yr, in good agreement with the Dentener et al. (2003) value of
10
9.0±0.13 yr. The corresponding global airmass-weighted OH concentration below
500 hPa is (1.28±0.007)×106molec cm−3. The slight positive trend of 0.07 % yr−1
over the period is smaller than the value of 0.24±0.06 % yr−1 reported by Dentener
et al. (2003). The positive OH trend in recent decades in CM3 is in agreement with results from the current generation of modeling studies (Table 2), but is inconsistent
15
with the negative OH trend and low interannual variability inferred from observations of CH3CCl3(e.g. Bousquet et al., 2005; Montzka et al., 2011).
Similar to HIST, τCH4 in ANTHRO continues to fall over the last 20 yr, likely due to increasing water vapor (Fig. 4b). After 1980, increasing temperatures, water vapor and OH concentrations shorten CH4lifetime in ANTHRO, while cooling and decreasing OH 20
in AEROSOL have the opposite effect, causing the lifetime to increase. Stratospheric ozone rises slightly in AEROSOL after 1990, as opposed to the strong decrease in ANTHRO; by 2005τCH4in AEROSOL exceeds that in ANTHRO by 0.42 yr (Fig. 1). After 1985, increased J(O1D) in WMGGO3, correlated with the depletion of stratospheric ozone, along with rising temperatures and water vapor (Fig. 3a, 4b) cause τCH4 to 25
ACPD
12, 18067–18105, 2012Climate versus emission drivers of
methane lifetime
J. G. John et al.
Title Page
Abstract Introduction
Conclusions References
Tables Figures
◭ ◮
◭ ◮
Back Close
Full Screen / Esc
Printer-friendly Version
Interactive Discussion
Discussion
P
a
per
|
Dis
cussion
P
a
per
|
Discussion
P
a
per
|
Discussio
n
P
a
per
|
climate drivers (rapid warming and associated increase in water vapor) dominate in the late 20th century, and the methane lifetime decreases.
Our historical and single-forcing experiments over the 1860–2005 period illustrate the diverse factors influencing the evolution of the methane lifetime, with cooling from aerosol-cloud interactions masking the effects of greenhouse gas warming over the
5
historical period in CM3. Rising temperatures and increases in water vapor and LNOx driveτCH4down (Tables 4, 5) in WMGGO3. In contrast, the temperature-driven changes in reaction rate constant, water vapor and lightning NOx are of the opposite sign in
AEROSOL (Table 5) and τCH4 increases. Both climate and emissions influence the
simulated methane lifetime in HIST; while emission-driven changes dominate the
over-10
all increase inτCH4 from the pre-industrial to present, climate warming in the late 20th century shortens the lifetime of CH4. The aerosol indirect effect plays a major role in CM3 and its impacts on changes in methane lifetime need further investigation. The discrepancy between model and observationally based studies of CH4and OH trends in recent decades continues to be an unresolved puzzle. Since OH is expected to
in-15
crease in a warming climate, the disagreement may indicate a problem with inferred OH trends, or some offsetting influence in chemistry, climate or emissions not represented in the models.
5 Future scenarios (2006–2100)
We focus first on the three RCP scenarios (RCP2.6, RCP4.5 and RCP6.0) that have
20
equivalent decreases in anthropogenic NOx emissions (∼45 %) by the end of the cen-tury (Table 5). The trajectory ofτCH4 in RCP2.6 (Fig. 1) initially drops, reaching a min-imum value of 7.22 yr in 2063, after which it rebounds, for an overall 9.1 % decrease from 2006–2025 to 2081–2100. In this “low warming” scenario, the associated
tem-perature change below 500 hPa over the same time periods is ∼1.1 K, while lower
25
ACPD
12, 18067–18105, 2012Climate versus emission drivers of
methane lifetime
J. G. John et al.
Title Page
Abstract Introduction
Conclusions References
Tables Figures
◭ ◮
◭ ◮
Back Close
Full Screen / Esc
Printer-friendly Version
Interactive Discussion
Discussion
P
a
per
|
Dis
cussion
P
a
per
|
Discussion
P
a
per
|
Discussio
n
P
a
per
|
vapor, lightning NOx, and J(O 1
D), and is further enhanced by reductions in CH4burden and CO emissions (Table 5), which together outweigh the 46 % reduction in total NO emissions. Prior to 2063, OH rises rapidly, driven by almost linear declines in methane burden and CO emissions (Fig. 5a, b). After 2063,τCH4 increases as the evolution of OH reverses and starts decreasing, driven by declining anthropogenic NO emissions,
5
which offset the combined impacts on OH from warming and declining anthropogenic CO emissions.
Under the moderate warming scenario, RCP4.5, there is a linear decline in the life-time of methane, which drops by 13 % from 2006–2025 to 2081–2100, the largest overall decrease in methane lifetime in any of the RCP projections (Fig. 1). Although
10
the decrease in methane burden is only one-third that in RCP2.6 (Table 5), the larger increases in water vapor and lightning NOx (driven by warming which is twice as large in RCP4.5 as compared to RCP2.6) combined with a larger decrease in CO emissions lead to an overall larger OH change by the end of the century than in RCP2.6. The overall warming in RCP4.5 is closer to that in RCP6.0 but the OH change in RCP4.5 is
15
closer to that in RCP2.6, illustrating the complex interplay of climate and emissions in determining methane lifetimes.
We next explore the role of short-lived aerosol and ozone precursors in contributing to the climate-driven changes by comparing RCP4.5 with RCP4.5* (where the short-lived species are held at 2005 levels (Fig. 5), as are CH4, N2O and ODS for chemistry, 20
but well-mixed greenhouse gases follow the RCP4.5 scenario, Table 3). In RCP4.5*, we again find a shortening ofτCH4, but the percent change is not as large as in the RCP4.5 ensemble – here roughly equal percent changes in rate constant and OH contribute to a 5 % reduction in methane lifetime (Table 5). Increases in temperature, water vapor and lightning NOxenhance OH concentrations, and reduceτCH4in the model. We note 25
ACPD
12, 18067–18105, 2012Climate versus emission drivers of
methane lifetime
J. G. John et al.
Title Page
Abstract Introduction
Conclusions References
Tables Figures
◭ ◮
◭ ◮
Back Close
Full Screen / Esc
Printer-friendly Version
Interactive Discussion
Discussion
P
a
per
|
Dis
cussion
P
a
per
|
Discussion
P
a
per
|
Discussio
n
P
a
per
|
the temperatures in RCP4.5 separate from RCP4.5*, and by 2100 are warmer by 1.1 K, illustrating that decreasing aerosols can accelerate warming (e.g. Levy et al., 2008; Raes and Seinfeld, 2009; Makkonen et al., 2012). In addition, the decreases in CH4 and CO further reinforce the climate-driven decrease inτCH4 in RCP4.5 (Table 5).
In the RCP6.0 scenario, the tropospheric lifetime of methane also decreases, by
5
5.2 % from 2006–2025 to 2081–2100 (Table 5). Although the temperature, water va-por, and lightning NOx increases are about 2.5 times greater than in RCP2.6, and both RCP2.6 and RCP6.0 have similar (∼45 %) reductions in NO emissions, there is
a smaller decrease in CO emissions in RCP6.0 (18 % vs. 31 %), and the total CH4 bur-den increases in RCP6.0 (Table 5), leading to an overall reduction in OH, and a longer
10
averageτCH4 than in RCP2.6 (8.44 vs. 7.72 yr in Table 4). OH decreases from 2006 to the mid 2060s and then rises fairly rapidly until 2100 (Fig. 3b). The latter part of this simulation resembles the last quarter century of WMGGO3 in the CM3 model, in so far as rising temperatures and increased OH (from increasing water vapor, lightning NOx and photolysis), contribute to a steady decline inτCH4.
15
RCP8.5 is the most extreme warming scenario, with lower tropospheric temperatures warming by 4.5 K from 2006 to 2100 in CM3 (Fig. 3a, Table 5). Despite the increasing temperature (Fig. 3a), which our previous analysis indicates should shorten theτCH4, the tropospheric methane lifetime increases, from 8.24 yr in 2006–2025 to 8.73 yr in 2081–2100, with a peak value of 8.91 yr in 2062 (Fig. 1). This increase in lifetime is
20
due to a decrease in OH beginning after 2035, with an overall 14.8 % reduction by the end of the century (Fig. 3b, Table 5). The near doubling of CH4 abundance by 2100 (Table 5) depletes OH and leads to a positive feedback on the climate system, as concentrations of CH4 increase further (Prather, 1994). The rise in anthropogenic CH4 outweighs the climate-driven changes which act to shorten the methane lifetime 25
ACPD
12, 18067–18105, 2012Climate versus emission drivers of
methane lifetime
J. G. John et al.
Title Page
Abstract Introduction
Conclusions References
Tables Figures
◭ ◮
◭ ◮
Back Close
Full Screen / Esc
Printer-friendly Version
Interactive Discussion
Discussion
P
a
per
|
Dis
cussion
P
a
per
|
Discussion
P
a
per
|
Discussio
n
P
a
per
|
6 Conclusions
Improved understanding of feedbacks between CH4abundances and the climate
sys-tem are important as they impact not only climate, but also the environment and human health. The relatively short lifetime of methane makes it a suitable candidate for mit-igation efforts, as reducing CH4 emissions decreases radiative forcing and improves 5
air quality (e.g. Fiore et al., 2002; Shindell et al., 2012). Understanding the processes driving the trends and variability in methane lifetime is a crucial step to accurately pro-jecting its future evolution.
We used a suite of CM3 model simulations to evaluate the role of climate and emis-sions in determining methane lifetime and to pinpoint key drivers from the preindustrial
10
period to the end of the 21st century. Over the historical period, the methane lifetime increases by 5 % overall due to anthropogenic emission increases in CH4. There are also indications of climatically-driven intervals, e.g. after volcanic events when cool-ing by aerosols cause the methane lifetime to rise (e.g. HIST in Fig. 1, 3a), or when the effects of increasing temperatures and water vapor create a negative feedback on
15
climate, driving lifetimes down, which in turn decreases the amount of CH4in the atmo-sphere and reduces climate forcing (e.g. WMGGO3 after 1985). During the late 20th century,τCH4 decreases steadily as rapid warming occurs, and the observed leveling offin atmospheric CH4during that time could partially reflect climate-driven influences on the methane sink. Consistent with other model studies, we find a small positive
20
OH trend in recent decades (0.07 % yr−1 from 1979–1993), which notably conflict with observationally-constrained estimates (Montzka et al., 2011) and merit further study. In particular, process-based approaches, including new global scale satellite observa-tions (e.g. Bloom et al., 2010 for wetlands) should help to elucidate the mechanisms determining atmospheric abundances of methane and OH. Reducing the uncertainty
25
ACPD
12, 18067–18105, 2012Climate versus emission drivers of
methane lifetime
J. G. John et al.
Title Page
Abstract Introduction
Conclusions References
Tables Figures
◭ ◮
◭ ◮
Back Close
Full Screen / Esc
Printer-friendly Version
Interactive Discussion
Discussion
P
a
per
|
Dis
cussion
P
a
per
|
Discussion
P
a
per
|
Discussio
n
P
a
per
|
Relative to the simulated historical change (+5 %), the evolution of methane lifetime spans a fairly wide range over the next century, withτCH4 decreasing overall in RCP2.6, RCP4.5 and RCP6.0 (by 5 to 13 %), but increasing by 4.3 % in RCP8.5 with sharp increases in CH4outweighing the extreme warming in this scenario. In a simulation in which only greenhouse gases evolve following the RCP4.5 pathway (RCP4.5*), rising
5
temperatures and enhanced OH shortenτCH4. Decreases in aerosol, CO and CH4 in the full RCP4.5 scenario augment these climate-driven changes to further decrease
τCH4. We also find positive feedbacks on the climate system; in RCP8.5, the additional CH4and other emission changes increase the methane lifetime (despite the tendency of warmer climate to reduce τCH4), and amplify climate forcing. There was no tipping 10
point in this scenario, however, asτCH4 begins to decline by the end of the 21st century. Climate and therebyτCH4 is sensitive to the representation of the aerosol indirect effect in the CM3 model and represents a major source of uncertainty.
Ongoing efforts such as the Atmospheric Chemistry and Climate Model Intercom-parison Project (ACCMIP), provide opportunities to further explore and evaluate the
15
role of climate versus emission-driven changes in determining the trends and vari-ability in the lifetime of methane. Our results offer a benchmark for future analyses of methane lifetime in chemistry-climate models, such as those participating in the ongo-ing Atmospheric Chemistry and Climate Model Intercomparison Project. Emphasis is particularly needed on the roles of lightning NOx and photolysis on the methane sink,
20
as well as climate-sensitive methane sources, in order to account fully for all of the competing factors which determine the atmospheric methane lifetime.
Acknowledgements. We thank Hiram Levy and Songmiao Fan for insightful suggestions and comments on the manuscript, and Keith Dixon for suggestions on presentation of Tables 5 and 6 in black and white.
ACPD
12, 18067–18105, 2012Climate versus emission drivers of
methane lifetime
J. G. John et al.
Title Page
Abstract Introduction
Conclusions References
Tables Figures
◭ ◮
◭ ◮
Back Close
Full Screen / Esc
Printer-friendly Version
Interactive Discussion
Discussion
P
a
per
|
Dis
cussion
P
a
per
|
Discussion
P
a
per
|
Discussio
n
P
a
per
|
References
Allan, W., Lowe, D. C., Gomez, A. J., Struthers, H., and Brailsford, G. W.: Interannual variation
of13C in tropospheric methane: implications for a possible atomic chlorine sink in the marine
boundary layer, J. Geophys. Res., 110, D11306, doi:10.1029/2004JD005650, 2005.
Arneth, A., Harrison, S. P., Zaehle, S., Tsigaridis, K., Menon, S., Bartlein, P. J., Feichter, J., 5
Korhola, A., Kulmala, M., O’Donnell, D., Schurgers, G., Sorvari, S., and Vesala, T.: Terrestrial biogeochemical feedbacks in the climate system, Nat. Geosci., 3, 525–532, doi:10.1038/ngeo905, 2010.
Austin, J. and Wilson, R. J.: Ensemble simulations of the decline and recovery of stratospheric ozone, J. Geophys. Res., 111, D16314, doi:10.1029/2005JD006907, 2006.
10
Aydin, M., Verhulst, K. R., Saltzmann, E. S., Battle, M. O., Montzka, S. A., Blake, D. R., Tang, Q., and Prather, M. J.: Recent decreases in fossil-fuel emissions of ethane and methane derived from firn air, Nature, 476, 198–201, doi:10.1038/nature10352, 2011.
Bekki, S. and Law, K. S.: Sensitivity of the atmospheric CH4growth rate to global temperature
changes observed from 1980 to 1992, Tellus B, 49, 409–416, 1997. 15
Berntsen, T. K., Isaksen, I. S. A., Myhre, G., Fuglestvedt, J. S., Stordal, F., Larsen, T. A.,
Freck-leton, R. S., and Shine, K. P.: Effects of anthropogenic emissions on tropospheric ozone and
its radiative forcing, J. Geophys. Res., 102, 28101–28126, doi:10.1029/97JD02226, 1997. Bloom, A. A., Palmer, P. I., Fraser, A., Reay, D. S., and Frankenberg, C.: Large-scale controls
of methanogenesis inferred from methane and gravity spaceborne data, Science, 327, 322– 20
325, 2010.
Bousquet, P., Hauglustaine, D. A., Peylin, P., Carouge, C., and Ciais, P.: Two decades of OH variability as inferred by an inversion of atmospheric transport and chemistry of methyl chlo-roform, Atmos. Chem. Phys., 5, 2635–2656, doi:10.5194/acp-5-2635-2005, 2005.
Bousquet, P., Ciais, P., Miller, J. B., Dlugokencky, E. J., Hauglustaine, D. A., Prigent, C., Van der 25
Werf, G. R., Peylin, P., Brunke, E. G., Carouge, C., Langenfels, R. L., Lathiere, J., Papa, F., Ramonet, M., Schmidt, M., Steele, L. P., Tyler, S. C., and White, J.: Contribution of an-thropogenic and natural sources to atmospheric methane variability, Nature, 443, 439–443, 2006.
Brasseur, G. J., Kiehl, T., Muller, J. F., Schneider, T., Granier, C., Tie, X. X., and Hauglustaine, D.: 30
ACPD
12, 18067–18105, 2012Climate versus emission drivers of
methane lifetime
J. G. John et al.
Title Page
Abstract Introduction
Conclusions References
Tables Figures
◭ ◮
◭ ◮
Back Close
Full Screen / Esc
Printer-friendly Version
Interactive Discussion
Discussion
P
a
per
|
Dis
cussion
P
a
per
|
Discussion
P
a
per
|
Discussio
n
P
a
per
|
Crutzen, P. J. and Zimmermann, P. H.: The changing photochemistry of the troposphere, Tel-lus B, 43, 136–151, 1991.
Crutzen, P. J., Lawrence, M. G., and P ¨oschl, U.: On the background photochemistry of tropo-spheric ozone, Tellus, 51, 123–146, 1999.
Dalsøren, S. B. and Isaksen, I. S. A.: CTM study of changes in tropospheric hydroxyl 5
distribution 1990–2001 and its impact on methane, Geophys. Res. Lett., 33, L23811, doi:10.1029/2006GL027295, 2006.
Denman, K. L., Brasseur, G., Chidthaisong, A., Ciais, P., Cox, P. M., Dickenson, R. E., Hauglus-taine, D., Heinze, C., Holland, E., Jacob, D. J., Lohmann, U., Ramachandran, S., da Silva Dias, P. L., Wofsy, S. C., and Zhang, X.: Couplings between changes in the climate system 10
and biogeochemistry, in: Climate Change 2007: The Physical Science Basis. Contribution of Working Group I to the Fourth Assessment Report of the Intergovernmental Panel on Climate Change, edited by: Solomon, S., Qin, D., Manning, M., Chen, Z., Marquis, M., Averyt, K. B., Tignor, M., and Miller, H. L., Cambridge University Press, Cambridge, 2007.
Dentener, F., Peters, W., Krol, M., Van Weele, M., Bergamaschi, P., and Lelieveld, J.: Interannual 15
variability and trend of CH4 lifetime as a measure for OH changes in the 1979–1993 time
period, J. Geophys. Res., 108, 4442, doi:10.1029/2002JD002916, 2003.
Dlugokencky, E. J., Masarie, K. A., Lang, P. M., and Tans, P. P.: Continuing decline in the growth rate of the atmospheric methane burden, Nature, 393, 447–450, 1998.
Dlugokencky, E. J., Houweling, S., Bruhwiler, L., Masarie, K. A., Lang, P. M., Miller, J. B., and 20
Tans, P. P.: Atmospheric methane levels off: temporary pause or a new steady-state?,
Geo-phys. Res. Lett., 30, 1992, doi:10.1029/2003GL018126, 2003.
Donner, L. J., Wyman, B. L., Hemler, R. S., Horowitz, L. W., Ming, Y., Zhoa, M., Golaz, J.-C., Ginoux, P., Lin, S.-J., Schwarkopf, M. D., Austin, J., Alaka, G., Cooke, W. F., Delworth, T. L.,
Freidenreich, S. M., Gordon, C. T., Griffies, S. M., Held, I. M., Hurlin, W. J., Klein, S. A.,
Knut-25
son, T. R., Langenhorst, A. R., Lee, H.-C., Lin, Y., Magi, B. I., Malyshev, S. L., Milly, P. C. D., Naik, V., Nath, M. J., Pincus, R., Ploshay, J. J., Ramaswamy, V., Seman, C. J.,
Shevli-akova, E., Sirutis, J. J., Stern, W. F., Stouffer, R. J., Stouffer, R. J., Wilson, R. J., Winton, M.,
Wittenberg, A. T., and Zeng, F.: The dynamical core, physical parameterizations, and basic simulation characteristics of the atmospheric component AM3 of the GFDL Global Coupled 30
ACPD
12, 18067–18105, 2012Climate versus emission drivers of
methane lifetime
J. G. John et al.
Title Page
Abstract Introduction
Conclusions References
Tables Figures
◭ ◮
◭ ◮
Back Close
Full Screen / Esc
Printer-friendly Version
Interactive Discussion
Discussion
P
a
per
|
Dis
cussion
P
a
per
|
Discussion
P
a
per
|
Discussio
n
P
a
per
|
Fiore, A. M., Jacob, D. J., Field, B. D., Streets, D. G., Fernandes, S. D., and Jang, C.: Linking ozone pollution and climate change: the case for controlling methane, Geophys. Res. Lett., 29, 1919, doi:10.1029/2002GL015601, 2002.
Fiore, A. M., Horowitz, L. W., Dlugokencky, E. J., and West, J. J.: Impact of meteorol-ogy and emissions on methane trends, 1990–2004, Geophys. Res. Lett., 33, L12809, 5
doi:10.1029/2006GL026199, 2006.
Fiore, A. M., West, J. J., Horowitz, L. W., Naik, V., and Schwarzkopf, M. D.: Characterizing the tropospheric ozone response to methane emission controls and the benefits to climate and air quality, J. Geophys. Res., 113, D08307, doi:10.1029/2007JD009162, 2008.
Fl ¨uckiger, J., Monnin, E., Stauffer, B., Schwander, J. and Stocker, T. F.: High-resolution holocene
10
N2O ice core record and its relationship with CH4 and CO2, Global Biogeochem. Cy., 16,
1010, doi:10.1029/2001GB001417, 2002.
Forster, P., Ramaswamy, V., Artaxo, P., Berntsen, T., Betts, R., Fahey, D. W., Haywood, J., Lean, J., Lowe, D. C., Myhre, G., Nganga, J., Prinn, R., Raga, G., Schulz, M., and Van Dor-land, R.: Changes in atmospheric constituents and in radiative forcing, in: Climate Change 15
2007: The Physical Science Basis. Contribution of Working Group I to the Fourth Assess-ment Report of the IntergovernAssess-mental Panel on Climate Change, edited by: Solomon, S., Qin, D., Manning, M., Chen, Z., Marquis, M., Averyt, K. B., Tignor, M., and Miller, H. L., Cambridge University Press, Cambridge, UK and New York, NY, USA, 2007.
Grenfell, J. L., Shindell, D. T., Koch, D., and Rind, D.: Chemistry-climate interactions in the 20
Goddard Institute general circulation model. 2. New insights into modeling the pre-industrial atmosphere, J. Geophys. Res., 106, 33435–33451, 2001.
Griffies, S. M, Winton, M., Donner, L. J., Horowitz, L. W., Downes, S. M., Farneti, R.,
Gnanade-sikan, A., Hurlin, W. J., Lee, H.-C., Liang, Z., Palter, J. B., Samuels, B. L., Wittenberg, A. T., Wyman, B. L., Yin, J., and Zadeh, N.: The GFDL CM3 coupled climate model: characteristics 25
of the ocean and sea ice simulations, J. Climate, 24, 3520–3544, 2011.
Hamilton, K. and Fan, S.-M.: Effects of the stratospheric quasi-biennial oscillation on long-lived
greenhouse gases in the atmosphere, J. Geophys. Res., 105, 20581–20587, 2000.
Hauglustaine, D. A. and Brasseur, G. P.: Evolution of tropospheric ozone under anthropogenic activities and associated radiative forcing of climate, J. Geophys. Res., 106, 32337–32360, 30
ACPD
12, 18067–18105, 2012Climate versus emission drivers of
methane lifetime
J. G. John et al.
Title Page
Abstract Introduction
Conclusions References
Tables Figures
◭ ◮
◭ ◮
Back Close
Full Screen / Esc
Printer-friendly Version
Interactive Discussion
Discussion
P
a
per
|
Dis
cussion
P
a
per
|
Discussion
P
a
per
|
Discussio
n
P
a
per
|
Hodson, E. L., Poulter, B., Zimmermann, N. E., Prigent, C., and Kaplan, J. O.: The El Ni ˜no– Southern Oscillation and wetland methane interannual variability, Geophys. Res. Lett., 38, L08810, doi:10.1029/2011GL046861, 2011.
Horowitz, L. W.: Past, present, and future concentrations of tropospheric ozone and aerosols: methodology, ozone evaluation and sensitivity to aerosol wet removal, J. Geophys. Res., 5
111, D22211, doi:10.1029/2005JD006937, 2006.
Horowitz, L. W., Walters, S., Mauzerall, D. L., Emmons, L. K., Rasch, P. J., Granier, C., Tie, X., Lamarque, J.-F., Schultz, M. G., Tyndall, G. S., Orlando, J. J., and Brasseur, G. P.: A global simulation of tropospheric ozone and related tracers: description and evaluation of MOZART, version 2, J. Geophys. Res., 108, 4784, doi:10.1029/2002JD002853, 2003.
10
Johnson, C. E., Stevenson, D. S., Collins, W. J., and Derwent, R. G.: Interannual variability in methane growth rate simulated with a coupled ocean-atmosphere chemistry model, Geo-phys. Res. Lett., 29, 1903, doi:10.1029/2002GL015269, 2002.
Kai, F. M., Tyler, S. C., Randerson, J. T., and Blake, D. R.: Reduced methane growth rate explained by decreased Northern Hemisphere microbial sources, Nature, 476, 194–197, 15
2011.
Karlsd ´ottir, S. and Isaksen, I. S. A.: Changing methane lifetime: possible cause for reduced growth, Geophys. Res. Lett., 27, 93–96, 2000.
Krol, M., van Leeuwen, P. J., and Lelieveld, J.: Global OH trend inferred from methyl-chloroform measurements, J. Geophys. Res., 103, 10697–10711, 1998.
20
Lamarque, J.-F., Hess, P., Emmons, L., Buja, L., Washington, W., and Granier, C.: Tro-pospheric ozone evolution between 1890 and 1990, J. Geophys. Res., 110, D08304, doi:10.1029/2004JD005537, 2005.
Lamarque, J.-F., Bond, T. C., Eyring, V., Granier, C., Heil, A., Klimont, Z., Lee, D., Liousse, C., Mieville, A., Owen, B., Schultz, M. G., Shindell, D., Smith, S. J., Stehfest, E., Van Aar-25
denne, J., Cooper, O. R., Kainuma, M., Mahowald, N., McConnell, J. R., Naik, V., Riahi, K., and van Vuuren, D. P.: Historical (1850–2000) gridded anthropogenic and biomass burn-ing emissions of reactive gases and aerosols: methodology and application, Atmos. Chem. Phys., 10, 7017–7039, doi:10.5194/acp-10-7017-2010, 2010.
Law, K. S. and Nisbet, E. G.: Sensitivity of the methane growth rate to changes in methane 30
emissions from natural gas and coal, J. Geophys. Res., 101, 14387–14397, 1996.
ACPD
12, 18067–18105, 2012Climate versus emission drivers of
methane lifetime
J. G. John et al.
Title Page
Abstract Introduction
Conclusions References
Tables Figures
◭ ◮
◭ ◮
Back Close
Full Screen / Esc
Printer-friendly Version
Interactive Discussion
Discussion
P
a
per
|
Dis
cussion
P
a
per
|
Discussion
P
a
per
|
Discussio
n
P
a
per
|
Lelieveld, J., Crutzen, P. J., and Dentener, F. J.: Changing concentration, lifetime and climate forcing of atmospheric methane, Tellus B, 50, 128–150, 1998.
Lelieveld, J., Peters, W., Dentener, F. J., and Krol, M. C.: Stability of tropospheric hydroxyl chemistry, J. Geophys. Res., 107, 4715, doi:10.1029/2002JD002272, 2002.
Levy, H.: Normal atmosphere: large radical and formaldehyde concentrations predicted, Sci-5
ence, 173, 141–143, 1971.
Levy, H., Moxim, W. J., and Kasibhatla, P. S.: A global three-dimensional time-dependent
light-ning source of tropospheric NOx, J. Geophys. Res., 101, 22911–22922, 1996.
Levy, H., Schwarzkopf, M. D., Horowitz, L., Ramaswamy, V., and Findell, K. L.: Strong sensitivity of late 21st century climate to projected changes in short-lived air pollutants, J. Geophys. 10
Res., 113, D06102, doi:10.1029/2007JD009176, 2008.
Logan, J. A., Prather, M. J., Wofsy, S. C., and McElroy, M. B.: Tropospheric chemistry: a global perspective, J. Geophys. Res., 86, 7210–7254, 1981.
Makkonen, R., Asmi, A., Kerminen, V.-M., Boy, M., Arneth, A., Hari, P., and Kulmala, M.: Air pol-lution control and decreasing new particle formation lead to strong climate warming, Atmos. 15
Chem. Phys., 12, 1515–1524, doi:10.5194/acp-12-1515-2012, 2012.
Martinerie, P., Brasseur, G. P., and Granier, C.: The chemical composition of ancient atmo-spheres: a model study constrained by ice core data, J. Geophys. Res., 100, 14291–14304, 1995.
Masui, T., Matsumoto, K., Hijioka, Y., Kinoshita, T., Nozawa, T., Ishiwatari, S., Kato, E., 20
Shukla, P. R., Yamagata, Y., and Kainuma, M.: An emission pathway for stabilization at
6 W m−2 radiative forcing, Climatic Change, 109, 59–76, doi:10.1007/s10584-011-0150-5,
2011.
Meinshausen, M., Smith, S. J., Calvin, K., Daniel, J. S., Kainuma M. L. T., Lamarque, J.-F., Matsumoto, K., Montzka, S. A., Raper, S. C. B., Riahi, K., Thomson, A., Velders, G. J. M., 25
and van Vuuren, D. P. P.: The RCP greenhouse gas concentrations and their extensions from 1765 to 2300, Climatic Change, 109, 213–241, doi:10.1007/s10584-011-0156-z, 2011. Mickley, L. J., Murti, P. P., Jacob, D. J., Logan, J. A., Koch, D. M., and Rind, D.: Radiative forcing
from tropospheric ozone calculated with a unified chemistry climate model, J. Geophys. Res., 104, 30153–30172, 1999.
30
ACPD
12, 18067–18105, 2012Climate versus emission drivers of
methane lifetime
J. G. John et al.
Title Page
Abstract Introduction
Conclusions References
Tables Figures
◭ ◮
◭ ◮
Back Close
Full Screen / Esc
Printer-friendly Version
Interactive Discussion
Discussion
P
a
per
|
Dis
cussion
P
a
per
|
Discussion
P
a
per
|
Discussio
n
P
a
per
|
Moss, R. H., Edmonds, J. A., Hibbard, K. A., Manning, M. R., Rose, S. K., van Vuuren, D. P., Carter, T. R., Emori, S., Kainuma, M., Kram, T., Meehl, G. A., Mitchell, J. F. B.,
Naki-cenovic, N., Riahi, K., Smith, S. J., Stouffer, R. J., Thomson, A. M., Weyant, J. P., and
Wilbanks, T. J.: The next generation of scenarios for climate change research and assess-ment, Nature, 463, 747–756, doi:10.1038/nature08823, 2010.
5
Naik, V., Horowitz, L. W., Fiore, A. M., Ginoux, P., Mao, J., Aghedo, A., and Levy, H.: Prein-dustrial to present day impact of changes in short-lived pollutant emissions on atmospheric composition and climate forcing, J. Geophys. Res., submitted, 2012.
Osborn T. J. and Wigley, T. M. L.: A simple model for estimating methane concentration and lifetime variations, Clim. Dynam., 9, 181–193, 1994.
10
Prather, M. J.: Lifetimes and eigenstates in atmospheric chemistry, Geophys. Res. Lett., 21, 801–804, 1994.
Prather, M. J. and Spivakovsky, C. M.: Tropospheric OH and the lifetimes of hydrochlorofluoro-carbons, J. Geophys. Res., 95, 18723–18729, 1990.
Prather, M., Gauss, M., Berntsen, T., Isaksen, I., Sundet, J., Bey, I., Brasseur, G., Dentener, F., 15
Derwent, R., Stevenson, D., Grenfell, L., Hauglustaine, D., Horowitz, L., Jacob, D., Mickley, L., Lawrence, M. G., von Kuhlmann, R., Muller, J.-F., Pitari, G., Rogers, H., Johnson, M., Pyle, J., Law, K., van Weele, M., and Wild, O.: Fresh air in the 21st century?, Geophys., Res. Lett., 30, 1100, doi:10.1029/2002GL016285, 2003.
Price, C., Penner, J., and Prather M.: NOx from lightning. 1. Global distribution based on
light-20
ning physics, J. Geophys. Res., 102, 5929–5941, 1997.
Prinn, R. G., Weiss, R. F., Miller, B. R., Huang, J., Alyea F. N., Cunnold, D. M., Fraser, P. J.,
Hartley, D. E., and Simmonds, P. G: Atmospheric trends and lifetime of CH3CCl3and global
OH concentrations, Science, 269, 187–192, 1995.
Prinn, R. G., Huang, J., Weiss, R. F., Cunnold, D. M., Fraser, P. J., Simmonds, P. G., McCul-25
loch, A., Harth, C., Salameh, P., O’Doherty, S., Wang, R. H. J., Porter, L., and Miller, B. R.: Ev-idence for substantial variations of atmospheric hydroxyl radicals over the past two decades, Science, 292, 1882–1888, 2001.
Prinn, R. G., Huang, J., Weiss, R. F., Cunnold, D. M., Fraser, P. J., Simmonds, P. G., McCul-loch, A., Harth, C., Reimann, S., Salameh, P., O’Doherty, S., Wang, R. H. J., Porter, L. W., 30
ACPD
12, 18067–18105, 2012Climate versus emission drivers of
methane lifetime
J. G. John et al.
Title Page
Abstract Introduction
Conclusions References
Tables Figures
◭ ◮
◭ ◮
Back Close
Full Screen / Esc
Printer-friendly Version
Interactive Discussion
Discussion
P
a
per
|
Dis
cussion
P
a
per
|
Discussion
P
a
per
|
Discussio
n
P
a
per
|
Raes, F. and Seinfeld, J. H.: New directions: climate change and air pollution abatement: a bumpy road, Atmos. Environ., 43, 5132–5133, doi:10.1016/j.atmosenv.2009.06.001, 2009. Riahi, K., Rao, S., Krey, V., Cho, C., Chirkov, V., Fischer, G., Kindermann G., Nakicenovic, N.,
and Rafaj, P.: RCP 8.5 – a scenario of comparatively high greenhouse gas emissions, Cli-matic Change, 109, 33–57, doi 10.1007/s10584-011-0149-y, 2011.
5
Rigby, M., Prinn, R. G., Fraser, P. J., Simmonds, P. G., Langenfelds, R. L., Huang, J., Cun-nold, D. M., Steele, L. P., Krummel, P. B., Weiss, R. F., O’Doherty, S., Salameh, P. K., Wang, H. J., Harth, C. M., M ¨uhle, J., and Porter, L. W.: Renewed growth of atmospheric methane, Geophys. Res. Lett., 35, L22805, doi:10.1029/2008GL036037, 2008.
Roelofs, G. J., Lelieveld, J., and van Dorland, R.: A three-dimensional chemistry-general circu-10
lation model simulation of anthropogenically derived ozone in the troposphere and its radia-tive climate forcing, J. Geophys. Res., 102, 23389–23401, 1997.
Sander, S. P., Friedl, R. R., Golden, D. M., Kurylo, M. J., Huie, R. E., Orkin, V. L., Moortgat, G. K., Wine, P. H., Ravishankara, A. R., Kolb, C. E., Molina, M. J., Finlayson-Pitts, B. J., Huie, R. E., and Orkin, V. L.: Chemical Kinetics and Photochemical Data for Use in Atmospheric Studies, 15
Evaluation Number 15, JPL Publications 06-2, Jet Propulsion Laboratory, Pasadena, CA, USA, 2006.
Shevliakova, E., Pacala S. W., Malyshev S., Hurtt G. C., Milly P. C. D., Caspersen J. P., Sent-man L. T., Fisk J. P., Wirth C., and Crevoisier C.: Carbon cycling under 300 yr of land use change: importance of the secondary vegetation sink, Global Biogeochem. Cy., 23, GB2022, 20
doi:10.1029/2007GB003176, 2009.
Shindell, D. T., Grenfell, J. L., Rind, D., Grewe, V., and Price, C.: Chemistry-climate interac-tions in the Goddard Institute for Space Studies general circulation model 1. Tropospheric chemistry model description and evaluation, J. Geophys. Res., 106, 8047–8075, 2001. Shindell, D. T., Faluvegi, G., Bell, N., and Schmidt, G. A.: An emissions-based view of 25
climate forcing by methane and tropospheric ozone, Geophys. Res. Lett., 32, L04803, doi:10.1029/2004GL021900, 2005.
Shindell, D. T., Faluvegi, G., Unger, N., Aguilar, E., Schmidt, G. A., Koch, D. M., Bauer, S. E., and Miller, R. L.: Simulations of preindustrial, present-day, and 2100 conditions in the NASA GISS composition and climate model G-PUCCINI, Atmos. Chem. Phys., 6, 4427–4459, 30
doi:10.5194/acp-6-4427-2006, 2006.