BGD
12, 1721–1751, 2015Scaling impacts on environmental controls and spatial heterogeneity of SOC
stocks
U. Mishra and W. J. Riley
Title Page
Abstract Introduction
Conclusions References
Tables Figures
◭ ◮
◭ ◮
Back Close
Full Screen / Esc
Printer-friendly Version
Interactive Discussion
Discussion
P
a
per
|
Discussion
P
a
per
|
Discussion
P
a
per
|
Discussion
P
a
per
|
Biogeosciences Discuss., 12, 1721–1751, 2015 www.biogeosciences-discuss.net/12/1721/2015/ doi:10.5194/bgd-12-1721-2015
© Author(s) 2015. CC Attribution 3.0 License.
This discussion paper is/has been under review for the journal Biogeosciences (BG). Please refer to the corresponding final paper in BG if available.
Scaling impacts on environmental
controls and spatial heterogeneity of soil
organic carbon stocks
U. Mishra1and W. J. Riley2 1
Environmental Science Division, Argonne National Laboratory, 9700 South Cass Avenue, 240-6143, Argonne, IL 60439, USA
2
Earth Sciences Division, Lawrence Berkeley National Laboratory, One Cyclotron Road, 50-4037, Berkeley, CA 94720, USA
Received: 24 November 2014 – Accepted: 13 January 2015 – Published: 27 January 2015
Correspondence to: U. Mishra ([email protected])
BGD
12, 1721–1751, 2015Scaling impacts on environmental controls and spatial heterogeneity of SOC
stocks
U. Mishra and W. J. Riley
Title Page
Abstract Introduction
Conclusions References
Tables Figures
◭ ◮
◭ ◮
Back Close
Full Screen / Esc
Printer-friendly Version
Interactive Discussion
Discussion
P
a
per
|
Discussion
P
a
per
|
Discussion
P
a
per
|
Discussion
P
a
per
|
Abstract
The spatial heterogeneity of land surfaces affects energy, moisture, and greenhouse gas exchanges with the atmosphere. However, representing heterogeneity of terrestrial hydrological and biogeochemical processes in earth system models (ESMs) remains a critical scientific challenge. We report the impact of spatial scaling on environmental
5
controls, spatial structure, and statistical properties of soil organic carbon (SOC) stocks across the US state of Alaska. We used soil profile observations and environmental fac-tors such as topography, climate, land cover types, and surficial geology to predict the SOC stocks at a 50 m spatial scale. These spatially heterogeneous estimates provide a dataset with reasonable fidelity to the observations at a sufficiently high resolution
10
to examine the environmental controls on the spatial structure of SOC stocks. We up-scaled both the predicted SOC stocks and environmental variables from finer to coarser spatial scales (s=100, 200, 500 m, 1, 2, 5, 10 km) and generated various statistical properties of SOC stock estimates. We found different environmental factors to be sta-tistically significant predictors at different spatial scales. Only elevation, temperature,
15
potential evapotranspiration, and scrub land cover types were significant predictors at all scales. The strengths of control (the median value of geographically weighted re-gression coefficients) of these four environmental variables on SOC stocks decreased with increasing scale and were accurately represented using mathematical functions (R2=0.83–0.97). The spatial structure of SOC stocks across Alaska changed with
20
spatial scale. Although the variance (sill) and unstructured variability (nugget) of the calculated variograms of SOC stocks decreased exponentially with scale, the corre-lation length (range) remained relatively constant across scale. The variance of pre-dicted SOC stocks decreased with spatial scale over the range of 50 to∼500 m, and remained constant beyond this scale. The fitted exponential function accounted for
25
BGD
12, 1721–1751, 2015Scaling impacts on environmental controls and spatial heterogeneity of SOC
stocks
U. Mishra and W. J. Riley
Title Page
Abstract Introduction
Conclusions References
Tables Figures
◭ ◮
◭ ◮
Back Close
Full Screen / Esc
Printer-friendly Version
Interactive Discussion
Discussion
P
a
per
|
Discussion
P
a
per
|
Discussion
P
a
per
|
Discussion
P
a
per
|
are therefore unable to represent environmental controllers and spatial heterogeneity of high-latitude SOC stocks consistent with observations. We conclude that improved understanding of the scaling behavior of environmental controls and statistical prop-erties of SOC stocks can improve ESM land model benchmarking and perhaps allow representation of spatial heterogeneity of biogeochemistry at scales finer than those
5
currently resolved by ESMs.
1 Introduction
Soil organic carbon (SOC) stocks have large spatial heterogeneity globally (Todd-Brown et al., 2013) and in the northern circumpolar permafrost region (Ping, 2013; Hugelius et al., 2014). Achieving an accurate representation of the spatial
heterogene-10
ity of existing SOC stocks in earth system models (ESMs) is a prerequisite for predicting future carbon-climate feedbacks (Todd-Brown et al., 2013), given that uncertainty re-sulting from the distribution of SOC stocks accounts for a large proportion of the overall uncertainty (Burke et al., 2012) in predictions of future greenhouse gas concentra-tions and associated climate changes. Reliable estimates of regional SOC stocks and
15
their spatial heterogeneity are also essential to gaining a better understanding of ex-isting environmental controls of SOC stocks and their vulnerability to changing climate (Johnson et al., 2011).
At present, large differences exist between observation-based and ESM-based SOC stock estimates at high latitudes (Mishra et al., 2013). Several factors likely account for
20
these differences (Koven et al., 2013; Todd-Brown et al., 2013); the relevant factors for the current analyses are that the natural spatial variability of some environmental con-trols observed to affect SOC stocks are not represented in the models. One potential approach to account for spatial heterogeneity in ESMs is to incorporate the impacts of environmental controls on SOC stocks at a spatial scale consistent with the
observa-25
BGD
12, 1721–1751, 2015Scaling impacts on environmental controls and spatial heterogeneity of SOC
stocks
U. Mishra and W. J. Riley
Title Page
Abstract Introduction
Conclusions References
Tables Figures
◭ ◮
◭ ◮
Back Close
Full Screen / Esc
Printer-friendly Version
Interactive Discussion
Discussion
P
a
per
|
Discussion
P
a
per
|
Discussion
P
a
per
|
Discussion
P
a
per
|
Among environmental variables, climate, topography, organisms, parent material, and spatial position (Jenny, 1941; McBratney et al., 2003) have widely been used to predict the spatial variability of soil properties from plot to regional scales (Thompson and Kolka; 2005; Vasques et al., 2012; Minasny et al., 2013; Mishra and Riley, 2014). At high latitudes where solar radiation and evaporation are strongly related to the
geome-5
try of the land surface (McKenzie et al., 2000), topography has been reported to play an important role in determining the level of SOC at a specific location (Jenny 1980; Birke-land, 1984; Hobbie et al., 2000). Hill slope processes, such as erosion and deposition, are related to terrain attributes, such as the soil wetness index (SWI) and sediment transport index (STI). Both the SWI and STI are strong predictors of SOC stocks and
10
have been used extensively in digital mapping of SOC stocks at various scales (e.g., Zhu et al., 2001; Thompson et al., 2006; Adhikari et al., 2013).
Despite several global and regional studies on SOC inventories, quantitative data on the relationship between SOC stocks and the environmental controlling factors do not exist at multiple scales (Lal, 2004; Chaplot et al., 2010). In spatial prediction of SOC
15
concentration and stocks, different primary and secondary topographic attributes are calculated from a digital elevation model (DEM) and used, along with other soil-forming factors such as climate, land cover type, and parent material, to predict SOC stocks across different scales (Hancock et al., 2010; Vasques et al., 2010; Kumar et al., 2012). Usually fine-scale environmental data are preferred over coarser spatial scales as they
20
are more representative of natural landscapes. However, it has also been reported that the highest scale DEMs do not always produce highest accuracy in predicting soil properties and that knowledge of the appropriate DEM scale for a particular landscape is important (Smith et al., 2006; Roecker and Thompson, 2010). Calculated values of topographic indices of a study area differed depending on the spatial scale of the DEM
25
BGD
12, 1721–1751, 2015Scaling impacts on environmental controls and spatial heterogeneity of SOC
stocks
U. Mishra and W. J. Riley
Title Page
Abstract Introduction
Conclusions References
Tables Figures
◭ ◮
◭ ◮
Back Close
Full Screen / Esc
Printer-friendly Version
Interactive Discussion
Discussion
P
a
per
|
Discussion
P
a
per
|
Discussion
P
a
per
|
Discussion
P
a
per
|
Information collected at one scale can be used to infer properties at either smaller or larger scales (Beven, 1995), such as when using point observations to estimate regional SOC stocks, or taking areal averages of SOC stocks from ESMs and disag-gregating them. The essence of successful scaling is to infer the key patterns from in-formation collected at one scale and use those patterns to make inferences at another
5
scale that maintain consistency in the desired metrics across the scales (Western et al., 2002). We believe that the statistical spatial structure of SOC stocks may be useful in (1) downscaling and inferring fine-scale variability from coarse-scale ESM predictions, (2) model benchmarking, and (3) developing reduced order model formulations relating biogeochemical processes across scales.
10
A large literature exists on spatial scaling of soil moisture, which is a dominant control on SOC dynamics and stocks. Several studies have modeled the spatial variability of soil moisture patterns from relatively smaller to larger scales, and have attempted to characterize the spatial structure based on system properties (Rodriguez-Iturbe et al., 1995; Peters-Lidard et al., 2001; Western et al., 2002; Riley and Shen, 2014; Pau
15
et al., 2014). For some systems, soil moisture spatial variance follows a power law decay as a function of spatial area (Manfreda et al., 2007), although in other systems there are clear scale breaks in this relationship (e.g., Das and Mohanty, 2008; Joshi and Mohanty, 2010; Pau et al., 2014). Gebremichael et al. (2009) reported that, in a watershed located in the Southern Great Plains of the USA, soil moisture showed
20
scale-invariance, and if the scaling parameters could be estimated from large-scale soil moisture fields, it might be feasible to transform spatial soil moisture fields between scales. Despite the progress made in modeling the scaling behavior of soil moisture, to our knowledge no study exists that has examined the statistical structure of the scaling behavior of SOC stocks.
25
BGD
12, 1721–1751, 2015Scaling impacts on environmental controls and spatial heterogeneity of SOC
stocks
U. Mishra and W. J. Riley
Title Page
Abstract Introduction
Conclusions References
Tables Figures
◭ ◮
◭ ◮
Back Close
Full Screen / Esc
Printer-friendly Version
Interactive Discussion
Discussion
P
a
per
|
Discussion
P
a
per
|
Discussion
P
a
per
|
Discussion
P
a
per
|
The main structural parameters of a variogram are the nugget, sill, and range (Western and Bloschl, 1999; Webster and Oliver, 2007). A nugget shows the unexplained portion of the variance and the sill is the level at which a variogram flattens and therefore repre-sents the total variance of the variable. The nugget-to-sill ratio can be used to quantify the percentage of overall variance found at a distance smaller than the smallest lag
5
interval, and to classify the spatial dependence of soil properties (Cambardella et al., 1994; Mora-Vallejo et al., 2008).
Current ESMs operate at spatial scales larger than 50 km and use a nested subgrid hierarchy approach to represent the land surface heterogeneity (Lawrence et al., 2012). ESM spatial scales are becoming increasingly finer to more accurately represent the
lo-10
calized features of earth systems that affect energy, water, and greenhouse gas fluxes. For example, next generation ESMs such as those being developed by the US Depart-ment of Energy (Accelerated Climate Modeling for Energy; ACME) will have a spatial scale for the land model of∼10 km (Bader et al., 2014). In this study, we successively increased the spatial scale (from s=50 m to 10 km) of environmental variables and
15
used observations and geospatial approaches to predict SOC stocks. Throughout this paper, we refer to the “scale” (s) as either the distance across which properties are assumed to be homogeneous or the square root of the pixel area satisfying that crite-ria, and note that the terms “scale” and “resolution” are often interchangeable in this context. The idea was to model the change in predicted heterogeneity of SOC stocks
20
resulting from changing scale of the environmental data. In this study, by the term “scal-ing” we mean the transfer of information about environmental controls and statistical properties of SOC stocks from one scale to another. We also investigated how environ-mental controls on SOC stocks and the spatial structure of SOC stocks (the correlation length (range), total variance (sill), and unstructured variability (nugget)) changed as
25
BGD
12, 1721–1751, 2015Scaling impacts on environmental controls and spatial heterogeneity of SOC
stocks
U. Mishra and W. J. Riley
Title Page
Abstract Introduction
Conclusions References
Tables Figures
◭ ◮
◭ ◮
Back Close
Full Screen / Esc
Printer-friendly Version
Interactive Discussion
Discussion
P
a
per
|
Discussion
P
a
per
|
Discussion
P
a
per
|
Discussion
P
a
per
|
2 Study approach
2.1 Soil organic carbon observations and environmental variables
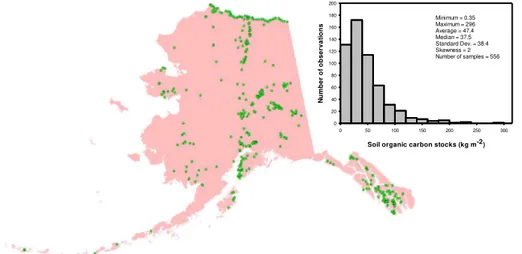
We used 556 georeferenced soil profile observations by combining data from two re-cently published studies of soil organic carbon stocks across Alaska (472 soil pro-files from Mishra and Riley, 2012 and 84 additional samples from a recently published
5
database of Michaelson et al., 2013). This database combined the US Department of Agriculture’s National Resource Conservation Service’s pedons with the soil pe-don observations collected from the University of Alaska Fairbanks under its northern soils research program. This database included measured representative soil profiles from Alaska and covered all soil types at the soil suborder level (18 suborders) and
10
all 27 major land resource areas of Alaska. The observed SOC stocks showed a wide range (0.35–296 kg m−2) due to varying sampling depths (0.05–4.5 m depth), various soil types with differing carbon content levels (Inceptisols to Gelisols), and the large environmental heterogeneity present in the study area. A large number of observa-tions had SOC stocks ≤50 kg m−2, and about 49 samples had SOC stocks greater
15
than 100 kg m−2. A majority of pedons with high SOC stocks were located in the Arctic region of Alaska, which are areas with soils impacted by cryoturbation, and the majority of pedons with lower SOC stocks were located in interboreal and coastal rainforests. The SOC stock data has a unimodal (kurtosis,K =9.4) positively skewed distribution (coefficient of skewness,S=2), and is unevenly distributed throughout Alaska (Fig. 1).
20
The fine-scale (spatial scales=50 m) spatially heterogeneous SOC stock estimates have uncertainty, as described by the prediction errors in Mishra and Riley (2012). How-ever, that study indicated that the SOC stock estimates have reasonable fidelity with the observations withheld from the estimation procedure, and therefore we believe are sufficiently accurate to be used in the scaling analyses described here. As more data
25
BGD
12, 1721–1751, 2015Scaling impacts on environmental controls and spatial heterogeneity of SOC
stocks
U. Mishra and W. J. Riley
Title Page
Abstract Introduction
Conclusions References
Tables Figures
◭ ◮
◭ ◮
Back Close
Full Screen / Esc
Printer-friendly Version
Interactive Discussion
Discussion
P
a
per
|
Discussion
P
a
per
|
Discussion
P
a
per
|
Discussion
P
a
per
|
We collected environmental variables of the study area from various sources. The topographic attributes were derived from a digital elevation model (DEM) with a 50 m spatial scale (s=50 m) obtained from the US Geological Survey (USGS) database (Gesch et al., 2009). From the DEM, 13 topographic attributes were calculated that have been reported to be useful predictors of the SOC stocks across different
environ-5
mental conditions using the Spatial Analyst function of ArcGIS (ArcGIS version 10.2, Environmental Systems Research Institute, Inc., Redlands, CA, USA).
Climate data for long-term (1961–1990) average annual temperature, precipitation, potential evapotranspiration (PET), and summer shortwave radiation were obtained from the Scenario Network for Alaska and Arctic Planning (SNAP, 2014) database,
10
with a spatial scale ofs=2 km.
Land cover data of 60 m spatial scale (s=60 m) was extracted for Alaska from the National Land Cover Database (NLCD) database (Homer et al., 2007). In this study, to reduce the number of categorical variables with potentially redundant information, we reclassified the 19 NLCD land cover types found in Alaska into 9 major categories.
15
Thus, developed open space, low intensity, medium intensity, and high intensity were classified as a developed category; deciduous, evergreen, and mixed forests were clas-sified as a forest category; dwarf scrub and shrub scrub were clasclas-sified as a scrub category; shrub, sedge, and moss were classified as a herbaceous category; pasture and cultivated lands were classified as a cultivated category; and woody and
herba-20
ceous wetlands were classified as a wetland category. In the reclassified map, the category with the largest land area was the scrub category (43 %), followed by forest (25 %), barren (8.5 %), herbaceous (7 %), and wetlands (7 %). The remaining surface area (9.5 %) was under open water, perennial ice, barren land, and moss vegetation. Indicator variables for the presence or absence of 7 land cover types (except open
25
BGD
12, 1721–1751, 2015Scaling impacts on environmental controls and spatial heterogeneity of SOC
stocks
U. Mishra and W. J. Riley
Title Page
Abstract Introduction
Conclusions References
Tables Figures
◭ ◮
◭ ◮
Back Close
Full Screen / Esc
Printer-friendly Version
Interactive Discussion
Discussion
P
a
per
|
Discussion
P
a
per
|
Discussion
P
a
per
|
Discussion
P
a
per
|
(22.5 %), followed by coarse rubble (19 %), coastal alluvium (8.5 %), glacial moraine (7 %), and undifferentiated mosaics (6 %). The remaining land area (37 %) was placed in the remaining 22 surficial geology types.
2.2 Spatial scaling and environmental controls
We investigated changes in environmental controls on SOC stocks at spatial scales of
5
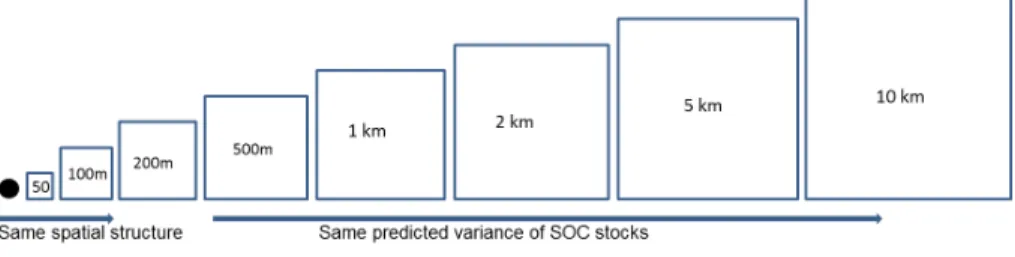
100, 200, 500 m, 1, 2, 5, and 10 km. For this purpose, the DEM of a 50 m spatial scale was successively aggregated at 100, 200, 500 m, 1, 2, 5, and 10 km using the bilinear convolution algorithm of ArcGIS 10.2 (Fig. 2). Topographic attributes were calculated at each spatial scale and included in predicting SOC stocks at specific scales. The land cover types and surficial geology data were aggregated at similar scales using
10
the nearest-neighbors algorithm of ArcGIS 10.2 and were included in predicting SOC stocks at various spatial scales.
Median values of the geographically weighted regression coefficients (β) of log-transformed (natural log) SOC stock and environmental variables (that were signifi-cant at all spatial scales) were calculated for each spatial scale. Log transformations
15
of SOC stocks were applied to meet the linear regression assumptions of normality and constant variance of errors. The change in the strength of environmental controls (β’s) on SOC stocks resulting from a change in spatial scale was investigated by plot-ting the median values against the spatial scale at which they were calculated. Several mathematical functions were used to represent the statistical nature of scaling of the
20
environmental controls on SOC stocks.
2.3 Selection of environmental predictors, prediction of SOC stocks, and vari-ogram modeling
We used best subset regression in SAS 9.3 (SAS Institute, 2011) to generate all possi-ble combinations of environmental variapossi-bles to predict the SOC stocks across Alaska.
25
spa-BGD
12, 1721–1751, 2015Scaling impacts on environmental controls and spatial heterogeneity of SOC
stocks
U. Mishra and W. J. Riley
Title Page
Abstract Introduction
Conclusions References
Tables Figures
◭ ◮
◭ ◮
Back Close
Full Screen / Esc
Printer-friendly Version
Interactive Discussion
Discussion
P
a
per
|
Discussion
P
a
per
|
Discussion
P
a
per
|
Discussion
P
a
per
|
tial scale for which Cp values were close to the number of predictors (Kutner et al., 2004, p. 358), from which we subsequently selected one linear model for each spa-tial scale with uncorrelated and statistically significant environmental predictors. The selected environmental predictors were then used in a geographically weighted re-gression approach (Mishra et al., 2012, 2014) to predict the whole profile SOC stocks
5
across Alaska at different spatial scales using:
C(ui,vi)=βo(ui,vi)+
p X
i=1
βk(ui,vi)Xk+ε(ui,vi)
whereCis the SOC stock at a certain location,ui,vi are the geographical coordinates,
Xk are the environmental predictors,pis the number of independent variables,βoand
βk are the geographically weighted regression coefficients, andεis the error term. We
10
used adaptive kernel bandwidth in this study, given that the sample density varied over the study area. The optimal bandwidth was determined by minimizing the corrected Akaike Information Criterion (AICc) as described in Fortheringham et al. (2002).
We calculated several statistical parameters, including mean (µ), variance (σ2), skewness (S), and kurtosis (K) from the predicted SOC stocks at specific spatial
15
scale (s=50 m–10 km). The predicted variances were plotted against spatial scale and a best-fit mathematical function was determined. Relationships between theµand other statistical parameters were investigated by plotting theµSOC stocks calculated at each spatial scale across Alaska vs. its other statistical parameters calculated at the same scale.
20
To study the change in spatial structure of SOC stocks due to spatial scaling, we cal-culated the variograms of predicted SOC stocks (Webster and Oliver, 2007) at different spatial scales:
γ(h)= 1 2n
n X
i=1
BGD
12, 1721–1751, 2015Scaling impacts on environmental controls and spatial heterogeneity of SOC
stocks
U. Mishra and W. J. Riley
Title Page
Abstract Introduction
Conclusions References
Tables Figures
◭ ◮
◭ ◮
Back Close
Full Screen / Esc
Printer-friendly Version
Interactive Discussion
Discussion
P
a
per
|
Discussion
P
a
per
|
Discussion
P
a
per
|
Discussion
P
a
per
|
whereZ(Xi) andZ(Xih) are the measured SOC stocks atXi and Xi+h, respectively;
his the lag;nis the number of paired comparisons at that lag; and γ(h) is the semi-variance. By varying h in discrete steps, we obtain an ordered set of semivariances (Webster and Oliver, 1992). Suitable mathematical functions were fitted to the calcu-lated semivariance values using weighted least squares (Webster and Oliver, 2007).
5
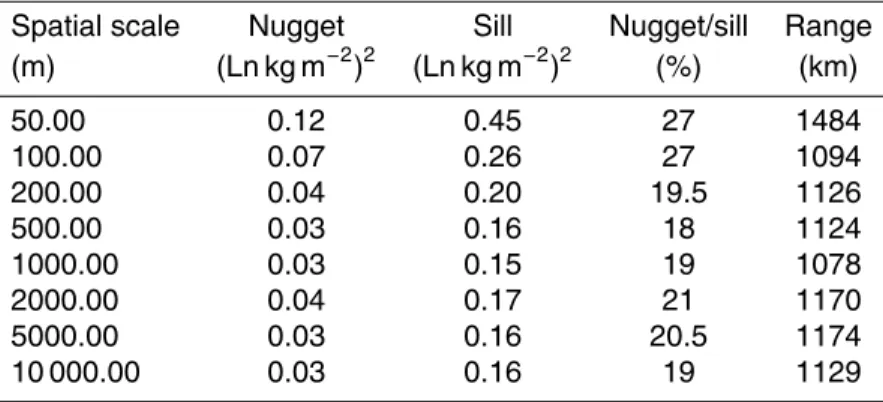
The best-fit model parameters for each spatial scale are provided in Table 2. We exam-ined the change in correlation length (range), total variance of SOC stocks (sill), and the unstructured variability (nugget) resulting from the change in the spatial scales of environmental variables. A variable is considered to have a strong spatial dependence if the nugget-to-sill ratio is less than 0.25; a moderate spatial dependence if the ratio is
10
between 0.25 and 0.75; and otherwise a weak spatial dependence (Cambardella et al., 1994; Mora-Vallejo et al., 2008). Range, which is also referred as correlation length, is the distance at which the sill is reached and represents the maximum extent of the spa-tial correlation between predicted SOC stocks. The change in the spaspa-tial structure of variability of SOC stocks was evaluated using the nugget-to-sill ratio and the correlation
15
length.
3 Results
3.1 Inferred environmental controls on SOC stocks change with scale
The set of significant environmental predictors and their individual strengths varied with spatial scale. Statistically significant environmental predictors at different spatial
20
scales and the predicted variance of SOC stocks are summarized in Table 1. From the 13 topographic attributes, 5 attributes – elevation (meters), slope (degree), aspect (degree from north), soil wetness index (SWI), and sediment transport index (STI) – were significant predictors of SOC stocks at various spatial scales. Among land cover types, barren, scrub, herbaceous, and cultivated land covers were significant
predic-25
evapotran-BGD
12, 1721–1751, 2015Scaling impacts on environmental controls and spatial heterogeneity of SOC
stocks
U. Mishra and W. J. Riley
Title Page
Abstract Introduction
Conclusions References
Tables Figures
◭ ◮
◭ ◮
Back Close
Full Screen / Esc
Printer-friendly Version
Interactive Discussion
Discussion
P
a
per
|
Discussion
P
a
per
|
Discussion
P
a
per
|
Discussion
P
a
per
|
spiration were significant predictors. Among surficial geology types, the glacial moraine, fluvial, undifferentiated mosaic, coastal delta, and volcanic mountain types were sig-nificant predictors at various spatial scales. Among all of the environmental variables investigated in this study, only elevation, temperature, potential evapotranspiration, and scrub land cover types were significant predictors of SOC stocks at all spatial scales.
5
In general, at finer spatial scales, controls of topographic attributes were more promi-nent, whereas land cover and surficial geology types were more significant predictors at coarser scales (≥ 500 m spatial scale). Fewer environmental variables controlled the variability of SOC stocks at finer spatial scales, whereas the number of predictors increased at larger spatial scales.
10
Our results showed that the strength of the control (median geographically weighted regression coefficient across Alaska) of elevation on SOC stocks decreased by 31 % as the spatial scale increased from 50 m to 1 km. Beyond this scale, we found no change in the control of elevation on predicted SOC stocks (Fig. 3a). The control of temperature on SOC stocks decreased with spatial scale between 50 and 500 m and
15
became constant at larger scales (Fig. 3b). The controls of elevation and temperature on SOC stocks across spatial scales can be accurately modeled by using exponential functions withR2=0.83 and 0.94, respectively. The control of potential evapotranspi-ration decreased by 36 % as the spatial scale increased from 50 to 500 m, and became constant beyond 500 m (Fig. 3c). The control of potential evapotranspiration on SOC
20
stocks across spatial scales can be modeled by using an exponential decay function (R2=0.97). The control of scrub vegetation (shrubs less than 5 meters tall) on SOC stocks decreased linearly with scale over the range 50 m to 10 km (Fig. 3d). The control of scrub vegetation can be modeled using a linear function (R2=0.85).
3.2 Scaling impacts on the spatial structure of SOC stocks
25
BGD
12, 1721–1751, 2015Scaling impacts on environmental controls and spatial heterogeneity of SOC
stocks
U. Mishra and W. J. Riley
Title Page
Abstract Introduction
Conclusions References
Tables Figures
◭ ◮
◭ ◮
Back Close
Full Screen / Esc
Printer-friendly Version
Interactive Discussion
Discussion
P
a
per
|
Discussion
P
a
per
|
Discussion
P
a
per
|
Discussion
P
a
per
|
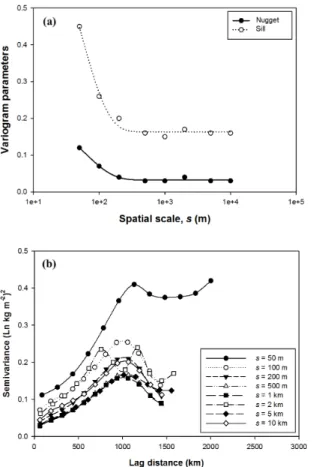
(Table 2) due to measurement errors and/or microscale spatial heterogeneity not cap-tured across the study area. Both the nugget and sill decreased as the scale increased from finer to coarser spatial scales. The nugget and sill decreased by 75 and 64 % re-spectively assincreased from 50 to 500 m and remained constant beyond 500 m scale (Fig. 4a). The relationship between these variogram parameters and scale can be
ac-5
curately described using exponential functions withR2 of 0.98. The correlation length of SOC stocks remained relatively constant up to about 1100–1400 km across spa-tial scales (Fig. 4b). The nugget-to-sill ratio of predicted SOC stocks at 50 and 100 m spatial scales showed moderate spatial dependency (i.e. a nugget-to-sill ratio>25 %; Cambardella et al., 1994). However, strong, and relatively similar, spatial dependency
10
(a nugget-to-sill ratio≤25 %) was predicted for spatial scales betweens=200 m and
s=10 km (18–21 %; Table 2). These results suggest that the predicted SOC stocks show different spatial structure belows=100 m as compared tos≥200 m.
3.3 Statistical behavior of spatial scaling of SOC stocks
We found different statistical properties in predicted SOC stocks as the spatial scale of
15
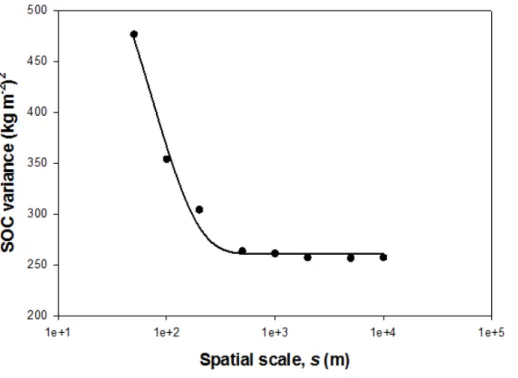
environmental variables increased. The variance of predicted SOC stocks decreased by 45 % as the scale increased from 50 to 500 m and remained constant beyond 500 m (Fig. 5). An exponential function based on spatial scale accounted for 98 % of variability in the variance of predicted SOC stocks across Alaska. These results suggest that the spatial heterogeneity of SOC stocks decreases exponentially with scale until about
20
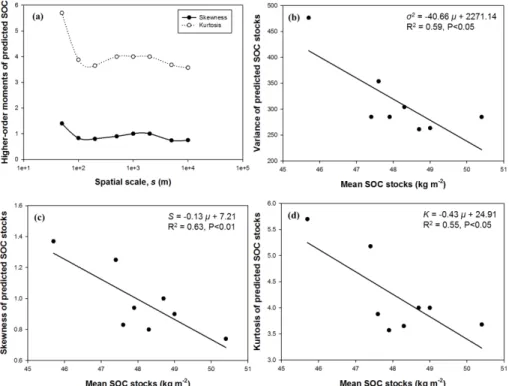
500 m. Beyond this scale, no change in the spatial heterogeneity of SOC stocks was predicted. The higher-order moments (skewness S and kurtosis K) of the predicted SOC stocks decreased as the spatial scale increased (Fig. 6a).S decreased from 1.4 to 0.8 as the scale increased from 50 to 200 m; and fluctuated in between 1.25 and 0.74 as the scale increased further.K decreased from 5.7 to 3.6 as the scale increased from
25
BGD
12, 1721–1751, 2015Scaling impacts on environmental controls and spatial heterogeneity of SOC
stocks
U. Mishra and W. J. Riley
Title Page
Abstract Introduction
Conclusions References
Tables Figures
◭ ◮
◭ ◮
Back Close
Full Screen / Esc
Printer-friendly Version
Interactive Discussion
Discussion
P
a
per
|
Discussion
P
a
per
|
Discussion
P
a
per
|
Discussion
P
a
per
|
SOC stocks of 45.7 to 50.4 kg m−2, we found moderately-accurate linear relationships betweenµandσ2,S, andK of predicted SOC stocks, withR2values of 0.59, 0.63, and 0.55 respectively (Fig. 6b–d). Significant negative slopes of these relationships indicate as theµincreases the higher-order moments of SOC stock decrease, and theµvalue of SOC stocks can be used to predict its spatial heterogeneity.
5
4 Discussions
Soil organic carbon lies at the interface between the atmosphere and pedosphere and can be altered at time scales relevant to climate change by anthropogenic and climatic factors. As a result, the spatial heterogeneity of SOC stocks may affect the magnitude of greenhouse gas fluxes from the land surface and the terrestrial carbon cycle.
10
Several studies have demonstrated the impact of DEM scale on calculated topo-graphic attributes (Thompson et al., 2001; McMaster, 2002; Smith et al., 2006; Roecker and Thompson, 2010). However, very little attention has been paid to the impact of scal-ing on environmental controls and the predicted spatial heterogeneity of soil proper-ties. We found that apparent significant environmental controllers of high-latitude SOC
15
stocks changed with scale. Our findings are consistent with the results of Vasques et al. (2012), who showed inconsistent controls of various tropical-system environmen-tal factors in predicting SOC stocks as the scale of environmenenvironmen-tal variables increased from 30 to 1920 m. Due to a lack of other scaling studies examining the change in en-vironmental controllers of SOC stocks, we compared our results with findings from two
20
studies that reported environmental controllers of SOC stocks at two different scales. Johnson et al. (2011) reported that at the plot scale (∼1 m2), surface air temperature, topographic attributes, and soil texture were primary controllers of SOC stocks across Alaska. Similarly, Martin et al. (2011) predicted SOC stocks at 12 km scale over France, and reported land use and clay content to be important drivers of SOC stock spatial
25
BGD
12, 1721–1751, 2015Scaling impacts on environmental controls and spatial heterogeneity of SOC
stocks
U. Mishra and W. J. Riley
Title Page
Abstract Introduction
Conclusions References
Tables Figures
◭ ◮
◭ ◮
Back Close
Full Screen / Esc
Printer-friendly Version
Interactive Discussion
Discussion
P
a
per
|
Discussion
P
a
per
|
Discussion
P
a
per
|
Discussion
P
a
per
|
attributes on SOC stocks. Our results showed that the strength of controls of environ-mental factors that were significant decreased as spatial scale increased. The largest decrease was found in the control of scrub land cover type, and the smallest decrease was found in the control of temperature. The rates of these changes can be modeled using simple mathematical functions.
5
The scaling properties of soil moisture have been widely studied (Western and Boschl, 1999; Isham et al., 2005; Famiglietti et al., 2008; Li and Rodell, 2013). Some studies reported that the variance of soil moisture follows a power law relationship with surface area (Rodriguez-Iturbe et al., 1995; Manfreda et al., 2007), while oth-ers have shown non-simple scaling (Joshi and Mohanty, 2010; Riley and Shen, 2014;
10
Pau et al., 2014). Beven (1995) pointed out that it is unlikely that any general scaling theory can be developed because of the dependence of hydrological systems on ge-ological perturbations, and advocated for a disaggregation approach to develop scale-dependent models to represent hydrological heterogeneity. These studies suggested that further work focusing on the factors influencing soil moisture (topography,
vegeta-15
tion, soil properties, and rainfall) is expected to increase our knowledge of the mecha-nisms intrinsic to the scaling properties of soil moisture.
Keeping these inferences in mind and that soil moisture is an important control on SOC dynamics, in this study we used the soil-forming factors that have been docu-mented to affect SOC stocks to study the spatial scaling behavior of SOC stocks.
How-20
ever, in contrast to soil moisture, our results show that the variance of SOC stocks fol-lows an exponential decay with spatial scale up to about 500 m, and then remains con-stant thereafter. We interpreted environmental controllers on SOC stocks in an equilib-rium sense; i.e., over hundreds to thousands of years these controllers are expected to be related to observed SOC stocks. However, transient responses are not expected to
25
follow the same scaling properties, given likely changes in thermokarst formation and other hydrological and geomorphological changes at high latitudes.
BGD
12, 1721–1751, 2015Scaling impacts on environmental controls and spatial heterogeneity of SOC
stocks
U. Mishra and W. J. Riley
Title Page
Abstract Introduction
Conclusions References
Tables Figures
◭ ◮
◭ ◮
Back Close
Full Screen / Esc
Printer-friendly Version
Interactive Discussion
Discussion
P
a
per
|
Discussion
P
a
per
|
Discussion
P
a
per
|
Discussion
P
a
per
|
the Introduction, SOC stocks of Alaska and other arctic regions are also impacted by cryopedogenic features (pingos, frost boils, hummocks) and thermal surface erosion resulting from the freezing and thawing of the polygonal land surface (Tarnocai and Bockheim, 2011; Ping et al., 2008; Ping, 2013). In this study, the spatial organiza-tion of predicted SOC stocks increased with spatial scale as indicated by moderately
5
lower nugget-to-sill ratios for spatial scales>200 m. However, the correlation length remained relatively constant in the upscaled SOC stocks across Alaska.
One potential approach to represent the spatial heterogeneity of soil properties in ESMs is to relate their statistical properties to the mean state. As an analogy, sev-eral soil moisture studies investigated the relationships between soil moisture mean
10
and higher-order statistics, such as σ2, S, and K (Famiglietti et al., 1999; Ryu and Flamiglietti, 2005; Famiglietti et al., 2008; Li and Rodell, 2013). The results from these studies suggest that the mean of soil moisture is often related to its σ2, S, and K, although with different functional forms depending on various system properties. Our results indicate a moderate but statistically significant linear relationship between the
15
mean and higher-order moments of SOC stocks (i.e.,σ2,S, and K decrease linearly with the mean SOC stock within the range of mean SOC stocks investigated in this study (45.5–50.4 kg m−2)). The strength of the linear relationship was highest between
µ and S (R2=0.63, P <0.01), and lowest between µ and K (R2=0.55, P <0.05). However, available observations are insufficient to determine whether the same
rela-20
tionship holds with dynamically changing mean SOC stocks, highlighting an area of further investigation.
Current land models integrated in ESMs, such as CLM4.5 (Lawrence et al., 2012; Koven et al., 2013; Tang et al., 2013), uses a nested subgrid hierarchy approach to represent the land surface heterogeneity. In this approach the grid cells (∼1◦×1◦) are
25
char-BGD
12, 1721–1751, 2015Scaling impacts on environmental controls and spatial heterogeneity of SOC
stocks
U. Mishra and W. J. Riley
Title Page
Abstract Introduction
Conclusions References
Tables Figures
◭ ◮
◭ ◮
Back Close
Full Screen / Esc
Printer-friendly Version
Interactive Discussion
Discussion
P
a
per
|
Discussion
P
a
per
|
Discussion
P
a
per
|
Discussion
P
a
per
|
acterize the environmental controls and scaling properties of SOC stocks; rectifying this problem would require substantial restructuring of the model’s subgrid hierarchy. One potential application of the relationships we developed in this study could be to apply them with coarse-resolution ESM results in order to generate fine-scale spatial heterogeneity parameters of SOC stocks that are more representative of the natural
5
landscape. Currently the land models of most ESMs have a spatial scale of≥50 km. Therefore our results will be directly relevant to next generation ESMs which will oper-ate at high resolution (∼10 km) (Bader et al., 2014).
5 Summary and conclusions
Understanding the spatial scaling structure of SOC stocks and their relationships with
10
environmental factors is important for prediction of carbon-climate feedbacks under a changing climate. Here, we estimated the spatial scaling properties of environmen-tal factors and statistical properties of SOC stocks. We conclude that environmenenvironmen-tal controllers of SOC stocks change with scale, and the strength of environmental con-trols can be accurately modeled using simple mathematical functions. The variance of
15
predicted SOC stocks decreases exponentially with scale up to about 500 m, and then remains constant thereafter. Our results showed that the mean predicted SOC content is linearly related with its variance, skewness, and kurtosis. If the objective of a study is to represent the spatial heterogeneity of SOC stocks resulting from environmental factors, the prediction spatial scale should be finer than∼500 m. Similarly, the choice
20
of environmental predictors should be based on the intended final spatial scale of pre-dicted SOC stocks. Therefore, the current subgrid structure of many ESM-scale land models does not allow for characterization of the environmental controls and scaling properties affecting SOC stocks. The findings of this study may help to develop scale-appropriate techniques for ESM-scale land models and ultimately reduce the existing
25
BGD
12, 1721–1751, 2015Scaling impacts on environmental controls and spatial heterogeneity of SOC
stocks
U. Mishra and W. J. Riley
Title Page
Abstract Introduction
Conclusions References
Tables Figures
◭ ◮
◭ ◮
Back Close
Full Screen / Esc
Printer-friendly Version
Interactive Discussion
Discussion
P
a
per
|
Discussion
P
a
per
|
Discussion
P
a
per
|
Discussion
P
a
per
|
Acknowledgements. This research was supported by the Director, Office of Science, Office
of Biological and Environmental Research of the US Department of Energy under Argonne National Laboratory contract No. DE-AC02-06CH11357 and under Lawrence Berkeley National Laboratory contract No. DE-AC02-05CH11231 as part of the Regional and Global Climate Modeling (RGCM) Program. Thanks to G. Michaelson and C. L. Ping for providing access to
5
some of the SOC profile data.
References
Adhikari, K., Bou Kheir, R., Greve, M. B., Bøcher, P. K., Malone, B. P., Minasny, B., McBrat-ney, A. B., and Greve, M. H.: High-resolution 3-D mapping of soil texture in Denmark, Soil Sci. Soc. Am. J., 77, 860–876, 2013.
10
Bader, D., Collins, W., Jacob, R., Jones, P., Rasch, P., Taylor, M., Thornton, P., and Williams, D.: Accelerated Climate Modeling for Energy (ACME) Project Strategy and Initial Implementa-tion Plan, available at: http://climatemodeling.science.energy.gov (last access: 20 December 2014), 2014.
Beven, K.: Linking parameters across scales: subgrid parameterizations and scale-dependent
15
hydrological models, Hydrol. Process., 9, 507–525, 1995.
Birkeland, P. W.: Soils and Geomorphology, Oxford University Press, New York, 1984.
Burke, E. J., Hartley, I. P., and Jones, C. D.: Uncertainties in the global temperature change caused by carbon release from permafrost thawing, The Cryosphere, 6, 1063–1076, doi:10.5194/tc-6-1063-2012, 2012.
20
Cambardella, C. A., Moorman, T. B., Novak, J. M., Parkin, T. B., Karlen, D. L., Turco, R. F., and Konopka, A. E.: Field-scale variability of soil properties in Central Iowa soils, Soil Sci. Soc. Am. J., 58, 1501–1511, 1994.
Chaplot, V., Bounthong, B., and Valentin, C.: Soil organic carbon stocks in Laos: spatial varia-tions and controlling factors, Glob. Change Biol., 16, 1380–1393, 2010.
25
Das, N. N. and Mohanty, B. P.: Temporal dynamics of PSR-based soil moisture across spatial scales in an agricultural landscape during SMEX02: a wavelet approach, Remote Sens. Environ., 112, 522–534, 2008.
Famiglietti, J. S., Devereaux, J. A., Laymon, C. A., Tsegaye, T., Houser, P. R., Jackson, T. J., Graham, S. T., Rodell, M., and van Oevelen, P. J.: Ground-based investigation of soil moisture
BGD
12, 1721–1751, 2015Scaling impacts on environmental controls and spatial heterogeneity of SOC
stocks
U. Mishra and W. J. Riley
Title Page
Abstract Introduction
Conclusions References
Tables Figures
◭ ◮
◭ ◮
Back Close
Full Screen / Esc
Printer-friendly Version
Interactive Discussion
Discussion
P
a
per
|
Discussion
P
a
per
|
Discussion
P
a
per
|
Discussion
P
a
per
|
variability within remote sensing footprints during the Southern Great Plains 1997 (SGP97) Hydrology Experiment, Water Resour. Res., 35, 1839–1851, 1999.
Famiglietti, J. S., Ryu, D. R., Berg, A. A., Rodell, M., and Jackson, T. J.: Field ob-servations of soil moisture variability across scales, Water Resour. Res., 44, W01423, doi:10.1029/2006wr005804, 2008.
5
Fotheringham, A. S., Brunsdon, C., and Charlton, M. E.: Geographically Weighted Regression: The Analysis of Spatially Varying Relationships, John Wiley and Sons, West Sussex, End-land, 2002.
Gebremichael, M., Rigon, R., Bertoldi, G., and Over, T. M.: On the scaling characteristics of observed and simulated spatial soil moisture fields, Nonlinear Proc. Geoph., 16, 141–150,
10
2009.
Gesch, D., Evans, G., Mauck, J., Hutchinson, J., and Carswell Jr., W. J.: The National Map – Elevation, US Geological Survey Fact Sheet 2009–3053, p. 4, available at: http://ned.usgs. gov/, last access: 20 March 2014, 2009.
Hancock, G. R., Murphy, D., and Evans, K. G.: Hillslope and catchment scale soil organic
15
carbon concentration: an assessment of the role of geomorphology and soil erosion in an undisturbed environment, Geoderma, 155, 36–45, 2010.
Hobbie, S. E., Schimel, J. P. Trumbore, S. E., and Randerson, J. R.: Controls over carbon storage and turnover in high-latitude soils, Glob. Change Biol., 6, 196–210, 2000.
Homer, C., Dewitz, J., Fry, J., Coan, M., Hossain, N., Larson, C., Herold, N., McKerrow, A.,
20
VanDriel, J. N., and Wickham, J.: Completion of the 2001 National Land Cover Database for the conterminous United States, Photogramm. Eng. Remote Sens., 73, 337–341, 2007. Hugelius, G., Strauss, J., Zubrzycki, S., Harden, J. W., Schuur, E. A. G., Ping, C.-L.,
Schirrmeis-ter, L., Grosse, G., Michaelson, G. J., Koven, C. D., O’Donnell, J. A., Elberling, B., Mishra, U., Camill, P., Yu, Z., Palmtag, J., and Kuhry, P.: Estimated stocks of circumpolar permafrost
car-25
bon with quantified uncertainty ranges and identified data gaps, Biogeosciences, 11, 6573– 6593, doi:10.5194/bg-11-6573-2014, 2014.
Isham, V., Cox, D. R., Rodriguez-Iturbe, I., Porporato, A., and Manfreda. S.: Representation of space–time variability of soil moisture, P. Roy. Soc. Lond. A Mat., 461, 4035–4055, 2005. Jenny, H.: Factors of Soil Formation: A System Of Quantitative Pedology, McGraw Hill, New
30
York, 1941.
BGD
12, 1721–1751, 2015Scaling impacts on environmental controls and spatial heterogeneity of SOC
stocks
U. Mishra and W. J. Riley
Title Page
Abstract Introduction
Conclusions References
Tables Figures
◭ ◮
◭ ◮
Back Close
Full Screen / Esc
Printer-friendly Version
Interactive Discussion
Discussion
P
a
per
|
Discussion
P
a
per
|
Discussion
P
a
per
|
Discussion
P
a
per
|
Johnson, K. D., Harden, J. W., McGuire, A. D., Bliss, N. B., Bockheim, J. G., Clark, M., Nettleton-Hollingsworth, T., Jorgenson, M. T., Kane, E. S., Mack, M., O’Donnell, J., Ping, C. L., Schuur, E. A. G., Turetsky, M. R., and Valentine, D. W.: Soil carbon distribution in Alaska in relation to soil-forming factors, Geoderma, 167–168, 71–84, 2011.
Joshi, C. and Mohanty, B. P.: Physical controls of near-surface soil moisture across varying
5
spatial scales in an agricultural landscape during SMEX02, Water Resour. Res., 46, W12503, doi:10.1029/2010WR009152, 2010.
Karlstrom, T. N. V.: Surficial geology of Alaska, USGS Misc. Geol. Invest. Map I-357, 2 sheets, scale 1 : 1 584 000, US Geological Survey, Washington, D. C., 1964.
Kienzle, S.: The effect of DEM raster resolution on first order, second order, and compound
10
terrain derivatives, Trans. GIS, 8, 83–111, 2004.
Koven, C. D., Riley, W. J., Subin, Z. M., Tang, J. Y., Torn, M. S., Collins, W. D., Bonan, G. B.,
Lawrence, D. M., and Swenson, S. C.: The effect of vertically resolved soil biogeochemistry
and alternate soil C and N models on C dynamics of CLM4, Biogeosciences, 10, 7109–7131, doi:10.5194/bg-10-7109-2013, 2013.
15
Kutner, M. H., Nachtsheim, C. J., and Neter, J.: Applied Linear Regression Models, McGraw-Hill, New York, 2004.
Kumar, S., Lal, R., and Liu, D.: A geographically weighted regression kriging approach for map-ping soil organic carbon stock, Geoderma, 189–190, 627–634, 2012.
Lal, R.: Soil carbon sequestration to mitigate climate change, Geoderma, 123, 1–22, 2004.
20
Lawrence, P. J., Feddema, J. J., Bonan, G. B., Meehl, G. A., O’Neill, B. C., Oleson, K. W., Levis, S., Lawrence, D. M., Kluzek, E., Lindsay, K., and Thornton, P. E.: Simulating the bio-geochemical and biogeophysical impacts of transient land cover change and wood harvest in the Community Climate System Model (CCSM4) from 1850 to 2100, J. Climate, 25, 3071– 3095, 2012.
25
Li, B. and Rodell, M.: Spatial variability and its scale dependency of observed and
mod-eled soil moisture over different climate regions, Hydrol. Earth Syst. Sci., 17, 1177–1188,
doi:10.5194/hess-17-1177-2013, 2013.
Manfreda, S., McCabe, M. F., Fiorentino, M., Rodriguez-Iturbe, I., and Wood, E. F.: Scaling char-acteristics of spatial patterns of soil moisture from distributed modeling, Adv. Water Resour.,
30
BGD
12, 1721–1751, 2015Scaling impacts on environmental controls and spatial heterogeneity of SOC
stocks
U. Mishra and W. J. Riley
Title Page
Abstract Introduction
Conclusions References
Tables Figures
◭ ◮
◭ ◮
Back Close
Full Screen / Esc
Printer-friendly Version
Interactive Discussion
Discussion
P
a
per
|
Discussion
P
a
per
|
Discussion
P
a
per
|
Discussion
P
a
per
|
Martin, M. P., Wattenbach, M., Smith, P., Meersmans, J., Jolivet, C., Boulonne, L., and Ar-rouays, D.: Spatial distribution of soil organic carbon stocks in France, Biogeosciences, 8, 1053–1065, doi:10.5194/bg-8-1053-2011, 2011.
McBratney, A. B., Mendonça-Santos, M. L., and Minasny, B.: On digital soil mapping, Geo-derma, 117, 3–52, 2003.
5
McKenzie, N. J., Gessler, P. E., Ryan, P. J., and O’Connell, D. A.: The role of terrain analysis in soil mapping, in: Terrain Analysis: Principles and Applications, edited by: Wilson, J. P. and Gallant, J. C., John Wiley and Sons, New York, 245–265, 2000.
McMaster, K. J.: Effects of digital elevation model resolution on derived stream network
posi-tions, Water Resour. Res., 38, 1–9, 2002.
10
Michaelson, G. J., Ping, C. L., and Clark, M.: Soil pedon carbon and nitrogen data for Alaska: an analysis and update, Open J. Soil Sci., 3, 132–142, doi:10.4236/ojss.2013.32015, 2013. Minasny, B., McBratney, A. B., Malone, B. P., and Wheeler, I.: Digital mapping of soil carbon,
Adv. Agron., 118, 1–47, 2013.
Mishra, U. and Riley, W. J.: Alaskan soil carbon stocks: spatial variability and dependence on
15
environmental factors, Biogeosciences, 9, 3637–3645, doi:10.5194/bg-9-3637-2012, 2012. Mishra, U. and Riley, W. J.: Active-layer thickness across Alaska: comparing observation-based
estimates with CMIP5 earth system model predictions, Soil Sci. Soc. Am. J., 78, 894–902, 2014.
Mishra, U., Jastrow, J. D., Matamala, R., Hugelius, G., Koven, C. D., Harden, J. W., Ping, C. L.,
20
Michaelson, G. J., Fan, Z., Miller, R. M., McGuire, A. D., Tarnocai, C., Kuhry, P., Riley, W. J., Schaefer, K., Schuur, E. A. G., Jorgenson, M. T., and Hinzman, L. D.: Empirical estimates to reduce modeling uncertainties of soil organic carbon in permafrost regions: a review of recent progress and remaining challenges, Environ. Res. Lett., 8, 035020, doi:10.1088/1748-9326/8/3/035020, 2013.
25
Mora-Vallejo, A., Classens, L., Stoorvogel, J., and Heuvelink, G. B. M.: Small scale digital soil mapping in southeastern Kenya, Catena, 76, 44–53, 2008.
Peters-Lidard, C. D., Pan, F., and Wood, E. F.: A re-examination of modeled and measured soil moisture spatial variability and its implications for land surface modeling, Adv. Water Resour., 24, 1069–1083, 2001.
30
BGD
12, 1721–1751, 2015Scaling impacts on environmental controls and spatial heterogeneity of SOC
stocks
U. Mishra and W. J. Riley
Title Page
Abstract Introduction
Conclusions References
Tables Figures
◭ ◮
◭ ◮
Back Close
Full Screen / Esc
Printer-friendly Version
Interactive Discussion
Discussion
P
a
per
|
Discussion
P
a
per
|
Discussion
P
a
per
|
Discussion
P
a
per
|
Ping, C. L.: Gelisols: Part I. Cryogenesis and state factors of formation, Soil Horiz., 54, 1–5, 2013.
Ping, C. L., Michaelson, G. J., Kimble, J. M., Romanovsky, V. E., Shur, Y. L., Swanson, D. K., and Walker, D. A.: Cryogenesis and soil formation along a bioclimate gradient in Arctic North America, J. Geophys. Res., 113, G03S12, doi:10.1029/2008JG000744, 2008.
5
Riley, W. J. and Shen, C.: Characterizing coarse-resolution watershed soil moisture heterogeneity using fine-scale simulations, Hydrol. Earth Syst. Sci., 18, 2463–2483, doi:10.5194/hess-18-2463-2014, 2014.
Roecker, S. M. and Thompson, J. A.: Scale effects on terrain attribute calculation and their use
as environmental covariates for digital soil mapping, in: Digital Soil Mapping, Progress in
10
Soil Science, edited by: Boettinger, J. L., Howell, D. W., Moore, A. C., Hartemink, A. E., and Kienast-Brown, S., Springer, Berlin, 55–66, 2010.
Rodriguez-Iturbe, I., Vogel, G. K., Rigon, R., Entekhabi, D. Castelli, F., and Rinaldo, A.: On the spatial organization of soil moisture fields, Geophys. Res. Lett., 22, 2757–2760, 1995. Ryu, D. and Famiglietti, J. S.: Characterization of footprintscale surface soil
mois-15
ture variability using Gaussian and beta distribution functions during the Southern Great Plains 1997 (SGP97) hydrology experiment, Water Resour. Res., 41, W12433, doi:10.1029/2004wr003835, 2005.
SAS Institute: Base SAS 9.3 Procedures Guide: SAS Institute, Inc. Cary, NC, 2011.
Smith, M. P., Zhu, A., Burt, J. E., and Stiles, C.: The effects of DEM resolution and neighborhood
20
size on digital soil survey, Geoderma, 137, 58–69, 2006.
Scenarios Network for Alaska and Arctic Planning: available at: http://www.snap.uaf.edu (last access: 6 March 2014), 2014.
Tang, J. Y., Riley, W. J., Koven, C. D., and Subin, Z. M.: CLM4-BeTR, a generic biogeochemical transport and reaction module for CLM4: model development, evaluation, and application,
25
Geosci. Model Dev., 6, 127–140, doi:10.5194/gmd-6-127-2013, 2013.
Tarnocai, C. and Bockheim, J. G.: Cryosolic soils of Canada: genesis, distribution, and classifi-cation, Can. J. Soil Sci., 91, 749–762, 2011.
Thompson, J. A. and Kolka, R. K.: Soil carbon storage estimation in a forested watershed using quantitative soil landscape modeling, Soil Sci. Soc. Am. J., 69, 1086–1093, 2005.
30
Thompson, J. A., Bell, J. C., and Butler, C. A.: Digital elevation model resolution: effects on
BGD
12, 1721–1751, 2015Scaling impacts on environmental controls and spatial heterogeneity of SOC
stocks
U. Mishra and W. J. Riley
Title Page
Abstract Introduction
Conclusions References
Tables Figures
◭ ◮
◭ ◮
Back Close
Full Screen / Esc
Printer-friendly Version
Interactive Discussion
Discussion
P
a
per
|
Discussion
P
a
per
|
Discussion
P
a
per
|
Discussion
P
a
per
|
Thompson, J. A., Pena-Yewtukhiw, E. M., and Grove, J. H.: Soil–landscape modeling across a physiographic region: topographic patterns and model transportability, Geoderma, 133, 57–70, 2006.
Todd-Brown, K. E. O., Randerson, J. T., Post, W. M., Hoffman, F. M., Tarnocai, C.,
Schuur, E. A. G., and Allison, S. D.: Causes of variation in soil carbon simulations from
5
CMIP5 Earth system models and comparison with observations, Biogeosciences, 10, 1717– 1736, doi:10.5194/bg-10-1717-2013, 2013.
Vasques, G. M., Grunwald, S., Comerford, N. B., and Sickman, J. O.: Regional modelling of soil carbon at multiple depths within a subtropical watershed, Geoderma, 156, 326–336, 2010. Vasques, G. M., Grunwald, S., and Myers, D. B.: Influence of the spatial extent and
resolu-10
tion of input data on soil carbon models in Florida, USA, J. Geophys. Res., 117, G04004, doi:10.1029/2012JG001982, 2012.
Webster, R. and Oliver, M. A.: Sample adequately to estimate variograms of soil properties, J. Soil Sci., 43, 117–192, 1992.
Webster, R. and Oliver, M. A.: Geostatistics for Environmental Scientists, John Wiley and Sons,
15
West Sussex, England, 2007.
Western, A. W. and Boschl,. G.: On the spatial scaling of soil moisture, J. Hydrol., 217, 203– 224, 1999.
Western, A. W., Grayson, R. B., and Bloschl, G.: Scaling of soil moisture: a hydrologic perspec-tive, Annu. Rev. Earth Planet. Sci., 30, 149–180, 2002.
20
Wilson, J. P. and Gallant, J. C.: Digital terrain analysis, in: Terrain Analysis, edited by: Wil-son, J. P. and Gallant, J. C., John Wiley and Sons, New York, 1–27, 2000.
BGD
12, 1721–1751, 2015Scaling impacts on environmental controls and spatial heterogeneity of SOC
stocks
U. Mishra and W. J. Riley
Title Page
Abstract Introduction
Conclusions References
Tables Figures
◭ ◮
◭ ◮
Back Close
Full Screen / Esc
Printer-friendly Version
Interactive Discussion
Discussion
P
a
per
|
Discussion
P
a
per
|
Discussion
P
a
per
|
Discussion
P
a
per
|
Table 1.Environmental predictors and predicted variance of soil organic carbon stocks across
different spatial scales. Black dots represent statistically significant (P <0.05) predictors.
Environmental Spatial scale
variables 50 m 100 m 200 m 500 m 1 km 2 km 5 km 10 km
Elevation • • • • • • • •
Slope •
Aspect •
SWI • • •
STI •
Temperature • • • • • • • •
PET • • • • • • • •
Barren • • • • •
Scrub • • • • • • • •
Herb •
Pasture • •
Glacial Moraine • • • •
Fluvial • • • • •
Undifferentiated Mosaic •
Coastal delta • •
Volcanic mountain • •
BGD
12, 1721–1751, 2015Scaling impacts on environmental controls and spatial heterogeneity of SOC
stocks
U. Mishra and W. J. Riley
Title Page
Abstract Introduction
Conclusions References
Tables Figures
◭ ◮
◭ ◮
Back Close
Full Screen / Esc
Printer-friendly Version
Interactive Discussion
Discussion
P
a
per
|
Discussion
P
a
per
|
Discussion
P
a
per
|
Discussion
P
a
per
|
Table 2. Modeled variogram parameters of predicted soil organic carbon stocks at various spatial scales.
Spatial scale Nugget Sill Nugget/sill Range
(m) (Ln kg m−2)2 (Ln kg m−2)2 (%) (km)
50.00 0.12 0.45 27 1484
100.00 0.07 0.26 27 1094
200.00 0.04 0.20 19.5 1126
500.00 0.03 0.16 18 1124
1000.00 0.03 0.15 19 1078
2000.00 0.04 0.17 21 1170
5000.00 0.03 0.16 20.5 1174
BGD
12, 1721–1751, 2015Scaling impacts on environmental controls and spatial heterogeneity of SOC
stocks
U. Mishra and W. J. Riley
Title Page
Abstract Introduction
Conclusions References
Tables Figures
◭ ◮
◭ ◮
Back Close
Full Screen / Esc
Printer-friendly Version
Interactive Discussion
Discussion
P
a
per
|
Discussion
P
a
per
|
Discussion
P
a
per
|
Discussion
P
a
per
|
Soil organic carbon stocks (kg m-2)
0 50 100 150 200 250 300
N
u
m
b
e
r
o
f
o
b
s
e
rv
a
ti
o
n
s
0 20 40 60 80 100 120 140 160 180 200
Minimum = 0.35 Maximum = 296 Average = 47.4 Median = 37.5 Standard Dev. = 38.4 Skewness = 2 Number of samples = 556
BGD
12, 1721–1751, 2015Scaling impacts on environmental controls and spatial heterogeneity of SOC
stocks
U. Mishra and W. J. Riley
Title Page
Abstract Introduction
Conclusions References
Tables Figures
◭ ◮
◭ ◮
Back Close
Full Screen / Esc
Printer-friendly Version
Interactive Discussion
Discussion
P
a
per
|
Discussion
P
a
per
|
Discussion
P
a
per
|
Discussion
P
a
per
|
Figure 2.The spatial scaling approach used in this study. The black dot represents the
loca-tion of an SOC sampling site, and the rectangles denote different pixel sizes of environmental
BGD
12, 1721–1751, 2015Scaling impacts on environmental controls and spatial heterogeneity of SOC
stocks
U. Mishra and W. J. Riley
Title Page
Abstract Introduction
Conclusions References
Tables Figures
◭ ◮
◭ ◮
Back Close
Full Screen / Esc
Printer-friendly Version
Interactive Discussion
Discussion
P
a
per
|
Discussion
P
a
per
|
Discussion
P
a
per
|
Discussion
P
a
per
|
Figure 3.Control of environmental factors on SOC stocks as a function of spatial scale. Each
dot is a median geographically weighted regression coefficient (β) for a particular spatial scale.
The fitted functions are:(a) elevationβ=−0.0009+0.0003·(1−exp(−0.0089·s)), adjusted
R2=0.83,P <0.004,(b)temperatureβ=−0.11+0.037·(1−exp(−0.012·s)), adjustedR2=
0.94,P <0.001,(c) potential evapotranspirationβ=0.066+0.187·exp(−0.035·s), adjusted
BGD
12, 1721–1751, 2015Scaling impacts on environmental controls and spatial heterogeneity of SOC
stocks
U. Mishra and W. J. Riley
Title Page
Abstract Introduction
Conclusions References
Tables Figures
◭ ◮
◭ ◮
Back Close
Full Screen / Esc
Printer-friendly Version
Interactive Discussion
Discussion
P
a
per
|
Discussion
P
a
per
|
Discussion
P
a
per
|
Discussion
P
a
per
|
Figure 4.Change of variogram parameters with scale (a), and calculated variograms of
log-transformed predicted SOC stocks (b)at spatial scales of 50, 100, 200, 500 m, 1, 2, 5, and
10 km. Fitted functions are: sill=0.163+0.763·exp(−0.0197·s), adjustedR2=0.98,P <0.001;
BGD
12, 1721–1751, 2015Scaling impacts on environmental controls and spatial heterogeneity of SOC
stocks
U. Mishra and W. J. Riley
Title Page
Abstract Introduction
Conclusions References
Tables Figures
◭ ◮
◭ ◮
Back Close
Full Screen / Esc
Printer-friendly Version
Interactive Discussion
Discussion
P
a
per
|
Discussion
P
a
per
|
Discussion
P
a
per
|
Discussion
P
a
per
|
Figure 5. Variance of soil organic carbon stocks as a function of spatial scale. Each dot is predicted variance of SOC stock at each spatial scale across Alaska. The fitted function is:
BGD
12, 1721–1751, 2015Scaling impacts on environmental controls and spatial heterogeneity of SOC
stocks
U. Mishra and W. J. Riley
Title Page
Abstract Introduction
Conclusions References
Tables Figures
◭ ◮
◭ ◮
Back Close
Full Screen / Esc
Printer-friendly Version
Interactive Discussion
Discussion
P
a
per
|
Discussion
P
a
per
|
Discussion
P
a
per
|
Discussion
P
a
per
|
Figure 6.Higher-order moments of predicted SOC stocks as a function of spatial scale(a), and
relationships between predicted mean SOC stocks and its(b)variance,(c)skewness, and(d)