Comparison of Glomerular Transcriptome
Profiles of Adult-Onset Steroid Sensitive Focal
Segmental Glomerulosclerosis and Minimal
Change Disease
Jun Tong1☯, Jingyuan Xie1,2☯, Hong Ren1, Jian Liu1, Weijia Zhang3, Chengguo Wei3,
Jing Xu1, Wen Zhang1, Xiao Li1, Weiming Wang1,2, Danfeng Lv4, John Cijiang He2,3*, Nan Chen1,2*
1Department of Nephrology, Ruijin Hospital, Shanghai Jiao Tong University School of Medicine, Shanghai, P. R. China,2Institute of Nephrology, Shanghai Jiao Tong University School of Medicine, Shanghai, P. R. China,3Department of Medicine, Division of Nephrology, Icahn School of Medicine at Mount Sinai, New York, New York, United States of America,4National Center for Gene Research and Institute of Plant Physiology and Ecology, Chinese Academy of Sciences, Shanghai, P. R. China
☯These authors contributed equally to this work. *[email protected](JCH);[email protected](NC)
Abstract
Objective
To search for biomarkers to differentiate primary focal segmental glomerulosclerosis (FSGS) and minimal change disease (MCD).
Methods
We isolated glomeruli from kidney biopsies of 6 patients with adult-onset steroid sensiti-veFSGS and 5 patients with MCD, and compared the profiles of glomerular transcriptomes between the two groups of patients using microarray analysis.
Results
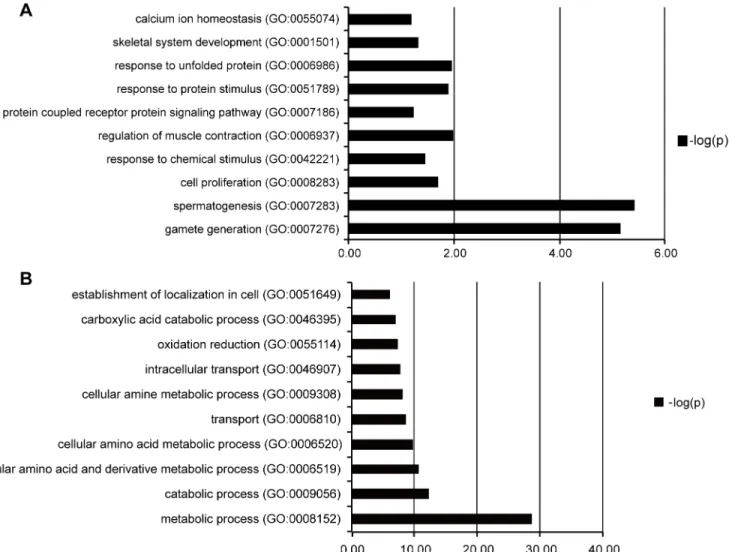
Analysis of differential expressed genes (DEGs) revealed that up-regulated DEGs in FSGS patients compared with MCD patients were primarily involved in spermatogenesis, gamete generation, regulation of muscle contraction, response to unfolded protein, cell proliferation and skeletal system development. The down-regulated DEGs were primarily related to met-abolic process, intracellular transport, oxidation/reduction andestablishment of intracellular localization. We validated the expression of the top 6 up-regulated and top 6 lated DEGs using real-time PCR. Membrane metallo-endopeptidase (MME) is a down-regu-lated gene that was previously identified as a key gene for kidney development.
Immunostaining confirmed that the protein expression of MME decreased significantly in FSGS kidneys compared with MCD kidneys.
a11111
OPEN ACCESS
Citation:Tong J, Xie J, Ren H, Liu J, Zhang W, Wei C, et al. (2015) Comparison of Glomerular Transcriptome Profiles of Adult-Onset Steroid Sensitive Focal Segmental Glomerulosclerosis and Minimal Change Disease. PLoS ONE 10(11): e0140453. doi:10.1371/journal.pone.0140453
Editor:Stuart E Dryer, University of Houston, UNITED STATES
Received:March 4, 2015
Accepted:September 25, 2015
Published:November 4, 2015
Copyright:© 2015 Tong et al. This is an open access article distributed under the terms of the
Creative Commons Attribution License, which permits unrestricted use, distribution, and reproduction in any medium, provided the original author and source are credited.
Data Availability Statement:Expression data of all probesets were deposited in Table M inS3 Fileof the supplemental material. Expression data of all probesets have also been deposited in Gene Expression omnibus, GPL6244GSE, GSE69814. The large number of differential expressed genes(DEGs) were deposited in Tables I - L inS2 Fileof the supplemental material.
Conclusions
This report was the first study to examine transcriptomes in Chinese patients with various glomerular diseases. Expressions of MME both in RNA and protein level decreased significantly in glomeruli of FSGS kidneys compared with MCD kidneys. Our data sug-gested that MME might play a role in the normal physiological function of podocytes and a decrease in MME expression might be related to podocyte injury. We also identified genes and pathways specific for FSGS versus MCD, and our data could help identify potential new biomarkers for the differential diagnosis between these two diseases.
Introduction
Both minimal change disease (MCD) and focal segmental glomerulosclerosis (FSGS) are com-mon causes of nephrotic syndrome in adults and children[1]. The primary treatment strategies of MCD and FSGS include corticosteroids and immunosuppressants[2].Patients with MCD usually achieve complete remission with corticosteroid therapy, but the majority of patients with FSGS manifest as corticosteroid-dependent or resistant[3].Differences in the treatment responses and prognoses support the importance of a diagnostic marker to differentiate between these two diseases.
The diagnosis of FSGS is based on kidney biopsies that show focal and segmental areas of glomerular sclerosis and tuft collapse[4].However, histological diagnosis has limitations because it does not reflect the underlying molecular mechanisms. Additionally, most kidney biopsies are performed in patients with advanced disease.
FSGS is a glomerular disease that is primarily caused by podocyte injury. Therefore, it is important to analyze the transcriptome in isolated glomeruli instead of kidney cortices. The profiling of gene expression in glomeruli could aid the identification of differentially expressed genes between glomerular diseases and define specific molecular subclasses of dis-eases. Gene expression profiles were reported in glomeruli isolated from biopsy samples of patients with diabetic nephropathy,[5] lupus nephritis,[6] obesity-associated glomerulopathy, [7] and FSGS. Three microarray studies were performed on FSGS patients. Schwab[8] studied the transcriptome characters of childhood-onset FSGS, which might be different from adult FSGS patients. Hodgin[9] used mRNA extracted from formalin-fixed, paraffin-embedded renal specimens, which were not suitable for transcriptome analysis because the RNA integrity and quantity might be injured during the sample preparation. Other studies involved compar-atively smaller numbers of patients, making themselves less reliable. For instance, only 4 female FSGS patients were recruited for microarray analysis in Bennett’s study.Glomeruli iso-lated for the current study were collected from kidney biopsies of 6 FSGS patients and 5 MCD patients. Total RNA was extracted from isolated glomeruli for gene expression profiling tests. Transcriptomic data were analyzed and validated using quantitative PCR and immunohis-tochemistry to identify differential expressed genes (DEGs) between FSGS and MCD groups. DEGs were further analyzed to determine the potential cellular and biological processes involved in these diseases.
81570598, 81370015), the International Cooperation and Exchange Projects of Shanghai Science and Technology Commettee (No.14430721000), and the Chinese Medical Association clinical research special fund (No.13030280413). The funders had no role in study design, data collection and analysis, decision to publish, or preparation of the manuscript.
Materials and Methods
Ethics Statement
The Institutional Review Board of Ruijin Hospital, Shanghai Jiao Tong University School of Medicine approved this study, which was performed according to the Principles in the Helsinki Declaration II. Written informed consent was obtained from each patient.
All renal biopsies were performed by percutaneous technique using standard ultrasound imaging instruments (Diagnostic ultrasound system Aplio Model SSA-770A; Toshiba Medical Systems Corporation, Japan) and a 15 cm and a 12 cm long needle with penetration depth ran-ged from 3.5 to 5.5 cm and sample notch from 3.5 to 4 cm kidney tissues were originally col-lected for pathological diagnosis including standard procedures of light, immunofluorescence and electron microscopy.
After the above process, additional kidney tissues were archived and were cut into slices less than 0.5 cm thick using a scalpel, placed into a Rnase free freezing tube, then stored in liquid nitrogen.
Patients
All of the patients who were recruited in this study were admitted and followed up in the Nephrology Department in Ruijin Hospital, Shanghai Jiao Tong University School of Medi-cine. We prospectively collected kidney biopsies from patients with newly diagnosed nephrotic syndrome (defined as 24 hour urinary protein>3.5 g/d, serum albumin<30g/L, referred to 2012 Kidney Disease: Improving Global Outcomes (KDIGO) clinical practice guideline on glomerulonephritis) when receiving renal biopsy. Subsequently, patients with nephrotic syn-drome were selected who were responded to prednisone treatment (1mg/kg/d) within 6–8 weeks dated from the recruitment.
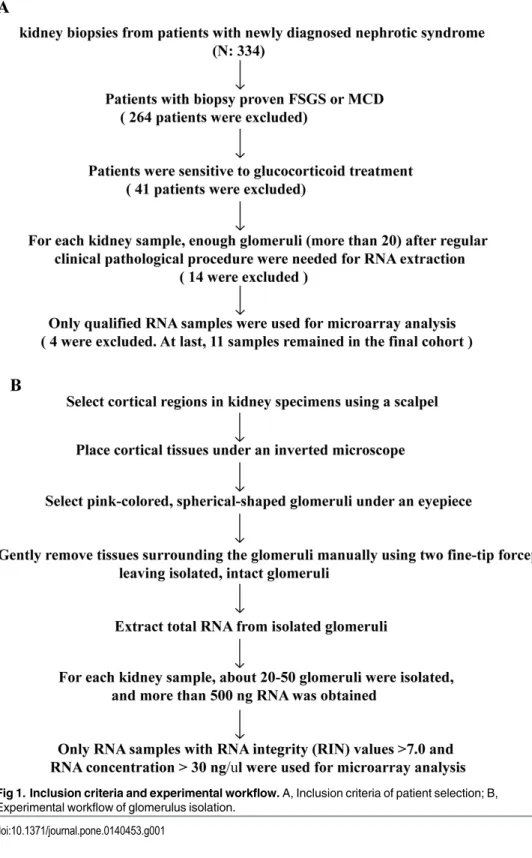
The inclusion criteria of patient selection and procedures of glomerulus isolation were pre-sented inFig 1A and 1Brespectively, an informed consent was signed by the patient. The fol-lowing exclusion criteria were used: 1) Obesity(BMI<30); 2) HIV-associated nephropathy; 3) Infection; 4) Reflux nephropathy; 5) Autoimmune diseases; 6) Malignant cancers; 7) Alcohol-ism or long-term smoker (more than 3 months); or 8) Patients had a family history of kidney diseases or extrarenal manifestations, including hearing loss and eye problems that are sugges-tive of hereditary kidney diseases, such as Alport's syndrome (AS), thin basement membrane disease (TBMD) or Fabry disease. The diagnosis and differentiation of CKD stage were deter-mined according to the criteria of the National Kidney Foundation (NKF). The glomerular fil-tration rate (GFR) was estimated using the equation from the study‘‘Modification of Diet in Renal Disease”(MDRD)[10].
We recruited MCD patients as the control group. To avoid the bias originated from response to steroid therapy, in the current study, we only recruited patients with steroid-sensi-tive nephrotic syndrome both in FSGS and MCD groups.
Clinical characteristics were recorded for all patients at baseline and during follow-up. Two senior pathologists reviewed all renal biopsy slides. A semiquantitative scoring method was adopted to evaluate pathological lesions. A percentage of focal and global glomerulosclerosis was recorded, and a score of 0 (0%), 1 (<25%), 2 (25–50%) or 3 (>50%) was assigned to each slide to reflect the severity of tubular atrophy, interstitial fibrosis, and inflammatory cell infiltration[11].
Glomerulus Isolation and RNA Extraction
detected under an eyepiece, and isolated for RNA extraction. Procedures of glomerulus isola-tion were presented as a flowchart (Fig 1B).
Total RNA of isolated glomeruli was prepared using the Ambion RNAqueous1
-Micro Kit (Ambion, AM1931, USA) according to the manufacturer’s protocol. All of the RNA samples Fig 1. Inclusion criteria and experimental workflow.A, Inclusion criteria of patient selection; B, Experimental workflow of glomerulus isolation.
were analyzed using a Bioanalyzer (2100 RNA Quality Control, Agilent Technologies) to verify sample purity. RNA concentrations were determined, using a NanoDrop 2000 (Thermo, Wil-mington, USA) at an absorbance of 260 nm, and quality control standards were A260/ A280 = 1.8–2.1. Only RNA samples with RNA integrity (RIN) values>7.0 and an RNA concentration>30 ng/μl were used for microarray analysis. For each kidney sample, about 20–50 glomeruli were isolated, and more than 500 ng qualified RNA was obtained.
Microarray Hybridization
Total RNA was converted into cDNA, which was fragmented, labeled, and hybridized onto gene chips (Microarray Gene 1.0, Affymetrix, Santa Clara, CA) according to Affymetrix stan-dard protocols. Affymetrix1Expression Console Software (version 1.2.1) was used for micro-array analyses.
Expression data of all probesets detected by microarray analysis have been deposited in Gene Expression omnibus, GPL6244GSE, GSE69814.
Analysis of Microarray Data
Robust Multichip Average (RMA) was used with the default configuration for background adjustment and normalization[12]. LIMMA was used using a q-value<5% for the identifica-tion of differentially expressed genes in microarray experiments in R[13].The threshold was set to P<0.005 for LIMMA and fold-change>1.5. PCA analysis was performed to assess sample correlations using the expression data of all detected genes. Functional analyses (Gene Ontol-ogy, Pathway analysis) of DEGs were performed using the online tool Enrichr program[14].
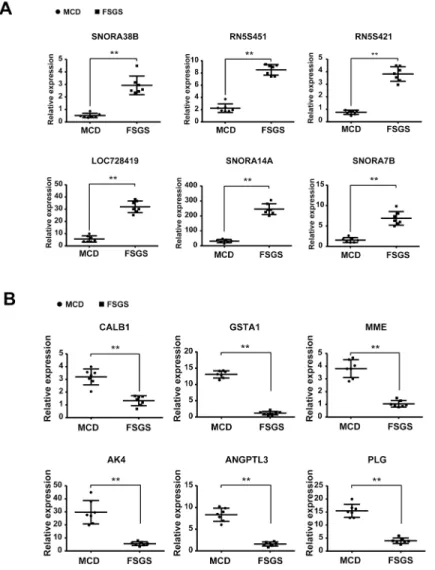
Validation with Real-time PCR
Twelve gene transcripts, including the top 6 up-regulated genes (SNORA38B, RN5S451, RN5S421, LOC728419, SNORA14A, and SNORA7B) and top 6 down-regulated genes (CALB1, GSTA1, MME, AK4, ANGPTL3, and PLG) in FSGS compared with MCD were cho-sen for validation. The mRNA expression levels of these genes was confirmed using real-time PCR from fourteen additional RNA samples from patients with histologically diagnosed FSGS or MCD who manifested with newly diagnosed nephrotic syndrome without previously using glucocorticoids or immunosuppressants. These patients were distinct from the patients we selected for microarray analysis. The clinical parameter, treatment strategy and outcome of patients were presented in Tables A-D inS1 File. First-strand cDNA was prepared from total RNA samples (0.5μg) using the SuperScriptTMIII First-Strand Synthesis Kit (Invitrogen), and
cDNA (1μl) was amplified in triplicate using the SYBR GreenER qPCR Supermix in an ABI
PRISM 7900 HT (Applied Biosystems, Foster City, CA). Primers were designed using Primer-Blast (http://www.ncbi.nlm.nih.gov/tools/primer-blast/, last accessed February 11, 2015) and synthesized by Sigma. Light cycler analysis software was used to determine crossing points using the second derivative method. Data were normalized to the housekeeping gene GAPDH, and results are presented as fold-changes between different groups using the Pfaffl method [15].
Immunohistochemistry
processed as follows. Formalin-fixed and paraffin-embedded specimens were deparaffinized, and H2O2was used to inactivate endogenous peroxidase. Specimens were blocked in 2% goat serum diluted in phosphate-buffered saline (PBS) for 1 hour at room temperature and incu-bated in a 1:50-diluted mouse anti-MME antibody (Thermo, Grand Island, NY) at 4°C over-night. Subsequently, specimens were washed three times with PBS and incubated in a 1:1000-diluted secondary antibody (goat anti mouse IgG, Thermo, Grand Island, NY) for 2 hours at room temperature. Positive staining was revealed using peroxidase-labeled streptavi-din and a diaminobenzistreptavi-dine substrate[16]. For determination of immunohistochemistry stain-ing, stained sections were imaged using the Image Analysis System (AxioVision 4, Carl Zeiss, Germany). The positively stained cells in the glomeruli were counted from six randomized selected areas of kidney sections for each patient, and expressed as the number of positively stained cells per square millimeter of glomerular cross-section, then the difference was ana-lyzed by one-way ANOVA followed by Bonferroni correction. A P value less than 0.05 was considered statistically significant.
Statistical analysis
Distributions for categorical variables are described as frequencies and percentages, and pro-portions between groups were compared using aχ2test. Distributions for normally distributed quantitative variables are described as the arithmetic means and standard deviations (or medi-ans and ranges for non-normally distributed variables). Student'st-test or Mann-Whitney U
test was used to compare the continued variables based on their distributions. In immunohisto-chemical analysis, the difference among varied groups was analyzed by one-way ANOVA fol-lowed by Bonferroni’s post hoc test. A P—value less than 0.05 was considered statistically significant.
Results
Clinical Parameters
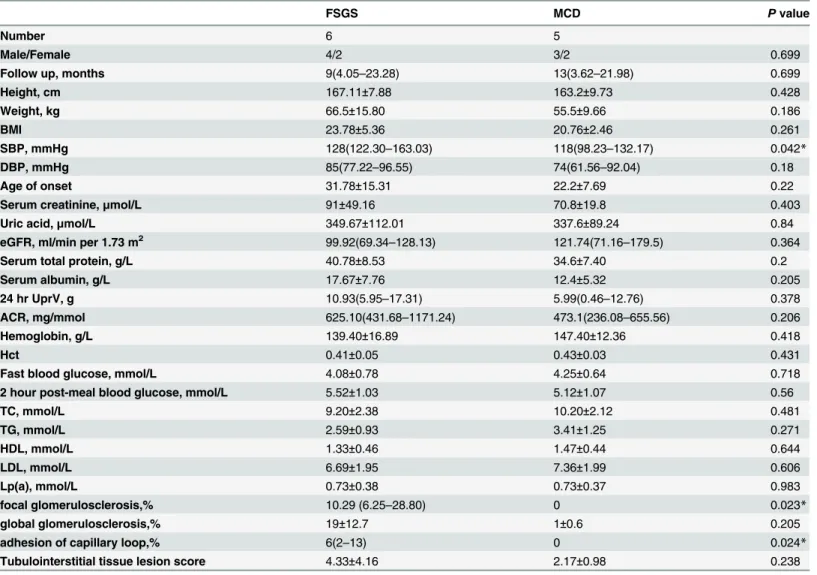
The clinical parameter and outcome of patients enrolled in the microarray analysis were recorded (Tables E-H inS1 File). Patients receive 1mg/kg/d prednisone treatment after diagno-sis, accroding to 2012 Kidney Disease: Improving Global Outcomes (KDIGO) clinical practice guideline on glomerulonephritis (GN).The mean follow-up time was 13.67±12.51 months for the FSGS group and 12.8±7.40 months for the MCD group (p>0.05). Eleven patients with nephrotic syndrome (FSGS, n = 6; MCD, n = 5) were enrolled in our experiment. Four FSGS patients (F1, F2, F4, F5) and 4 MCD patients (M1, M2, M3, M5) were at CKD1 (72.73%). One MCD patient (M4) was at CKD2 (9.09%), and two FSGS patients (F3, F6) were at CKD3 (18.18%). No significant differences in baseline clinical parameters were found between the two groups, except a higher systolic blood pressure in the FSGS patients (Table 1).
Microarray Analysis
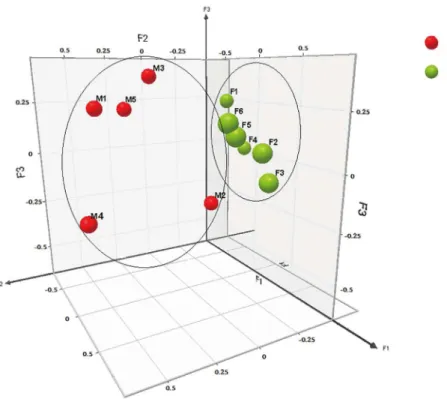
We performed microarray analysis of glomerular gene expression from FSGS and MCD patients and identified DEGs between these two groups. We performed PCA analyses to iden-tify sample correlations using the raw data obtained from microarray studies (Fig 4). Compari-sons of the gene expression profiles between FSGS and MCD patients revealed several patterns of disease-specific changes between the two diseases (Fig 5). Gene ontology and pathway analy-ses were also performed in the DEGs.
Among DEGs, 272 genes were up-regulated in FSGS compared with MCD. These genes are involved in spermatogenesis, gamete generation, regulation of muscle contraction, response to unfolded protein, cell proliferation and skeletal system development. A total of 2331 genes were down-regulated, and these genes are related to metabolic process, intracellular transport, oxidation reduction, establishment of localization in cell bodies (Fig 6). The large number of genes were deposited in the supplemental material. (Tables I–L inS2 File, Table M inS3 File). Table 1. Clinical Parameters of Patients with FSGS and MCD.
FSGS MCD Pvalue
Number 6 5
Male/Female 4/2 3/2 0.699
Follow up, months 9(4.05–23.28) 13(3.62–21.98) 0.699
Height, cm 167.11±7.88 163.2±9.73 0.428
Weight, kg 66.5±15.80 55.5±9.66 0.186
BMI 23.78±5.36 20.76±2.46 0.261
SBP, mmHg 128(122.30–163.03) 118(98.23–132.17) 0.042*
DBP, mmHg 85(77.22–96.55) 74(61.56–92.04) 0.18
Age of onset 31.78±15.31 22.2±7.69 0.22
Serum creatinine,μmol/L 91±49.16 70.8±19.8 0.403
Uric acid,μmol/L 349.67±112.01 337.6±89.24 0.84
eGFR, ml/min per 1.73 m2 99.92(69.34
–128.13) 121.74(71.16–179.5) 0.364
Serum total protein, g/L 40.78±8.53 34.6±7.40 0.2
Serum albumin, g/L 17.67±7.76 12.4±5.32 0.205
24 hr UprV, g 10.93(5.95–17.31) 5.99(0.46–12.76) 0.378
ACR, mg/mmol 625.10(431.68–1171.24) 473.1(236.08–655.56) 0.206
Hemoglobin, g/L 139.40±16.89 147.40±12.36 0.418
Hct 0.41±0.05 0.43±0.03 0.431
Fast blood glucose, mmol/L 4.08±0.78 4.25±0.64 0.718
2 hour post-meal blood glucose, mmol/L 5.52±1.03 5.12±1.07 0.56
TC, mmol/L 9.20±2.38 10.20±2.12 0.481
TG, mmol/L 2.59±0.93 3.41±1.25 0.271
HDL, mmol/L 1.33±0.46 1.47±0.44 0.644
LDL, mmol/L 6.69±1.95 7.36±1.99 0.606
Lp(a), mmol/L 0.73±0.38 0.73±0.37 0.983
focal glomerulosclerosis,% 10.29 (6.25–28.80) 0 0.023*
global glomerulosclerosis,% 19±12.7 1±0.6 0.205
adhesion of capillary loop,% 6(2–13) 0 0.024*
Tubulointerstitial tissue lesion score 4.33±4.16 2.17±0.98 0.238
BMI: body mass index; SBP: systolic blood pressure; DBP: diastolic blood pressure; GFR: glomerularfiltration rate; Alb: albumin; 24 hr UprV: protein amount of 24 hours urine; ACR: albumin-creatinine ratio; Hct: Hematocrit; TC: total cholesterol; TG: triglycerides; HDL: high density lipoprotein; LDL: low density lipoprotein; Lp(a): Lipoprotein (a).
*P<0.05, FSGS versus MCD patients.
Validation of Gene Expression using Real-time PCR
We chose the top 6 up-regulated genes (SNORA38B, RN5S451, RN5S421, LOC728419, SNORA14A, and SNORA7B) and the top 6 down-regulated genes (CALB1, GSTA1, MME, AK4, ANGPTL3, and PLG) in FSGS compared with those in MCD for further validation. Vali-dation was conducted using real-time PCR in an independent cohort composed of 7 FSGS patients and 7 MCD patients. Primer sequences were listed inTable 2. We confirmed that the changes in gene expression in FSGS patients were consistent with the microarray results (Fig 7). Schmid et al[17] have described glomerular podocin/synaptopodin mRNA expression as a potential marker to differentiate between MCD and FSGS, as well as steroid resistent and ste-roid sensitive cases. Hence, we validated the ratio glomerular podocin/synaptopodin mRNA, and found the ratio of podocin relative to synaptopodin mRNA allowed a clear separation between MCD and FSGS with no overlap (MCD mean ratio, 8.39 ±0.38; FSGS mean ratio, 1.56 ±0.18; P<0.01.Fig 8).
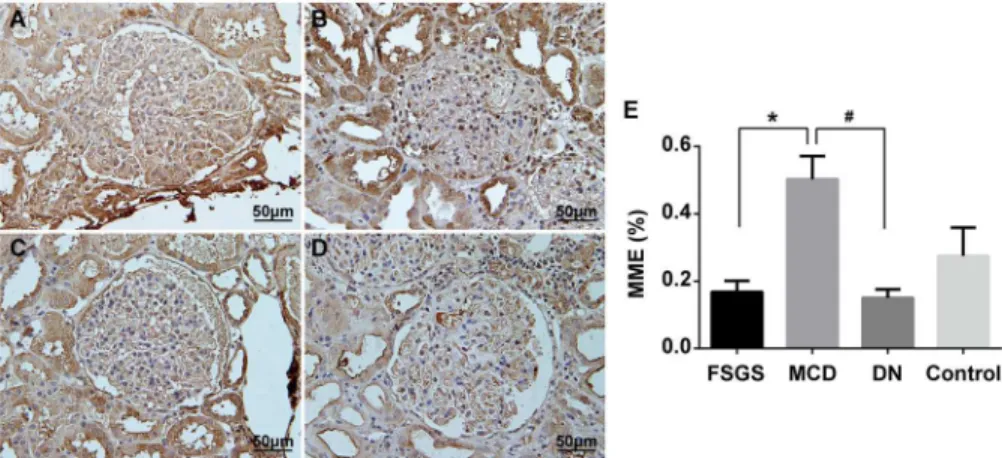
Immunostaining of MME
MME plays an important role in glomerular diseases. Therefore, we selected MME to further validate the expression differences between FSGS and MCD at the protein level using immu-nostaining. Validation was conducted in an independent cohort composed of 7 FSGS patients and 7 MCD patients. These patients came from the group where the real-time PCR samples were obtained. Protein levels of MME were markedly reduced in kidneys of patients with FSGS compared with patients with MCD (Fig 9). Previous studies suggested that MME was down-regulated in diabetic nephropathy (DN)[18]. Therefore, we also examined MME expression in DN and found that MME expression was decreased in kidneys of patients with DN compared with that in patients with MCD. These findings suggested that MME could be used as a marker to differentiate FSGS from MCD.
Fig 2. Glomerulus isolation.A, Cortex of kidney biopsy; B, Glomerulus isolation under an inverted microscope; C, Isolated glomerulus; D, 5 isolated glomerulus were pulled together.
Discussion
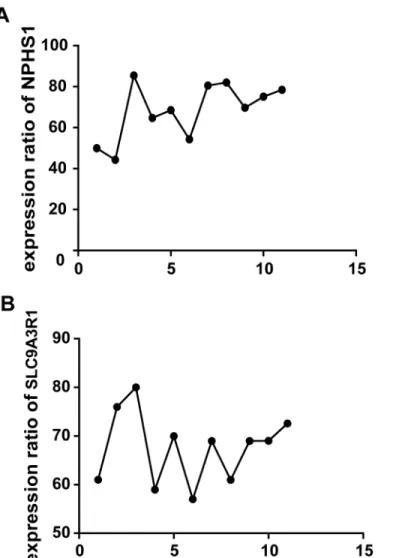
We revealed differences in the transcriptional profile between FSGS and MCD using high throughput gene expression profiling of isolated glomeruli from patients with biopsy-proven idiopathic FSGS and MCD. Hodgin et al reported that genes that participated in cell motility, migration, differentiation and morphogenesis were up-regulated in FSGS patients, while podo-cyte specific genes were significantly down-regulated in FSGS group compared with normal and MCD groups. We found podocyte specific genes (SYNPO, NPHS1) were down-regulated in glomeruli of FSGS patients compared with those of MCD patients, which is consistent with findings from Hodgin et al. Bennett et al[19] reported that genes implicated in kidney fibrosis, the TGF-βsignaling pathway, transcription factors that drive chondrogenesis and fibrosis, were up-regulated in FSGS patients. We discovered genes that participated in TGF-βsignaling and kidney fibrosis were up-regulated in glomeruli of FSGS patients as opposed to those of MCD patients, which was congruent with findings from Bennett et al. Schwab concluded that genes involved in cell cycle and proliferation, immune responses, TGF-βsuperfamily signaling, Fig 3. Comparision of expression ratio of NPHS1, SLC9A3R1 in glomerulus versus tubulointerstitial using real-time PCR.A, Comparision of expression ratio of NPHS1 in isolated glomerulus versus tubulointerstitial; B, Comparision of expression ratio of SLC9A3R1 in tubulointerstitial versus glomerulus (Difference was analysed by Student'st-test,**indicatedP<0.01).
and RNA processing or splicing were up-regulated in kidneys of FSGS patients. We found genes involved in cell cycle and cell proliferation were up-regulated in glomeruli of FSGS patients in contrast to those of MCD patients, which was in line with resultsfrom Schwab et al. However, only Bennett and Hodgin’s studies used mRNA obtained from glomeruli. Schwab using the mRNA obtained from biopsied kidney.
We identified previously unreported up-regulated genes involved in gamete generation, reg-ulation of muscle contraction, response to unfolded protein, cell proliferation in FSGS patients, and down-regulated genes that were mostly related to intracellular transport, oxidation reduc-tion and establishment of localizareduc-tion. Many of these pathways are involved in kidney diseases [20] (Table N inS3 File).
Our data suggested that pathways that were activated in FSGS were quite different from those in MCD. For example, inflammation and fibrosis pathways were more activated in FSGS, and cell cytoskeleton-related pathways were suppressed in FSGS compared with MCD. A sig-nificant portion of these genes were identified previously in the pathogenesis of kidney dis-eases. Podocyte injury played a central role in the pathogenesis of FSGS[21].Several DEGs, such as MME and ANGPTL3, were important for podocyte morphology and function.
MME was involved in kidney development, and it is abundantly expressed in the kidney [22], particularly in podocytes[23]. Expression of MME at mRNA levels was significantly down-regulated in kidneys of patients with diabetic nephropathy (DN) [24]. MME appeared to have excessive activity induced by hyperglycemia, hypertension, and hyperlipidemia related to diabetes[25]. Inhibition of angiotensin-converting enzyme (ACE) is among one of the most effective treatments for hypertension and end-organ damage associated with diabetic nephrop-athy. Angiotensin-converting enzyme (ACE) inhibitor attenuated Ang II-induced extracellular Fig 4. 3D snapshot of PCA analysis of sample distribution based on the transcriptomes.The FSGS group was separated from the MCD group. Moreover, FSGS patients were far from MCD patients, which indicated dramatic transcriptomic changes in FSGS patients compared with MCD patients. F1 ~ F6 (green sphere) indicated FSGS patients; M1 ~ M5 (red sphere) indicated MCD patients.
matrix synthesis more efficiently in the absence of NEP[26]. And MME had a genetic linkage region for DN. MME was also a podocytic antigen that was responsible for human membra-nous nephropathy (MN). Alloimmunization against MME should be considered as a leading cause of membranous glomerulopathy early in life[27]. Absence of MME gene product in the mother resulted in the development of membranous nephropathy in the fetus because mater-nal anti-MME antibodies bound to MME on fetal podocytes[28]. The fetal podocytes undergo-ing apoptosis and nephron loss could lead to chronic renal failure in early adulthood.
Notably, our data demonstrated that MME might play a protective role in the normal physi-ological function of podocytes and a decrease in MME expression might cause podocyte injury, which leads to FSGS. However, there was no report about the role of MME in FSGS, and fur-ther studies were required to validate our results.
Among the top genes identified in our study, SNORA38B, SNORA14A and SNORA7B were small nucleolar RNA that function as ribonucleoprotein (RNP) enzymes in the processing of ribosomal RNAs (rRNAs) and small nuclear RNAs (snRNAs). The actions of these enzymes were related to mRNA splicing, genome integrity maintenance, and protein synthesis[29]. RN5S451 and RN5S421 were 5S rRNAs, which were major components of the fully functional ribosome that was responsible for protein synthesis[30]. LOC728419 (ubiquitin carboxyl-ter-minal hydrolase 17-like) was involved in ubiquitin-dependent apoptotic process[31].CALB1 (calbindin 1) primarily functions in metanephric ureteric bud development[32]. GSTA1 (gluta-thione S-transferase alpha 1) was a key enzyme in gluta(gluta-thione and xenobiotic metabolic pro-cesses and the generation of oxidative products[33]. AK4 (adenylate kinase 4) was responsible Fig 5. The Heat Map of gene expression profiles between FSGS and MCD patients.A total of 272 genes were up-regulated; A total of 2331 genes were down-regulated. Red indicated high expression. Green indicated low expression. Black indicated no significant difference between FSGS and MCD patients. F1 ~ F6 indicated FSGS patients. M1 ~ M6 indicated MCD patients.
Fig 6. Pathway of genes up-regulated and down-regulated in FSGS patients compared with MCD patients analyzed by using Enrichr GO Biological Process program.A: Pathway of genes up-regulated; B: Pathway of genes down-regulated.
doi:10.1371/journal.pone.0140453.g006
Table 2. Primer Sequences.
Gene Forward Reverse
SNORA38B CCTCCTACAAAGGCATGTCTAT TTCTATGTGGGATGGTTGATCTT
RN5S451 GCCTGCTGCCATAGTACTCTG CACGTATTCCTACCCAACTTTCTC
RN5S421 CCTTGGCAGGCACTGGT AGCCTCCAGCTCCCAGTCT
LOC728419 CAGCTCAGAGTGTCCAGCAA AGTTAACGTCTTGGAGGCCG
SNORA14A TGCATTCTTAAACCCTCTTGG AGATGTTGCAGGTATGAAATAAGA
SNORA7B GACCTCCTGGGATCGCAT CACTGTCGCAGAGTGTCTTCC
CALB1 GCTGAGCTTTTGCTCACTCC ACTTCCGTCAGCGTCGAAAT
GSTA1 TGATCCTCCTTCTGCCCGTA ACCAGATGAATGTCAGCCCG
MME TCTGCTGAGGGGTCACGATT AGGACCGAGAGGCTGATCTC
AK4 CTTTGAGTCACCCCCGCTT GCCGCCCCTTCATCCTTAAC
ANGPTL3 CAATGTCCCCAATGCAATCCC CCAGCCTCCTGAATAACCCT
PLG TGGGGAGAAACCCAAGGTACT CACAGAGTTCGGTGGATTGGA
GAPDH GGTGAAGGTCGGAGTCAAC CAAATGAGCCCCAGCCTTC
for cell proliferation, differentiation and cytoskeleton formation[34]. AK4 catalyzed the revers-ible transfer of adenosine triphosphate (ATP) or guanosine triphosphate (GTP) to adenosine monophosphate (AMP), and it played a key role in high-energy phosphoryl transfer and con-sumption of ATP and GTP[35]. AK4 was also an essential enzyme in energy metabolism in the cytosol, mitochondria and nucleus. ANGPTL3 (angiopoietin-like 3) was responsible for angio-genesis, glycerol, fatty acid metabolic processes, cell matrix adhesion, and integrin-mediated signaling pathways, and a role for ANGPTL3 in podocyte injury and glomerular disease was shown recently. Deletion of ANGPTL3 or interfering with the ANGPTL3-integrinβ3 interac-tion might be benefit for podocyte protecinterac-tion and attenuates proteinuria[36]. PLG (plasmino-gen) was an enzyme that degraded fibrin clots and participates in apoptotic processes. Future studies were required to determine the function of these genes in FSGS and whether these genes might serve as biomarkers for the differential diagnosis of FSGS and MCD.
Fig 7. Validation of the top 6 genes up-regulated and the top 6 genes down-regulated in FSGS patients compared with MCD patients using real-time PCR in glomerular transcriptomes.(Student'st-test or Mann-Whitney U test was used to compare the continued variables based on their distributions.**P<0.01, FSGS patients compared with MCD patients). A, Validation of the top 6 genes up-regulated; B, Validation of the top 6 genes down-regulated.
Limitations of our study included the relatively small sample size and the absence of normal kidney specimens as a control group. The nephrectomy samples might not be a good control as the ischemic changes between biopsy and nephrectomy samples were quite different. There-fore, we compared samples between FSGS and MCD patients. Future studies, such as the Fig 8. Validation of podocin/synaptopodin mRNA expression ratio in isolated glomeruli between MCD and FSGS patients using real-time PCR in glomerular transcriptomes.(Student'st-test was used to compare the the podocin/synaptopodin mRNA expression ratios.**P<0.01, FSGS patients compared with
MCD patients).
doi:10.1371/journal.pone.0140453.g008
Fig 9. Immunohistochemical staining of MME in kidney biopsies from patients with FSGS, MCD and DN. Representative pictures from individual patients were shown.A:Kidney biopsies from patients with FSGS. B:Kidney biopsies from patients with MCD. C:Kidney biopsies from patients with DN. D:Kidney biopsies from uninvolved portions of a kidney at the time of nephrectomy for renal clear cell carcinoma, as the control. E: Histogram.*P<0.01, FSGS patients compared with MCD patients,#P<0.01, DN patients
compared with MCD patients.
studies proposed in NEPTUNE, were required to determine gene expression profiles in a large patient population to validate our findings. In addition, our study has limited power to detect baseline characteristic differences between patients with MCD and FSGS. However, our study is the first transcriptomic analysis based on glomeruli between FSGS and MCD patients in the Chinese population. Our data suggested that this approach may reveal the underlying molecu-lar mechanisms of FSGS and MCD and identify potential biomarkers to aid the differential diagnosis between these two diseases.
Conclusions
In conclusion, we identified the up-regulated DEGs in FSGS patients compared with MCD patients were primarily involved in spermatogenesis, gamete generation, regulation of muscle contraction, response to unfolded protein, cell proliferation, skeletal system development. The down-regulated DEGs were primarily related to metabolic process, intracellular transport, oxi-dation reduction, establishment of localization in cell. Among these genes, MME was a down-regulated gene that was previously identified as a candidate gene for kidney development. Expression of MME both in RNA and protein levels were decreased significantly in glomeruli of FSGS kidneys compared with MCD kidneys.
Supporting Information
S1 File. Table A- Clinical and pathological parameter of patients with FSGS enrolled in real-time PCR analysis;Table B- Treatment strategy and outcome of patients with FSGS enrolled in real-time PCR analysis;Table C- Clinical and pathological parameter of patients with MCD enrolled in real-time PCR analysis;Table D- Treatment strategy and outcome of patients with MCD enrolled in real-time PCR analysis;Table E- Clinical and pathological parameter of patients with FSGS enrolled in microarray analysis;Table F- Treatment strategy and outcome of patients with FSGS enrolled in microarray analysis;Table G- Clinical and pathological parameter of patients with MCD enrolled in microarray analysis;Table H- Treatment strategy and outcome of patients with MCD enrolled in microarray analysis.
(XLSX)
S2 File. Table I-The 272 genes, which were up-regulated in FSGS patients compared with MCD patients, were analyzed by using Enrichr KEGG program;Table J-The 2331 genes, which were down-regulated in FSGS patients compared with MCD patients, were analyzed by using Enrichr KEGG program;Table K-The 272 genes, which were up-regulated in FSGS patients compared with MCD patients, were analyzed by using Enrichr GO Biological Pro-cess program;Table L-The 2331 genes, which were down-regulated in FSGS patients com-pared with MCD patients, were further analyzed by using Enrichr GO Biological Process program.
(XLSX)
S3 File. Table M-All probesets detected by microarray analysis;Table N-Compare the current data to those of previous reports.
(XLSX)
Acknowledgments
Author Contributions
Conceived and designed the experiments: JT J. Xie JCH NC. Performed the experiments: JT J. Xie DL. Analyzed the data: JT Weijia Zhang CW JCH. Contributed reagents/materials/analysis tools: HR J. Xu Wen Zhang XL WW DL. Wrote the paper: JT J. Xie JL.
References
1. Xie J, Wu X, Ren H, Wang W, Wang Z, Pan X, et al. COL4A3 mutations cause focal segmental glomer-ulosclerosis. J Mol Cell Biol. 2014; 6(6):498–505. doi:10.1093/jmcb/mju040PMID:25596306 2. Conlon PJ, Butterly D, Albers F, Rodby R, Gunnells JC, Howell DN. Clinical and pathologic features of
familial focal segmental glomerulosclerosis. Am J Kidney Dis. 1995; 26(1):34–40. PMID:7611265 3. Mak SK, Short CD, Mallick NP. Long-term outcome of adult-onset minimal-change nephropathy.
Nephrol Dial Transplant. 1996; 11(11):2192–201. PMID:8941578
4. Rood IM, Deegens JK, Wetzels JF. Genetic causes of focal segmental glomerulosclerosis: implications for clinical practice. Nephrol Dial Transplant. 2012; 27(3):882–90. doi:10.1093/ndt/gfr771PMID:
22334613
5. Baelde HJ, Eikmans M, Doran PP, Lappin DW, de Heer E, Bruijn JA. Gene expression profiling in glo-meruli from human kidneys with diabetic nephropathy. Am J Kidney Dis. 2004; 43(4):636–50. PMID:
15042541
6. Peterson KS, Huang JF, Zhu J, D'Agati V, Liu X, Miller N, et al. Characterization of heterogeneity in the molecular pathogenesis of lupus nephritis from transcriptional profiles of laser-captured glomeruli. J Clin Invest. 2004; 113(12):1722–33. PMID:15199407
7. Wu Y, Liu Z, Xiang Z, Zeng C, Chen Z, Ma X, et al. Obesity-related glomerulopathy: insights from gene expression profiles of the glomeruli derived from renal biopsy samples. Endocrinology. 2006; 147 (1):44–50. PMID:16210374
8. Schwab K, Witte DP, Aronow BJ, Devarajan P, Potter SS, Patterson LT. Microarray analysis of focal segmental glomerulosclerosis. Am J Nephrol. 2004; 24(4):438–47. PMID:15308877
9. Hodgin JB, Borczuk AC, Nasr SH, Markowitz GS, Nair V, Martini S, et al. A molecular profile of focal segmental glomerulosclerosis from formalin-fixed, paraffin-embedded tissue. Am J Pathol. 2010; 177 (4):1674–86. doi:10.2353/ajpath.2010.090746PMID:20847290
10. Chen LI, Guh JY, Wu KD, Chen YM, Kuo MC, Hwang SJ, et al. Modification of diet in renal disease (MDRD) study and CKD epidemiology collaboration (CKD-EPI) equations for Taiwanese adults. PLoS One. 2014; 9(6):e99645. doi:10.1371/journal.pone.0099645PMID:24927124
11. Working Group of the International Ig ANN, the Renal Pathology S, Cattran DC, Coppo R, Cook HT, Feehally J, et al. The Oxford classification of IgA nephropathy: rationale, clinicopathological correla-tions, and classification. Kidney Int. 2009; 76(5):534–45. doi:10.1038/ki.2009.243PMID:19571791 12. Bolstad BM, Irizarry RA, Astrand M, Speed TP. A comparison of normalization methods for high density
oligonucleotide array data based on variance and bias. Bioinformatics. 2003; 19(2):185–93. PMID:
12538238
13. Yoshida R, Imoto S, Higuchi T. Estimating time-dependent gene networks from time series microarray data by dynamic linear models with Markov switching. Proc IEEE Comput Syst Bioinform Conf. 2005:289–98. PMID:16447986
14. Chen EY, Tan CM, Kou Y, Duan Q, Wang Z, Meirelles GV, et al. Enrichr: interactive and collaborative HTML5 gene list enrichment analysis tool. BMC Bioinformatics. 2013; 14:128. doi: 10.1186/1471-2105-14-128PMID:23586463
15. Pfaffl MW. A new mathematical model for relative quantification in real-time RT-PCR. Nucleic Acids Res. 2001; 29(9):e45. PMID:11328886
16. Fan Y, Wei C, Xiao W, Zhang W, Wang N, Chuang PY, et al. Temporal Profile of the Renal Transcrip-tome of HIV-1 Transgenic Mice during Disease Progression. PLoS One. 2014; 9(3):e93019. doi:10. 1371/journal.pone.0093019PMID:24667548
17. Schmid H, Henger A, Cohen CD, Frach K, Grone HJ, Schlondorff D, et al. Gene expression profiles of podocyte-associated molecules as diagnostic markers in acquired proteinuric diseases. J Am Soc Nephrol. 2003; 14(11):2958–66. PMID:14569107
18. Zhang D, Gu T, Forsberg E, Efendic S, Brismar K, Gu HF. Genetic and functional effects of membrane metalloendopeptidase on diabetic nephropathy development. Am J Nephrol. 2011; 34(5):483–90. doi:
19. Bennett MR, Czech KA, Arend LJ, Witte DP, Devarajan P, Potter SS. Laser capture microdissection-microarray analysis of focal segmental glomerulosclerosis glomeruli. Nephron Exp Nephrol. 2007; 107 (1):e30–40. PMID:17684420
20. Luo H, Sawashita J, Tian G, Liu Y, Li L, Ding X, et al. Extracellular deposition of mouse senile AApoAII amyloid fibrils induced different unfolded protein responses in the liver, kidney, and heart. Lab Invest. 2015; 95(3):320–33. doi:10.1038/labinvest.2014.158PMID:25545477
21. Xie J, Hao X, Azeloglu EU, Ren H, Wang Z, Ma J, et al. Novel mutations in the inverted formin 2 gene of Chinese families contribute to focal segmental glomerulosclerosis. Kidney Int. 2015; 88(3):593–604. doi:10.1038/ki.2015.106PMID:26039629
22. Noordmans GA, Caputo CR, Huang Y, Sheehan SM, Bulthuis M, Heeringa P, et al. Genetic analysis of mesangial matrix expansion in aging mice and identification of Far2 as a candidate gene. J Am Soc Nephrol. 2013; 24(12):1995–2001. doi:10.1681/ASN.2012080838PMID:24009241
23. Pereira NL, Aksoy P, Moon I, Peng Y, Redfield MM, Burnett JC Jr., et al. Natriuretic peptide pharmaco-genetics: membrane metallo-endopeptidase (MME): common gene sequence variation, functional characterization and degradation. J Mol Cell Cardiol. 2010; 49(5):864–74. doi:10.1016/j.yjmcc.2010.
07.020PMID:20692264
24. Cohen CD, Lindenmeyer MT, Eichinger F, Hahn A, Seifert M, Moll AG, et al. Improved elucidation of biological processes linked to diabetic nephropathy by single probe-based microarray data analysis. PLoS One. 2008; 3(8):e2937. doi:10.1371/journal.pone.0002937PMID:18698414
25. Muangman P, Spenny ML, Tamura RN, Gibran NS. Fatty acids and glucose increase neutral endopep-tidase activity in human microvascular endothelial cells. Shock. 2003; 19(6):508–12. PMID:12785004 26. Maric C, Zheng W, Walther T. Interactions between angiotensin ll and atrial natriuretic peptide in reno-medullary interstitial cells: the role of neutral endopeptidase. Nephron Physiol. 2006; 103(3):p149–56. PMID:16582578
27. Debiec H, Nauta J, Coulet F, van der Burg M, Guigonis V, Schurmans T, et al. Role of truncating muta-tions in MME gene in fetomaternal alloimmunisation and antenatal glomerulopathies. Lancet. 2004; 364(9441):1252–9. PMID:15464186
28. Ronco P, Debiec H, Guigonis V. Mechanisms of disease: Alloimmunization in renal diseases. Nat Clin Pract Nephrol. 2006; 2(7):388–97. PMID:16932467
29. Kiss T, Fayet-Lebaron E, Jady BE. Box H/ACA small ribonucleoproteins. Mol Cell. 2010; 37(5):597– 606. doi:10.1016/j.molcel.2010.01.032PMID:20227365
30. Valach M, Burger G, Gray MW, Lang BF. Widespread occurrence of organelle genome-encoded 5S rRNAs including permuted molecules. Nucleic Acids Res. 2014; 42(22):13764–77. doi:10.1093/nar/
gku1266PMID:25429974
31. Bozaykut P, Sozen E, Kaga E, Ece A, Ozaltin E, Ek B, et al. The role of heat stress on the age related protein carbonylation. J Proteomics. 2013; 89:238–54. doi:10.1016/j.jprot.2013.06.025PMID:
23811050
32. Liu L, Dunn ST, Christakos S, Hanson-Painton O, Bourdeau JE. Calbindin-D28k gene expression in the developing mouse kidney. Kidney Int. 1993; 44(2):322–30. PMID:8377376
33. Suvakov S, Damjanovic T, Stefanovic A, Pekmezovic T, Savic-Radojevic A, Pljesa-Ercegovac M, et al. Glutathione S-transferase A1, M1, P1 and T1 null or low-activity genotypes are associated with enhanced oxidative damage among haemodialysis patients. Nephrol Dial Transplant. 2013; 28 (1):202–12. doi:10.1093/ndt/gfs369PMID:23034843
34. Li X, Tao H, Xie K, Ni Z, Yan Y, Wei K, et al. cAMP signaling prevents podocyte apoptosis via activation of protein kinase A and mitochondrial fusion. PLoS One. 2014; 9(3):e92003. doi:10.1371/journal.pone. 0092003PMID:24642777
35. Miyoshi K, Akazawa Y, Horiguchi T, Noma T. Localization of adenylate kinase 4 in mouse tissues. Acta Histochem Cytochem. 2009; 42(2):55–64. doi:10.1267/ahc.08012PMID:19492028