AMTD
7, 2259–2299, 2014GOME-2 total ozone and assimilation in
MACC
N. Hao et al.
Title Page
Abstract Introduction
Conclusions References
Tables Figures
◭ ◮
◭ ◮
Back Close
Full Screen / Esc
Printer-friendly Version Interactive Discussion
Discussion
P
a
per
|
D
iscussion
P
a
per
|
Discussion
P
a
per
|
Discuss
ion
P
a
per
|
Atmos. Meas. Tech. Discuss., 7, 2259–2299, 2014 www.atmos-meas-tech-discuss.net/7/2259/2014/ doi:10.5194/amtd-7-2259-2014
© Author(s) 2014. CC Attribution 3.0 License.
Atmospheric Measurement
Techniques
Open Access
Discussions
This discussion paper is/has been under review for the journal Atmospheric Measurement Techniques (AMT). Please refer to the corresponding final paper in AMT if available.
GOME-2 total ozone columns from
MetOp-A/MetOp-B and assimilation in the
MACC system
N. Hao1, M. E. Koukouli2, A. Inness3, P. Valks1, D. G. Loyola1, W. Zimmer1, D. S. Balis2, I. Zyrichidou2, M. Van Roozendael4, C. Lerot4, and R. J. D. Spurr5
1
Institut für Methodik der Fernerkundung (IMF), Deutsches Zentrum für Luft- und Raumfahrt (DLR), Oberpfaffenhofen, Germany
2
Laboratory of Atmospheric Physics, Aristotle University of Thessaloniki, Thessaloniki, Greece
3
ECMWF, Reading, UK
4
Belgian Institute for Space Aeronomy, Brussels, Belgium
5
RT Solutions, Inc., Cambridge, Massachusetts, USA
Received: 20 December 2013 – Accepted: 21 February 2014 – Published: 7 March 2014 Correspondence to: N. Hao ([email protected])
AMTD
7, 2259–2299, 2014GOME-2 total ozone and assimilation in
MACC
N. Hao et al.
Title Page
Abstract Introduction
Conclusions References
Tables Figures
◭ ◮
◭ ◮
Back Close
Full Screen / Esc
Printer-friendly Version Interactive Discussion
Discussion
P
a
per
|
D
iscussion
P
a
per
|
Discussion
P
a
per
|
Discuss
ion
P
a
per
|
Abstract
The two Global Ozone Monitoring Instrument (GOME-2) sensors operated in tandem are flying onboard EUMETSAT’s MetOp-A and MetOp-B satellites, launched in Oc-tober 2006 and September 2012 respectively. This paper presents the operational GOME-2/MetOp-A (GOME-2A) and GOME-2/MetOp-B (GOME-2B) total ozone prod-5
ucts provided by the EUMETSAT Satellite Application Facility on Ozone and Atmo-spheric Chemistry Monitoring (O3M-SAF). These products are generated using the latest version of the GOME Data Processor (GDP version 4.7). The enhancements in GDP 4.7, including the application of Brion–Daumont–Malicet ozone absorption cross-sections, are presented here. On a global scale, GOME-2B has the same high accuracy 10
as the corresponding GOME-2A products. There is an excellent agreement between the ozone total columns from the two sensors, with GOME-2B values slightly lower with a mean difference of only 0.55±0.29 %. First global validation results for 6 months of GOME-2B total ozone using ground-based measurements show that on average the GOME-2B total ozone data obtained with GDP 4.7 slightly overestimate Dobson 15
observations by about 2.0±1.0 % and Brewer observations by about 1.0±0.8 %. It is
concluded that the total ozone columns (TOCs) provided by GOME-2A and GOME-2B are consistent and may be used simultaneously without introducing trends or other sys-tematic effects. GOME-2A total ozone data have been used operationally in the Coper-nicus atmospheric service project MACC-II (Monitoring Atmospheric Composition and 20
Climate – Interim Implementation) near-real-time (NRT) system since October 2013. The magnitude of the bias correction needed for assimilating GOME-2A ozone is re-duced (to about−6 DU in the global mean) when the GOME-2 ozone retrieval algorithm
AMTD
7, 2259–2299, 2014GOME-2 total ozone and assimilation in
MACC
N. Hao et al.
Title Page
Abstract Introduction
Conclusions References
Tables Figures
◭ ◮
◭ ◮
Back Close
Full Screen / Esc
Printer-friendly Version Interactive Discussion
Discussion
P
a
per
|
D
iscussion
P
a
per
|
Discussion
P
a
per
|
Discuss
ion
P
a
per
|
1 Introduction
The Montreal Protocol and its amendments were designed to reduce the production and consumption of ozone depleting substances which will lead to a gradual recovery of the earth’s fragile ozone layer. However, the timing of full ozone recovery and the relation between the ozone layer and on-going climate change are still unclear.
5
The Global Ozone Monitoring Experiment-2 (GOME-2) instruments were launched onboard the EUMETSAT MetOp-A (October 2006) and MetOp-B (September 2012), re-spectively. MetOp-A and MetOp-B are flying on a sun-synchronous orbit with a repeat cycle of 29 days and an equator crossing time of 09:30 LT (descending mode). GOME-2 extends the long-term atmospheric composition measurements started by the ESA 10
missions GOME/ERS-2 (1995) and continued with SCIAMACHY/ENVISAT (2002). GOME-2 is a nadir-scanning UV-VIS spectrometer, covering the spectral range be-tween 240 and 790 nm with a relative high spectral resolution (Munro et al., 2006). The default swath width of the GOME-2 scan is 1920 km, which enables global coverage in about 1.5 days. GOME-2 ground pixels have a default footprint size of 80 km×40 km
15
which is four times smaller than those for GOME (320 km×40 km) but larger than those
for SCIAMACHY (30 km×60 km) and OMI (24 km×13 km at nadir). In the tandem mode,
GOME-2/Metop-A (hereafter GOME-2A) operates on a reduced swath with of 960 km with an increased spatial resolution (approx. 40 km×40 km) while GOME-2/Metop-B
(hereafter GOME-2B) operates on a nominal wide swath at 1920 km. This implementa-20
tion increases both the daily coverage and the spatial resolution of GOME-2 measure-ments. GOME-2 tandem operations started on 15 July 2013.
The ozone total columns from GOME-2A have been processed operationally by DLR using the GOME Data Processor (GDP) 4.4 algorithm as part of the EUMETSAT’s Satellite Application Facility on Ozone and Atmospheric Chemistry Monitoring (O3M-25
AMTD
7, 2259–2299, 2014GOME-2 total ozone and assimilation in
MACC
N. Hao et al.
Title Page
Abstract Introduction
Conclusions References
Tables Figures
◭ ◮
◭ ◮
Back Close
Full Screen / Esc
Printer-friendly Version Interactive Discussion
Discussion
P
a
per
|
D
iscussion
P
a
per
|
Discussion
P
a
per
|
Discuss
ion
P
a
per
|
correction to eliminate scan angle dependencies. Three years (2007–2009) of total ozone measurements from GOME-2A were validated using ground-based measure-ments (Loyola et al., 2011). The validation results show that in the tropics, GOME-2 data underestimate ground-based Dobson ozone by 0 to 2 %, while at middle latitudes the GOME-2 total ozone overestimate in the Southern Hemisphere and underestimate 5
ground-based measurements in the Northern Hemisphere by around 0.5 %. At the southern high latitudes, an underestimation of less than 1 % is observed, while at the northern high latitudes, a good comparison relative to the Dobson measurement is found. Koukouli et al. (2012) assessed five years (2007–2011) of GOME-2A total ozone columns through an inter-comparison with GOME/ERS-2, SCIAMACHY/ENVISAT, and 10
OMI/Aura ozone data by a validation with ground-based measurements. GOME-2 total ozone is about 0.8 %, 0.4 % and 1.3 % lower than GOME, SCIAMACHY, and OMI/DOAS data respectively and show no bias compared to OMI/TOMS data. These two studies show that the GOME-2 total ozone obtained with GDP 4.4 has good sta-bility and high accuracy within the ±1 % level, making it suitable for inclusion in the
15
satellite long-term global total ozone record. However, GDP 4.4 datasets have a gen-eral tendency to underestimate total ozone in comparison to reference ground-based measurements and other satellite measurements.
The operational GOME-2 total ozone columns from MetOp-A and MetOp-B are gen-erated at the German Aerospace Center (DLR) using the UPAS (Universal Proces-20
sor for UV/VIS Atmospheric Spectrometers) environment version 1.3.9, implementing the level-1-to-2 GDP 4.7 algorithm. On 15 July 2013, the operational dissemination of the GOME-2B near-real-time products including total ozone via EUMETCast started. GOME-2 level 2 near-real-time total column products from MetOp-A and MetOp-B are free available in less than two hours after sensing on an operational 24/7 basis. Details 25
AMTD
7, 2259–2299, 2014GOME-2 total ozone and assimilation in
MACC
N. Hao et al.
Title Page
Abstract Introduction
Conclusions References
Tables Figures
◭ ◮
◭ ◮
Back Close
Full Screen / Esc
Printer-friendly Version Interactive Discussion
Discussion
P
a
per
|
D
iscussion
P
a
per
|
Discussion
P
a
per
|
Discuss
ion
P
a
per
|
MACC, both in the following referred to as MACC) is the (pre)-operational atmospheric core service of the European Copernicus/GMES (Global Monitoring for Environment and Security) programme funded by Seventh Framework Programme of the European Union (Hollingsworth et al., 2008). The service combines a state-of-the art transport and chemistry model with satellite data from various sensors to provide consistent anal-5
yses of 3-dimensional fields of atmospheric composition including ozone. The MACC system is run routinely every day to provide near-real time (NRT) 5 day forecasts of at-mospheric composition and was used to produce a 10 year reanalysis of atat-mospheric composition data (Inness et al., 2013). GOME-2A data have been assimilated in the MACC NRT analysis since 7 October 2013.
10
In the following, we discuss the consistency between the GOME-2 total ozone columns from MetOp-A and MetOp-B, including an initial validation with ground-based total ozone measurements. In Sect. 2 we describe the new GDP 4.7 algorithm used for the operational processing of GOME-2 total ozone columns. In Sect. 3 we analyse the consistency between GOME-2A and GOME-2B total ozone columns. The valida-15
tion of GOME-2A and GOME-2B total ozone data and the use of GOME-2 total ozone columns in the MACC NRT system are discussed in Sects. 4 and 5 respectively. The paper ends with summary and conclusions.
2 GDP 4.7 total ozone algorithm
The operational GOME-2 total ozone products are generated using the GOME Data 20
Processor (GDP) version 4.7 which is the latest version of GDP 4 algorithm (Van Roozendael et al., 2006; Loyola et al., 2011). Trace gas retrievals are performed using the Differential Optical Absorption Spectroscopy (DOAS) algorithm.
The first algorithm component is the DOAS fitting (Platt and Stutz, 2008). The slant column fitting is based on Beer’s law for trace gas absorption, and includes a poly-25
AMTD
7, 2259–2299, 2014GOME-2 total ozone and assimilation in
MACC
N. Hao et al.
Title Page
Abstract Introduction
Conclusions References
Tables Figures
◭ ◮
◭ ◮
Back Close
Full Screen / Esc
Printer-friendly Version Interactive Discussion
Discussion
P
a
per
|
D
iscussion
P
a
per
|
Discussion
P
a
per
|
Discuss
ion
P
a
per
|
Sect. 2.1), a NO2absorption cross-section, wavelength registration for re-sampling the earthshine spectrum, and scaling factors for interference due to the Ring effect.
The next step is the computation of vertical column density (VCD) using an iterative air mass factor (AMF). The multiple scattering radiative transfer code LIDORT (Spurr, 2008) is used to calculate AMFs at 325.5 nm. Computation of the VCD proceeds itera-5
tively (the superscriptnindicates the iteration number) using the formula:
V(n+1)=
E
M(n)+ ΦG
(n)A(n) cloud
(1−Φ)A(clearn) + ΦA(cloudn)
, (1)
whereEis the DOAS-retrieved slant column,Φis the intensity-weighted cloud fraction, and M is the molecular Ring correction (Van Roozendael et al., 2006). G is ghost 10
column, given by formula:
G=Vbc(1+cacos(θ)−cos(θ)), (2)
where Vbc is the climatological ozone column below cloud top, ca the cloud albedo and θ the solar zenith angle (SZA). The A(n)
clear (the clear sky AMF) and A (n) cloud (the 15
AMF for the atmosphere down to the cloud-top level) and the ghost columnG(n) (the quantity of ozone below the cloud top height) depend on the value of V(n) at the nth iteration step. In this formulation,E reflects the true state of the atmosphere and acts as a constraint on the iteration. The iteration stops until the relative change inV is less than a prescribed small number (0.1 % is used in GDP 4.7). The cloud parameters 20
are retrieved from GOME-2 measurements using the OCRA and ROCINN algorithms (Loyola et al., 2007) and the ozone absorption inside and below the cloud is treated by the intra-cloud correction term, which is a function of the SZA and the cloud albedo (Loyola et al., 2011).
The algorithm improvements introduced in the GDP 4.7 are described in detail in 25
AMTD
7, 2259–2299, 2014GOME-2 total ozone and assimilation in
MACC
N. Hao et al.
Title Page
Abstract Introduction
Conclusions References
Tables Figures
◭ ◮
◭ ◮
Back Close
Full Screen / Esc
Printer-friendly Version Interactive Discussion
Discussion
P
a
per
|
D
iscussion
P
a
per
|
Discussion
P
a
per
|
Discuss
ion
P
a
per
|
2.1 Selection of ozone absorption cross sections
Ozone absorption cross sections are essential input reference data in the retrieval of total ozone and other trace gases from satellite and ground-based instruments (Lerot et al., 2009; Orphal et al., 2002, 2003). The uncertainty in the cross sections is an important source of retrieval error which can result in systematic biases of about±2 %
5
in the retrieved ozone columns (Van Roozendael et al., 2002; Weber et al., 2011). For total ozone retrieval from satellite instruments measuring in the UV wavelength range, flight model (FM) cross sections measured with the instrument spectrometer prior to launch are commonly used. The use of FM cross sections can improve the accuracy of the DOAS fit since knowledge of the exact shape of the instrument’s slit 10
function is not required. For this purpose, FM measurements of temperature dependent absorption cross sections were performed for the GOME-2A instrument during the on-ground instrument calibration period (Guer, 2006). However, systematic errors in the FM ozone cross sections for GOME-2A (released in 2006) resulted in relative large DOAS fit residuals and larger wavelength shifts (Weber et al., 2011). Therefore, in the 15
GDP 4.4, we used the GOME FM98 cross sections (Burrows et al., 1999) re-convolved with the GOME-2A slit function (Siddans et al., 2006), which provided consistent and stable results for GOME-2A (Loyola et al., 2011). Recently, improved FM ozone cross sections for GOME-2A were released, and the usage of a quadratic parameterisation of the FM cross sections was recommended for the retrieval of total ozone columns 20
from GOME-2A (Chehade et al., 2013).
The Brion–Daumont–Malicet (BDM) ozone cross sections (Daumont et al., 1992; Malicet et al., 1995; Brion et al., 1998) have been recorded at high spectral resolution and have been recommended for use in ozone retrievals from space-borne UV spec-trometer (Orphal et al., 2002). BDM dataset has been used in the ozone profile retrieval 25
AMTD
7, 2259–2299, 2014GOME-2 total ozone and assimilation in
MACC
N. Hao et al.
Title Page
Abstract Introduction
Conclusions References
Tables Figures
◭ ◮
◭ ◮
Back Close
Full Screen / Esc
Printer-friendly Version Interactive Discussion
Discussion
P
a
per
|
D
iscussion
P
a
per
|
Discussion
P
a
per
|
Discuss
ion
P
a
per
|
2013). In this section we analyse the use of the improved GOME-2 FM and the high resolution BDM ozone absorption cross sections for the retrieval of total ozone columns from GOME-2A and GOME-2B.
One difficulty in retrieving total ozone in the Huggins bands is the temperature de-pendence of the ozone cross sections. In the GDP, the temperature dede-pendence of the 5
cross sections is taken into account by fitting a linear combination of two ozone cross sections at different temperatures (Richter and Burrows, 2002; Van Roozendael et al., 2002; Spurr et al., 2005). It is assumed that the temperature dependent cross sections can be linearly expanded as follows:
σO
3(Teff)∼=σO3(T1)+
∆σO
3
T1−T2·(Teff−T1), (3)
10
where σO
3 is ozone cross section, Teff is the O3 absorption effective temperature,
∆σO
3=σO3(T1)−σO3(T2). The dependence is linear if we assume the temperature
derivative is constant throughout the limited range of stratospheric temperatures. We useσO
3(T1) and∆σO3as the reference spectra in the DOAS fitting. The O3slant column
15
(SCD) andTeff can be derived through the relations
τO
3 ∼=σ τ1
O3·E1+ ∆σO3·E2 (4)
Teff=T1+(T1−T2)·E1
E2 (5)
HereτO
3is the ozone slant optical density andE1the slant column density. As long as
20
the assumption of linear dependency in temperatures is satisfied, the retrieval should in principle be independent of the temperatures selected for use in the DOAS fitting procedure.
The respective behaviour of the GOME FM98 cross-sections re-convolved with the GOME-2A slit function (202 K, 221 K, 241 K, 273 K), the GOME-2A FM (203 K, 223 K, 25
AMTD
7, 2259–2299, 2014GOME-2 total ozone and assimilation in
MACC
N. Hao et al.
Title Page
Abstract Introduction
Conclusions References
Tables Figures
◭ ◮
◭ ◮
Back Close
Full Screen / Esc
Printer-friendly Version Interactive Discussion
Discussion
P
a
per
|
D
iscussion
P
a
per
|
Discussion
P
a
per
|
Discuss
ion
P
a
per
|
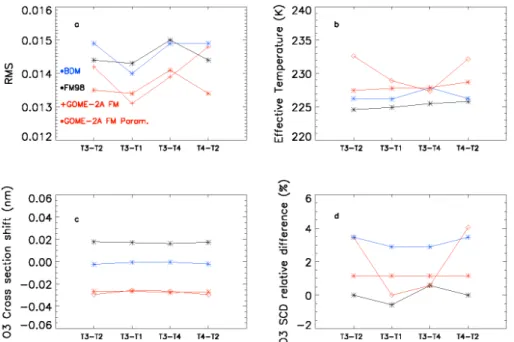
243 K, 273 K) cross-section datasets are analysed. The DOAS fit results for GOME-2A have been analysed using the root mean squares (RMS) of fit residuals, the change in O3 slant column relative to the column obtained using GOME FM98 cross sections at 241 K and 221 K (baseline GDP 4.4 settings), the retrieved effective temperature and the wavelength shift applied to the O3 cross-sections (see Fig. 1). Results obtained 5
with the GOME FM98 and BDM cross sections show stability in the sense that the val-ues retrieved for each test parameter are independent of the selected temperatures of cross sections for processing. In contrast, results obtained with the GOME-2 FM ozone cross sections (unparameterized) show a much larger variability. Difference in O3slant columns as large as 4 % can be obtained depending on the combination of cross sec-10
tions selected for retrieval, mostly as a result of the instability of the derived temperature (see Fig. 1b and d). If the GOME-2 FM quadratic parameterisation is used instead of the individual FM cross sections, the scatter in the results is significantly decreased be-cause quadratic parameterisation can reduce the impact from inaccurate cross section data at one temperature (Chehade et al., 2013). As shown in Fig. 1d, the total ozone 15
column densities retrieved using parameterized GOME-2 FM cross-sections are about 1 % larger than the GDP 4.4 ozone columns obtained with the GOME FM98 cross-sections. These results are consistent with similar analysis of GOME-2A total ozone retrieval using the WFDOAS method (Chehade et al., 2013). Considering stability and the fit residuals, the parameterized GOME-2A FM cross sections at 243◦and 223 K or
20
the BDM cross-sections at 243◦and 218 K are good options for use in GOME-2A total ozone retrieval (see Fig. 1a).
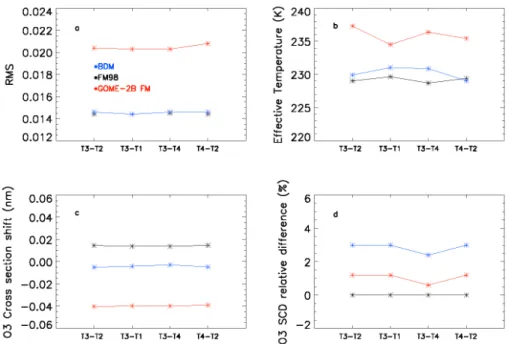
Analyses of the total ozone columns retrieval from GOME-2B have also been per-formed using GOME FM98 re-convolved with the GOME-2B slit function (Siddans et al., 2012), GOME-2B FM cross-sections (Guer, 2006), and the BDM cross-sections. As 25
AMTD
7, 2259–2299, 2014GOME-2 total ozone and assimilation in
MACC
N. Hao et al.
Title Page
Abstract Introduction
Conclusions References
Tables Figures
◭ ◮
◭ ◮
Back Close
Full Screen / Esc
Printer-friendly Version Interactive Discussion
Discussion
P
a
per
|
D
iscussion
P
a
per
|
Discussion
P
a
per
|
Discuss
ion
P
a
per
|
FM cross-sections will not be used in the GDP before improved GOME-2B FM ozone cross-sections are available.
The use of the BDM dataset has been recommended for ozone retrieval in the Hug-gins bands (Orphal et al., 2002). The BDM dataset can significantly reduce fit residu-als, and lead to smaller biases and standard deviation between GOME ozone profiles 5
and ozonesonde measurements, than when using the GOME FM cross-sections (Liu et al., 2007). Also, the temperature dependence of the BDM dataset appears to be reliable because the retrieved effective temperatures are generally in good agreement with effective temperatures derived from ECMWF model data (Van Roozendael et al., 2012). In addition, usage of the BDM dataset produces high quality fits and presents 10
accurate wavelength calibration (see Figs. 1 and 2). The GOME-2 ozone slant column densities retrieved using the BDM dataset are about 2–3 % larger than the ones re-trieved using GOME FM98 cross sections. As described in the introduction, validation results (Balis et al., 2009; Loyola et al., 2011; Koukouli et al., 2012) show that in general GOME-2A ozone columns retrieved using GOME FM98 ozone cross sections (GDP 4.4 15
data) underestimate ground-based measurements and other satellite measurements. Therefore, BDM absorption ozone cross sections have been selected for use in the GOME-2 total ozone retrieval with the GDP 4.7. To that end, the high resolution BDM cross sections (at 243 K and 218 K) are pre-convolved with the 2A and GOME-2B pre-flight slit functions (Siddans et al., 2006, 2012) and a solarI0 correction (Van 20
Roozendael et al., 2006) has been applied.
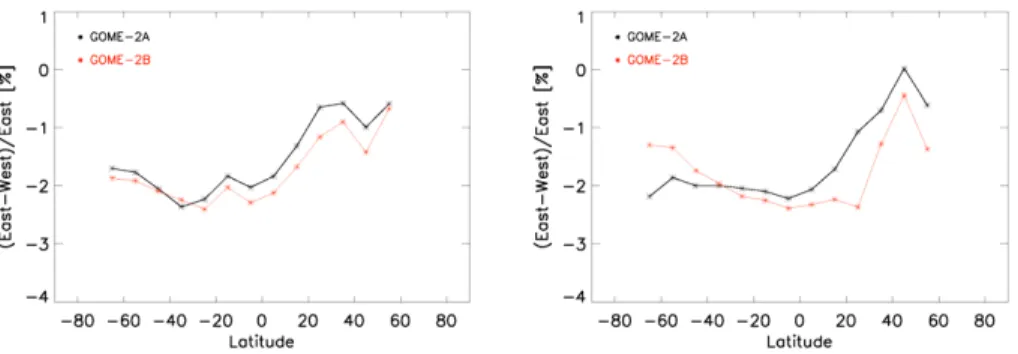
2.2 Correction for GOME-2 total ozone scan angle dependency
The GOME-2A vertical ozone columns show a significant scan angle dependency (An-tón et al., 2009; Loyola et al., 2011) with a bias of about 1.5–2 % between ozone columns for the West and East ground pixels (West: positive scan angle, East: neg-25
AMTD
7, 2259–2299, 2014GOME-2 total ozone and assimilation in
MACC
N. Hao et al.
Title Page
Abstract Introduction
Conclusions References
Tables Figures
◭ ◮
◭ ◮
Back Close
Full Screen / Esc
Printer-friendly Version Interactive Discussion
Discussion
P
a
per
|
D
iscussion
P
a
per
|
Discussion
P
a
per
|
Discuss
ion
P
a
per
|
scattering angle, but it also depends on the latitude and SZA, and it varies from month to month. This dependency might be partly attributed to possible remaining calibration issues in the GOME-2 level-1 product.
In the GDP 4.7, we use an empirical correction for the scan angle dependency to remove this bias in the ozone columns. Considering the similar pattern of scan angle 5
dependency for GOME-2A and GOME-2B (as shown in Fig. 3) and the short time period of the GOME-2B datasets, we used two full years GOME-2A data from the start of the mission (2007 and 2008) to calculate latitudinal monthly means ozone columns for every forward scan angle position. The mean ozone column for the four center scan angle positions (absolute scan angle<10◦) is selected as reference. In the end, 10
a polynomial is fitted to the normalized measurements in order to remove outliers and to obtain a smoother correction function. Figure 4 presents the scan angle corrections for January and July. The effect of the empirical correction on GOME-2 total ozone columns is discussed in Sect. 3.2.
2.3 GOME-2A and GOME-2B measurements of the 2013 Antarctic ozone hole 15
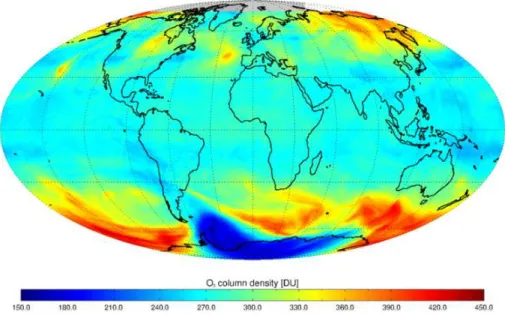
Figure 5 shows the total ozone column from GOME-2A and GOME-2B for 18 Octo-ber 2013, as retrieved with the GDP 4.7 algorithm described above. This figure illus-trates the capacity of the GOME-2 instruments to provide homogeneous total ozone data with full daily global coverage, and shows important features such as the Antarc-tic ozone hole and characterisAntarc-tics of the polar vortex. The 2013 AntarcAntarc-tic ozone hole 20
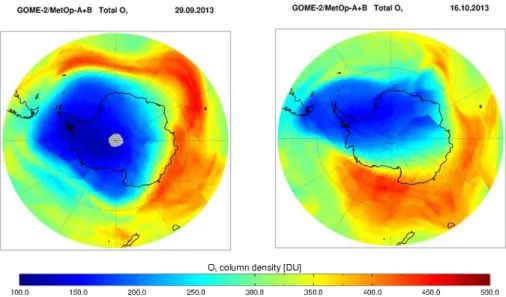
began to form in the middle of August, reaching a maximum of 24.0 million km2which is larger than the ozone holes in 2012 and 2010, but smaller than that for 2011, according to the World Meteorological Organization (WMO) Antarctic Ozone Bulletin (http://www. wmo.int/pages/prog/arep/WMOAntarcticOzoneBulletins2013.html). Figure 6 shows the Antarctic ozone hole for 29 September and 16 October measured from GOME-2A 25
AMTD
7, 2259–2299, 2014GOME-2 total ozone and assimilation in
MACC
N. Hao et al.
Title Page
Abstract Introduction
Conclusions References
Tables Figures
◭ ◮
◭ ◮
Back Close
Full Screen / Esc
Printer-friendly Version Interactive Discussion
Discussion
P
a
per
|
D
iscussion
P
a
per
|
Discussion
P
a
per
|
Discuss
ion
P
a
per
|
ozone hole briefly touched the southern tip of the South America continent and af-fected inhabited places such as Ushuaia and Río Gallegos on 16 October 2013.
3 Inter-comparison between GOME-2A and GOME-2B total ozone columns
3.1 Effect of instrument degradation and slit function
GOME-2A has suffered from instrumental degradation for a number of years (Dikty 5
and Richter, 2011) and the reason for this degradation has not yet been fully identi-fied. The degradation rates for GOME-2B are similar as for GOME-2A (see http://www. eumetsat.int/website/home/TechnicalBulletins/GOME2/index.html). Instrument degra-dation can affect DOAS retrievals in different ways like loss of signals and differential changes between the measured GOME-2 earthshine and irradiance spectra. Studies 10
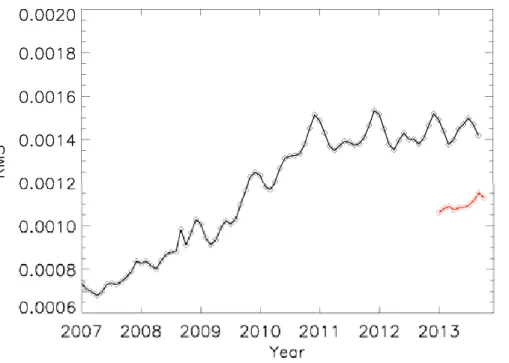
of instrument degradation and its impacts on Level 2 data can be found in Lacan and Lang (2011) and Dikty and Richter (2011). As shown in Fig. 7, monthly averaged resid-uals for both GOME-2A and GOME-2B have been calculated for the clean Equatorial Pacific region (10◦S–10◦N, 160◦E–160◦W). This figure illustrates the increase in the GOME-2A DOAS fit residuals as a function of time. The fit residuals increased by about 15
100 % in the first four years of GOME-2A measurements. After June 2010, fit residuals did not increase anymore. The possible reason is that after a instrument throughput test (Lacan and Lang, 2011) carried out in September 2009 the rate of degradation has significantly slowed down (Dikty and Richter, 2011). Figure 7 also shows the in-crease in the GOME-2B ozone fit residuals as a function of time, and that the inin-crease 20
rate of fit residuals for GOME-2B is similar to those for GOME-2A at the beginning of operations in early 2007. However, although the fit residuals of GOME-2B are much smaller than those of GOME-2A in 2013, they are higher than those of GOME-2A in the early 2007.
The width of the GOME-2 slit function has been narrowing with time (Lacan and 25
AMTD
7, 2259–2299, 2014GOME-2 total ozone and assimilation in
MACC
N. Hao et al.
Title Page
Abstract Introduction
Conclusions References
Tables Figures
◭ ◮
◭ ◮
Back Close
Full Screen / Esc
Printer-friendly Version Interactive Discussion
Discussion
P
a
per
|
D
iscussion
P
a
per
|
Discussion
P
a
per
|
Discuss
ion
P
a
per
|
2013) have shown that using a fitted asymmetric Gaussian slit function in GOME-2 retrievals of formaldehyde allows for a reduction of the fit residuals by about 18 % com-pared to using the pre-flight slit function (Siddans et al., 2006). To study the impact of the slit function on O3 retrievals, effective slit functions have been derived from mea-sured solar irradiance spectra by adjustment to the high resolution solar reference of 5
Chance and Kurucz (2010) and assuming an asymmetric Gaussian shape. For GOME-2B, fit residuals are reduced by about 12 % when using an asymmetric Gaussian slit function, as opposed to the pre-flight slit function. Here, it should be noted that at the beginning of GOME-2A operations in 2007, no significant reduction of DOAS fit residu-als is found when we did the same test. This indicates that unresolved issues may exist 10
in the characterization of the GOME-2B slit function. However, the ozone fit residuals for GOME-2B are still about 25 % larger than those of GOME-2A at launch time (2007) even when using the fitted slit function. The reasons are not clear yet and will be the subject of future research. In GDP 4.7, the pre-flight slit function is used to maintain the consistency between GOME-2A and GOME-2B total ozone retrievals.
15
3.2 Inter-comparisons of vertical column densities
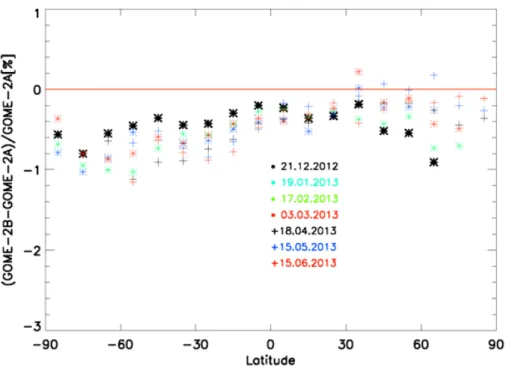
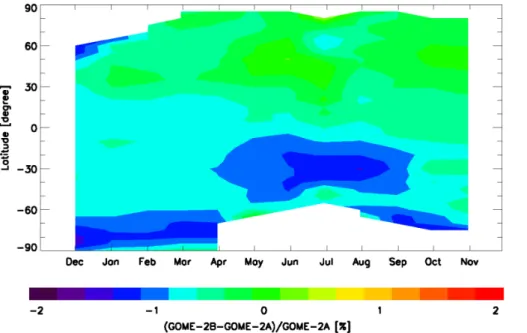
A statistical analysis of GOME-2A and GOME-2B data has been performed with re-spect to time, latitude, and other parameters. The difference of collocated ozone ver-tical column densities (based on daily gridded data) from GOME-2B and GOME-2A is displayed in Fig. 8 for seven different days during the period December 2012 to 20
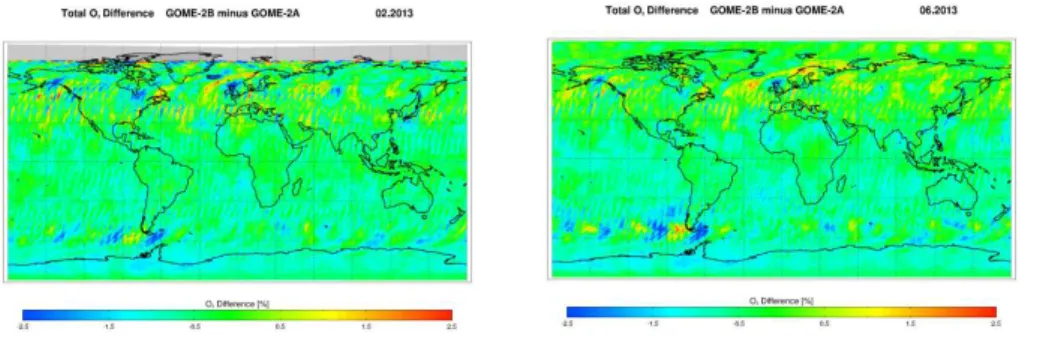
June 2013. A good agreement between GOME-2A and GOME-2B ozone columns is observed and the difference is within 1 % for all latitudes. As shown in Fig. 9, the monthly average differences of ozone columns from GOME-2A and GOME-2B (Febru-ary and June 2013) are smaller than 1 %. Relative larger differences in high latitudes are related to low statistics in combination with strong natural ozone variations. Fig-25
AMTD
7, 2259–2299, 2014GOME-2 total ozone and assimilation in
MACC
N. Hao et al.
Title Page
Abstract Introduction
Conclusions References
Tables Figures
◭ ◮
◭ ◮
Back Close
Full Screen / Esc
Printer-friendly Version Interactive Discussion
Discussion
P
a
per
|
D
iscussion
P
a
per
|
Discussion
P
a
per
|
Discuss
ion
P
a
per
|
than GOME-2A with larger differences (up to 1.5 %) at high latitudes. Part of this dif-ference is probably related to the different sampling of GOME-2A and GOME-2B over one month (low statistics), and to partially corrected scan angle dependency.
In Fig. 11 the relative difference between the GOME-2A and GOME-2B total ozone columns as a function of total ozone columns (left panel) and SZA (right panel) is 5
plotted. This figure shows that the differences do not depend on the total ozone column (GOME-2B underestimates total ozone by about 0.5 % for all total column values). However, there is some SZA dependency in the bias between 2A and GOME-2B total ozone. For low SZAs, the bias is small, but the difference between the GOME-2A and GOME-2B ozone columns increases with increasing SZA to about 0.5 % at 10
a SZA of∼40◦, with no further SZA dependency for larger SZAs.
In Fig. 12 the scan angle dependence is shown for the GOME-2B data set without and with the application of the empirical correction (see Sect. 2.2) for three different latitude regions. The east-west bias for the GOME-2B GDP 4.7 data set is reduced from−1.60 % to −0.42 % (all latitudes), from −1.64 % to −0.12 % (tropics) and from
15
−0.97 % to 0.16 % (mid-latitudes) by using the empirical correction.
4 Initial ground-based validation
Ever since the first satellite-based total ozone observations became a reality, extensive validation activities were carried out using well-known and dependable ground-based total ozone column (TOC) measurements. Total ozone data from the first Total Ozone 20
Mapping Spectrometer (TOMS) have been validated using a suite of publicly avail-able TOC measurements by Dobson spectrophotometers (Bojkov et al., 1988) whereas these comparisons have been continuously-updated using a selection of both Brewer and Dobson measurements (Balis et al., 2007a; Antón et al., 2010). OMI/Aura TOC extracted from two different analysis algorithms were compared to ground-based mea-25
AMTD
7, 2259–2299, 2014GOME-2 total ozone and assimilation in
MACC
N. Hao et al.
Title Page
Abstract Introduction
Conclusions References
Tables Figures
◭ ◮
◭ ◮
Back Close
Full Screen / Esc
Printer-friendly Version Interactive Discussion
Discussion
P
a
per
|
D
iscussion
P
a
per
|
Discussion
P
a
per
|
Discuss
ion
P
a
per
|
instruments to ensure the qualitative continuation of the global total ozone column record. The GOME-2A record has been extensively evaluated against a suite of Brewer and Dobson spectrophotometers in both Loyola et al. (2011) and Koukouli et al. (2012). Most recently, the same ground-based measurements were examined against the new version of the Solar Backscatter Ultraviolet Instrument (SBUV) zonal mean total ozone 5
columns record (Labow et al., 2013).
The publicly available Brewer and Dobson spectrophotometer archived total ozone column measurements used as ground-truth in this paper, as well as those mentioned above, reside at the World Ozone and Ultraviolet Radiation Data Centre (WOUDC) in Toronto, Canada (http://www.woudc.org), as part of the World Meteorological Organi-10
zation (WMO)-Global Atmosphere Watch (GAW) network. In terms of coverage, using carefully selected instruments from both the Dobson and Brewer network a wide ge-ographical region can be covered on a global scale, with improved coverage over the Northern Hemisphere than the southern and naturally no coverage over the sea. As for the accuracy of the ground-based measurements, Dobson and Brewer data can 15
agree within 1 % when the major sources of discrepancy are properly accounted for (Van Roozendael et al., 1998). Staehelin et al., 2003, have also shown that small dif-ferences of around ±0.6 % might be observed between the two types of instrument,
due to the use of different observational wavelengths and different temperature de-pendence for the ozone absorption coefficients. In particular, whereas the error of an 20
individual well-calibrated Brewer instrument might be about 1 % (Kerr et al., 1988), Dobson instruments are known to suffer from a temperature dependence of the ozone absorption coefficients used in the algorithm which might account for a seasonal varia-tion of±1.0 % in the middle latitudes and±2.0 % in the Arctic and for systematic errors
of up to 4 % (Bernhard et al., 2005) depending on the instrument examined. 25
AMTD
7, 2259–2299, 2014GOME-2 total ozone and assimilation in
MACC
N. Hao et al.
Title Page
Abstract Introduction
Conclusions References
Tables Figures
◭ ◮
◭ ◮
Back Close
Full Screen / Esc
Printer-friendly Version Interactive Discussion
Discussion
P
a
per
|
D
iscussion
P
a
per
|
Discussion
P
a
per
|
Discuss
ion
P
a
per
|
(left panel) and the Dobson (right panel) instruments. In order to show the stability and natural ozone variability during the GOME-2A mission, the time series begins in January 2007. However, the relative differences during the months of December 2012 to June 2013 are only calculated for the common pixels of GOME-2A and GOME-2B. Worthy of note in both panels, for both the GOME-2A and GOME-2B GDP 4.7 ozone 5
record, is the positive offset between ground and satellite TOC, slightly larger for the Dobson case at 2±1 % (right) than the Brewer case at 1±0.8 % (left). Furthermore,
a clear annual variability in the total ozone bias can be observed, which introduces a peak-to-peak difference of around 1±1–1.5 % in relative terms. For the six common months of observations of the two GOME2 instruments, the agreement is near perfect. 10
Some statistics of the differences between GOME-2A and GOME-2B using the Dob-son network as background TOC truth are presented in the histogram representation of the daily percentage differences shown in Fig. 14. In the left panel, the GOME-2A differences present an almost Gaussian curve peaking around 1.8±3.9 % with a small increased bump in the negative values. In the right panel, the GOME-2B differences 15
are free from this bump and show a mean difference of 1.5±3.7 % for the 754 common points with the GOME-2A TOC dataset. These results are quite consistent with the 0.55±0.29 % mean global difference between GOME-2A and GOME-2B discussed in
Sect. 3.2 above.
From the intercomparison exercise (Sect. 3) and the initial ground-based validation 20
for the first six months of the GOME-2B life time, it can be concluded that the TOCs retrieved with the GDP 4.7 algorithm for the two GOME-2 instruments are consistent. This is especially important for the tandem operation of the GOME-2A and GOME-2B instruments.
5 Application of GOME-2A total ozone columns in MACC 25
AMTD
7, 2259–2299, 2014GOME-2 total ozone and assimilation in
MACC
N. Hao et al.
Title Page
Abstract Introduction
Conclusions References
Tables Figures
◭ ◮
◭ ◮
Back Close
Full Screen / Esc
Printer-friendly Version Interactive Discussion
Discussion
P
a
per
|
D
iscussion
P
a
per
|
Discussion
P
a
per
|
Discuss
ion
P
a
per
|
truncation, corresponding to a reduced Gaussian grid (Hortal and Simmons, 1991) of about 80 km horizontal resolution. The vertical coordinate system is given by 60 hybrid sigma-pressure levels, with a model top at 0.1 hPa. The global fields serve as boundary conditions for an ensemble of European air quality models that provide higher resolu-tion air quality forecasts. GOME-2A data are one of the ozone data sets assimilated 5
in the current MACC NRT system, to provide an ozone analysis from which to start the subsequent 5 day forecasts. The other ozone retrievals used in the MACC NRT system are MLS ozone profiles (Waters et al., 2006; Livesey et al., 2011), OMI total columns (Bhartia et al., 2002; Levelt et al., 2006), and SBUV/2 ozone layers (Bhartia et al., 1996) from NOAA-16 and NOAA-19.
10
GOME-2 total ozone column data have been used in the MACC NRT system since 7 October 2013. Before this time the GOME-2 data were monitored passively and tested in offline assimilation experiments. “Monitoring” means that the data are included in the MACC system and first-guess and analysis departures of the data are calculated, but that the data are not used actively in the assimilation and have no impact on the ozone 15
analysis. This procedure allows one to assess the quality of the data, the stability of the data provision, and to establish if there are biases between the data and the model, or between data from different instruments. If the quality of the monitored data is good and the data delivery is reliable, assimilation tests are performed in parallel to the oper-ational MACC NRT analysis. If these assimilation tests are successful the data can be 20
routinely assimilated in the MACC NRT analysis. Figure 15 shows this progression from monitoring to assimilation for GOME-2A TOC data. The top panel shows time series of first-guess and analysis departures for the period 1 February to 30 September 2013 from the MACC NRT analysis which included the GOME-2A TOC data passively at that time. The middle panel shows the same fields for an experiment in which the data 25
AMTD
7, 2259–2299, 2014GOME-2 total ozone and assimilation in
MACC
N. Hao et al.
Title Page
Abstract Introduction
Conclusions References
Tables Figures
◭ ◮
◭ ◮
Back Close
Full Screen / Esc
Printer-friendly Version Interactive Discussion
Discussion
P
a
per
|
D
iscussion
P
a
per
|
Discussion
P
a
per
|
Discuss
ion
P
a
per
|
because GDP 4.7 data agree better with the MACC ozone field than GDP previous ver-sion. At the same time the number of observations that was monitored was reduced. This reduction was a result of a pre-screening that thins to 0.5◦×0.5◦ and is applied
to the data in the MACC system to avoid oversampling and horizontally correlated ob-servation errors. Because the data in half width swath mode are closer together, more 5
data were now removed by the pre- screening. Apart from these changes the GOME-2 departures were stable. The middle panel shows that when GOME-2 ozone data are assimilated departures and their standard deviation are reduced. The variational bias correction (Dee, 2004; Inness et al., 2013) applied to the data (black curve) absorbs the changes seen in the passive monitoring plot and first-guess and analysis depar-10
tures were stable as the data were assimilated successfully. After the version change in July 2013 the magnitude of the bias correction was reduced (to about−6 DU in the
global mean) because the data now agreed better with the analysis. The magnitude of the bias correction after the version change is similar to that applied to OMI TOC data (not shown). The long term perspective of a succession of GOME-2 instruments made 15
it desirable to include this instrument in the MACC NRT analysis.
6 Summary and conclusions
We have described the current operational total ozone retrieval algorithms for GOME-2A and GOME-2B, as implemented in the GOME Data Processor (GDP) version 4.7. Algorithm enhancements were introduced in GDP 4.7 including the usage of the BDM 20
ozone cross sections and an empirical correction to minimize the total ozone columns dependencies on scan angle.
The consistency between GOME-2A and GOME-2B has been investigated using DOAS fit residuals and the retrieved total ozone columns. The GOME-2B ozone fit residuals are much smaller than those of GOME-2A in 2013, but about 40 % higher 25
AMTD
7, 2259–2299, 2014GOME-2 total ozone and assimilation in
MACC
N. Hao et al.
Title Page
Abstract Introduction
Conclusions References
Tables Figures
◭ ◮
◭ ◮
Back Close
Full Screen / Esc
Printer-friendly Version Interactive Discussion
Discussion
P
a
per
|
D
iscussion
P
a
per
|
Discussion
P
a
per
|
Discuss
ion
P
a
per
|
slit function rather than the pre-flight slit function. This indicates that remaining issues may exist in the characterization of the GOME-2B slit function. The known bias be-tween the GOME-2A ozone columns for the East and West ground-pixels (West being higher than East) was also seen in the GOME-2B ozone columns and has been largely eliminated with an empirical correction based on a statistical approach. On a global 5
scale, GOME-2B is providing smaller total ozone columns by about 0.55±0.29 %
com-pared to GOME-2A. Part of this difference is probably related to the different sampling of GOME-2A and GOME-2B, strong natural ozone variations, and not fully corrected scan angle dependency.
The first global validation results for the first six months of GOME-2B total ozone 10
measurements, using ground-based measurements were presented. The average rel-ative difference between GOME-2A TOC and Dobson observations is 1.8±3.9 % for the 754 observations with the GOME-2A TOC dataset and 1.5 ± 3.7 % for the GOME-2B
dataset. Even though only six months of data have been analyzed so far, the TOCs pro-vided by the GOME-2A and GOME-2B are consistent and may be used simultaneously 15
without introducing trends or other systematic effects.
The GOME-2A total ozone data have been assimilated in the MACC NRT analysis since 7 October 2013 to provide an ozone analysis from which to start 5 day forecasts. The data are stable and have similar global mean biases to OMI TOC data that are also assimilated in the MACC NRT system. The good quality of the data and the prospect 20
of a long term GOME-2 TOC data record (at least until 2020) made it desirable to include this instrument in the MACC NRT analysis. Monitoring and assimilation tests of GOME-2B total ozone data in the MACC system will start soon.
The O3MSAF operational GOME-2B total ozone products (starting from Decem-ber 2012) are generated by DLR. Total ozone generated with the GDP 4.7 is shown to 25
AMTD
7, 2259–2299, 2014GOME-2 total ozone and assimilation in
MACC
N. Hao et al.
Title Page
Abstract Introduction
Conclusions References
Tables Figures
◭ ◮
◭ ◮
Back Close
Full Screen / Esc
Printer-friendly Version Interactive Discussion
Discussion
P
a
per
|
D
iscussion
P
a
per
|
Discussion
P
a
per
|
Discuss
ion
P
a
per
|
in Valks et al. (2011). Results of the GOME-2 total ozone validation can be found at http://lap.physics.auth.gr/eumetsat/totalozone.
Acknowledgements. Development of the GOME-2 total ozone products and their validation has been funded by the O3M-SAF project with EUMETSAT and national contributions. The authors thank DFD colleagues S. Kiemle, K. H. Seitz, T. Padsuren and M. Schwinger who are
5
responsible for day-to-day operations of the O3M-SAF facility at DLR. We thank EUMETSAT for the ground segment interfacing work with the O3M-SAF systems and for the provision of GOME-2 Level 1 products. The authors would like to thank the ESA-MOST Dragon 3 Cooperation Project (ID: 10455). The Belgian national contribution was provided by the PRODEX A3C project. Ground-based measurements used in this work were taken from the
10
World Ozone and Ultraviolet Data Centre (WOUDC, http://www.woudc.org). MACC-II was funded by the European Commission under the EU Seventh Research Framework Programme, grant number 283576.
The service charges for this open access publication
15
have been covered by a Research Centre of the Helmholtz Association.
References
Antón, M., Loyola, D., López, M., Vilaplana, J. M., Bañón, M., Zimmer, W., and Serrano, A.: Comparison of GOME-2/MetOp total ozone data with Brewer spectroradiometer data over
20
the Iberian Peninsula, Ann. Geophys., 27, 1377–1386, doi:10.5194/angeo-27-1377-2009, 2009.
Antón, M., Koukouli, M. E., Kroon, M., McPeters, R. D., Labow, G. J., Balis, D., and Serrano, A.: Global validation of empirically corrected EP-Total Ozone Mapping Spectrometer (TOMS) total ozone columns using Brewer and Dobson ground-based measurements, J. Geophys.
25
Res., 115, D19305, doi:10.1029/2010JD014178, 2010.
com-AMTD
7, 2259–2299, 2014GOME-2 total ozone and assimilation in
MACC
N. Hao et al.
Title Page
Abstract Introduction
Conclusions References
Tables Figures
◭ ◮
◭ ◮
Back Close
Full Screen / Esc
Printer-friendly Version Interactive Discussion
Discussion
P
a
per
|
D
iscussion
P
a
per
|
Discussion
P
a
per
|
Discuss
ion
P
a
per
|
parisons with TOMS V7/V8, J. Geophys. Res., 112, D07307, doi:10.1029/2005JD006376, 2007a.
Balis, D., Kroon, M., Koukouli, M. E., Brinksma, E. J., Labow, G., Veefkind, J. P., and McPeters, R. D.: Validation of Ozone Monitoring Instrument total ozone column measure-ments using Brewer and Dobson spectrophotometer ground-based observations, J.
Geo-5
phys. Res., 112, D24S46, doi:10.1029/2007JD008796, 2007b.
Balis, D., Koukouli, M., Loyola, D., Valks, P., and Hao, N.: Validation Report of GOME-2 To-tal Ozone Products (OTO/O3, NTO/O3) Processed with GDP 4.2, SAF/O3M/AUTH/GOME-2VAL/RP/03, 2009.
Bernhard, G., Evans, R. D., Labow, G. J., and Oltmans, S. J.: Bias in Dobson total ozone
mea-10
surements at high latitudes due to approximations in calculations of ozone absorption coef-ficients and air mass, J. Geophys. Res., 110, D10305, doi:10.1029/2004JD005559, 2005. Bhartia, P. K. and Wellemeyer, C.: TOMS-V8 total O3algorithm, in: OMI Ozone Product ATBD
Volume II, NASA Goddard Space Flight Center, Greenbelt, MD, USA, 2002.
Bhartia, P. K., McPeters, R. D., Mateer, C. L., Flynn, L. E., and Wellemeyer, C.: Algorithm for the
15
estimation of vertical ozone profiles from the backscattered ultraviolet technique, J. Geophys. Res., 101, 18793–18806, 1996.
Bhartia, P. K., McPeters, R. D., Flynn, L. E., Taylor, S., Kramarova, N. A., Frith, S., Fisher, B., and DeLand, M.: Solar Backscatter UV (SBUV) total ozone and profile algorithm, Atmos. Meas. Tech., 6, 2533–2548, doi:10.5194/amt-6-2533-2013, 2013.
20
Bojkov, R. D., Mateer, C., and Hanson, A.: Comparison of ground-based and total ozone map-ping spectrometer measurements used in assessing the performance of the global ozone observing system, J. Geophys. Res., 93, 9525–9533, doi:10.1029/JD093iD08p09525, 1988. Brion, J., Chakir, A., Charbonnier, J., Daumont, D., Parisse, C., and Malicet, J.: Absorption
spectra measurements for the ozone molecule in the 350–830 nm region, J. Atmos. Chem.,
25
30, 291–299, 1998.
Burrows, J., Richter, A., Dehn, A., Deters, B., Himmelmann, S., Voigt, S., and Orphal, J.: Atmo-spheric remote sensing reference data from GOME: Part 2. Temperature-dependent absorp-tion cross-secabsorp-tions of O3in the 231–794 nm range, J. Quant. Spectrosc. Ra., 61, 509–517, 1999.
30
AMTD
7, 2259–2299, 2014GOME-2 total ozone and assimilation in
MACC
N. Hao et al.
Title Page
Abstract Introduction
Conclusions References
Tables Figures
◭ ◮
◭ ◮
Back Close
Full Screen / Esc
Printer-friendly Version Interactive Discussion
Discussion
P
a
per
|
D
iscussion
P
a
per
|
Discussion
P
a
per
|
Discuss
ion
P
a
per
|
Chehade, W., Gür, B., Spietz, P., Gorshelev, V., Serdyuchenko, A., Burrows, J. P., and We-ber, M.: Temperature dependent ozone absorption cross section spectra measured with the GOME-2 FM3 spectrometer and first application in satellite retrievals, Atmos. Meas. Tech., 6, 1623–1632, doi:10.5194/amt-6-1623-2013, 2013.
Daumont, D., Brion, J., Charbonnier, J., and Malicet, J.: Ozone UV spectroscopy I: absorption
5
cross-sections at room temperature, J. Atmos. Chem., 15, 145–155, 1992.
Dee, D. P.: Variational bias correction of radiance data in the ECMWF system, in: Proceedings of the ECMWF Workshop on Assimilation of High Spectral Resolution Sounders in NWP, Reading, UK, 28 June–1 July 2004, 97–112, 2004.
De Smedt, I., Van Roozendael, M., Stavrakou, T., Müller, J.-F., Lerot, C., Theys, N., Valks, P.,
10
Hao, N., and van der A, R.: Improved retrieval of global tropospheric formaldehyde columns from GOME-2/MetOp-A addressing noise reduction and instrumental degradation issues, Atmos. Meas. Tech., 5, 2933–2949, doi:10.5194/amt-5-2933-2012, 2012.
De Smedt, I., Pinardi, G., Van Roozendael, M., Hao, N., and Valks, P.: O3MSAF ORR Validation Report, SAF/O3M/IASB/VR/HCHO/13, 2013.
15
Dikty, S. and Richter, A.: GOME-2 on MetOp-A Support for Analysis of GOME-2 In-Orbit Degra-dation and Impacts on Level 2 Data Products, Final Report, Version 1.2, 2011.
Guer, B.: Temperature Dependent Absorption Cross-Sections of O3and NO2in the 240–790 nm Range Determined by Using the GOME-2 Satellite Spectrometers for Use in Remote Sens-ing Applications, Ph. D. thesis, University of Bremen, 2006.
20
Hollingsworth, A., Engelen, R. J., Textor, C., Benedetti, A., Boucher, O. , Chevallier, F., De-thof, A., Elbern, H., Eskes, H., Flemming, J., Granier, C., Kaiser, J. W., Morcrette, J.-J., Rayner, P., Peuch, V.-H., Rouil, L., Schultz, M. G., Simmons, A. J.-J., and the GEMS Consortium: : The GEMS Consortium: toward a monitoring and forecasting system for atmospheric composition: the GEMS project, B. Am. Meteorol. Soc., 89, 1147–1164,
25
doi:10.1175/2008BAMS2355.1, 2008.
Hortal, M. and Simmons, A. J.: Use of reduced Gaussian grids in spectral models, Mon. Weather Rev., 119, 1057–1074, 1991.
Inness, A., Baier, F., Benedetti, A., Bouarar, I., Chabrillat, S., Clark, H., Clerbaux, C., Coheur, P., Engelen, R. J., Errera, Q., Flemming, J., George, M., Granier, C., Hadji-Lazaro, J.,
Huij-30
AMTD
7, 2259–2299, 2014GOME-2 total ozone and assimilation in
MACC
N. Hao et al.
Title Page
Abstract Introduction
Conclusions References
Tables Figures
◭ ◮
◭ ◮
Back Close
Full Screen / Esc
Printer-friendly Version Interactive Discussion
Discussion
P
a
per
|
D
iscussion
P
a
per
|
Discussion
P
a
per
|
Discuss
ion
P
a
per
|
data set of atmospheric composition, Atmos. Chem. Phys., 13, 4073–4109, doi:10.5194/acp-13-4073-2013, 2013.
Kerr, J. B., Asbridge, I. A., and Evans, W. F. J.: Intercomparison of total ozone measured by the Brewer and Dobson spectrophotometers at Toronto, J. Geophys. Res., 93, 11129–11140, 1988.
5
Koukouli, M. E., Balis, D. S., Loyola, D., Valks, P., Zimmer, W., Hao, N., Lambert, J.-C., Van Roozendael, M., Lerot, C., and Spurr, R. J. D.: Geophysical validation and long-term con-sistency between GOME-2/MetOp-A total ozone column and measurements from the sen-sors GOME/ERS-2, SCIAMACHY/ENVISAT and OMI/Aura, Atmos. Meas. Tech., 5, 2169– 2181, doi:10.5194/amt-5-2169-2012, 2012.
10
Labow, G. J., McPeters, R. D., Bhartia, P. K., and Kramarova, N.: A comparison of 40 years of SBUV measurements of column ozone with data from the Dobson/Brewer network, J. Geophys. Res.-Atmos., 118, 7370–7378, doi:10.1002/jgrd.50503, 2013.
Lacan, A. and Lang, R.: Investigation on GOME-2 throughput degradation, Final report, EUM/LEO/REP/09/0732 Issue 1.1, 2011.
15
Lerot, C., Van Roozendael, M., van Geffen, J., van Gent, J., Fayt, C., Spurr, R., Lichtenberg, G., and von Bargen, A.: Six years of total ozone column measurements from SCIAMACHY nadir observations, Atmos. Meas. Tech., 2, 87–98, doi:10.5194/amt-2-87-2009, 2009.
Lerot, C., Van Roozendael, M., Spurr, R., Loyola, D., Coldewey-Egbers, M., Kochenova, S., van Gent, J., Koukouli, M., Balis, D., Lambert, J.-C., Granville, J., and Zehner, C.: Homogenized
20
total ozone data records from the European sensors GOME/ERS-2, SCIAMACHY/Envisat and GOME-2/MetOp-A, J. Geophys. Res. Atmos., 119, doi:10.1002/2013JD020831, online first, 2014.
Levelt, P. F., van den Oord, G. H. J., Dobber, M. R., Mälkki, A., Visser, H., de Vries, J., Stammes, P., Lundell, J. O. V., and Saari, H.: The ozone monitoring instrument, IEEE T.
25
Geosci. Remote, 44, 1093–1101, 2006.
Liu, C., Liu, X., and Chance, K.: The impact of using different ozone cross sections on ozone
profile retrievals from OMI UV measurements, J. Quant. Spectrosc. Ra., 130, 365–372, 2013.
Liu, X., Chance, K., Sioris, C. E., and Kurosu, T. P.: Impact of using different ozone cross
30
AMTD
7, 2259–2299, 2014GOME-2 total ozone and assimilation in
MACC
N. Hao et al.
Title Page
Abstract Introduction
Conclusions References
Tables Figures
◭ ◮
◭ ◮
Back Close
Full Screen / Esc
Printer-friendly Version Interactive Discussion
Discussion
P
a
per
|
D
iscussion
P
a
per
|
Discussion
P
a
per
|
Discuss
ion
P
a
per
|
Livesey, N. J., Read, W. G., Froidevaux, L., Lambert, A., Manney, G. L., Pumphrey, H. C., San-tee, M. L., Schwartz, M. J., Wang, S. H., Cofeld, R. E., Cuddy, D. T., Fuller, R. A., Jarnot, R. F., Jiang, J. H., Knosp, B. W., Stek, P. C., Wagner, P. A. and Wu, D. L.: Earth Observing System (EOS) Aura Microwave Limb Sounder (MLS) Version 3.3 and 3.4 Level 2 data quality and description document, available at: http://mls.jpl.nasa.gov/data/datadocs.php (last access:
5
5 March 2014), 2011.
Loyola, D., Thomas, W., Livschitz, Y., Ruppert, T., Albert, P., and Hollmann, R.: Cloud properties derived from GOME/ERS-2 backscatter data for trace gas retrieval, IEEE T. Geosci. Remote, 45, 2747–2758, doi:10.1109/TGRS.2007.901043, 2007.
Loyola, D., Coldewey-Egbers, M., Dameris, M., Garny, H., Stenke, A., Van
Roozen-10
dael, M., Lerot, C., Balis, D., and Koukouli, M.: Global long-term monitoring of the ozone layer-A prerequisite for predictions, Int. J. Remote Sens., 30, 4295–4318, doi:10.1080/01431160902825016, 2009.
Loyola, D. G., Koukouli, M. E., Valks, P., Balis, D. S., Hao, N., Van Roozendael, M., Spurr, R. J. D., Zimmer, W., Kiemle, S., Lerot, C., and Lambert, J.-C.: The GOME-2 total
15
column ozone product: retrieval algorithm and ground-based validation, J. Geophys. Res., 116, D07302, doi:10.1029/2010JD014675, 2011.
Malicet, J., Daumont, D., Charbonnier, J., Chakir, C., Parisse, A., and Brion, J.: Ozone UV spectroscopy, II: absorption cross cections and temperature dependence, J. Atmos. Chem., 21, 163–173, 1995.
20
Munro, R., Eisinger, M., Anderson, C., Callies, J., Corpaccioli, E., Lang, R., Lefebvre, A., Livs-chitz, Y., and Albinana, A. P.: GOME-2 on MetOp, in: Proc. of The 2006 EUMETSAT Meteo-rological Satellite Conference, Helsinki, Finland, 2006.
Orphal, J.: A Critical Review of the Absorption Cross-Sections of O3 and NO2 in the 240– 790 nm Region, Part I. Ozone, ESA Technical Note MO-TN-ESA-GO-0302, 2002.
25
Orphal, J.: A critical review of the absorption cross-sections of O3 and NO2 in the ultraviolet and visible, J. Photoch. Photobio. A, 157, 185–209, 2003.
Platt, U. and Stutz, J.: Differential Optical Absorption Spectroscopy: Principles and Applications (Physics of Earth and Space Environments), Springer-Verlag, Berlin, Heidelberg, 2008. Richter, A. and Burrows, J.: Tropospheric NO2 from GOME measurements, Adv. Space Res.,
30
AMTD
7, 2259–2299, 2014GOME-2 total ozone and assimilation in
MACC
N. Hao et al.
Title Page
Abstract Introduction
Conclusions References
Tables Figures
◭ ◮
◭ ◮
Back Close
Full Screen / Esc
Printer-friendly Version Interactive Discussion
Discussion
P
a
per
|
D
iscussion
P
a
per
|
Discussion
P
a
per
|
Discuss
ion
P
a
per
|
Siddans, R., Latter, B. G., Kerridge, B. J., Smeets, J., Otter, G., and Slijkhuis, S.: Anal-ysis of GOME-2 Slit Function Measurements: Final Report Eumetsat Contract No. EUM/CO/04/1298/RM, 2006.
Siddans, R., Kerridge, B. J., Latter, B. G., Smeets, J., and Otter, G.: Analysis of GOME-2 Slit Function Measurements Algorithm Theoretical Basis Document, Eumetsat Contract No.
5
EUM/CO/04/1298/RM, 2012.
Spurr, R.: LIDORT and VLIDORT: linearized pseudo-spherical scalar and vector discrete ordi-nate radiative transfer models for use in remote sensing retrieval problems, in: Light Scatter-ing Reviews, vol. 3, edited by: Kokhanovsky, A., SprScatter-inger, Berlin, 229–275, doi:10.1007/978-3-540-48546-9_7, 2008.
10
Spurr, R., Loyola, D., Thomas, W., Balzer, W., Mikusch, E., Aberle, B., Slijkhuis, S., Ruppert, T., Van Roozendael, M., Lambert, J.-C., and Soebijanta, T.: GOME level 1-to-2 data processor version 3.0: a major upgrade of the GOME_ERS-2 total ozone retrieval algorithm, Appl. Optics, 44, 7196–7209, 2005.
Staehelin, J., Kerr, J., Evans, R., and Vanicek, K.: Comparison of total ozone measurements of
15
Dobson and Brewer spectrophotometers and recommended transfer functions, WMO TD N. 1147, No. 149, 2003.
Stein, O., Flemming, J., Inness, A., Kaiser, J. W., and Schultz, M. G.: Global reactive gases forecasts and reanalysis in the MACC project, J. Integr. Environ. Sci., 9, 57–70, doi:10.1080/1943815X.2012.696545, 2012.
20
Valks, P., Pinardi, G., Richter, A., Lambert, J.-C., Hao, N., Loyola, D., Van Roozendael, M., and Emmadi, S.: Operational total and tropospheric NO2 column retrieval for GOME-2, Atmos. Meas. Tech., 4, 1491–1514, doi:10.5194/amt-4-1491-2011, 2011.
Van Roozendael, M., Peeters, P., Roscoe, H. K., De Backer, H., Jones, A., Vaughan, G., Goutail, F., Pommereau, J.-P., Kyrö, E., Wahlstrøm, C., Braathen, G., and Simon, P. C.:
Vali-25
dation of ground-based UV-visible measurements of total Ozone by comparison with Dobson and Brewer Spectrophotometers, J. Atmos. Chem., 29, 55–83, 1998.
Van Roozendael, M., Soebijanta, V., Fayt, C., and Lambert, J.-C.: Investigation of DOAS issues affecting the accuracy of the GDP version 3.0 total ozone product, in: ERS-2 GOME GDP 3.0 Implementation and Delta Validation, edited by: Lambert, J.-C.,
ERSE-DTEX-EOAD-TN-30
02-0006, ESA/ESRIN, 97–129, Eur. Space Agency, Frascati, Italy, 99–131, 2002.
AMTD
7, 2259–2299, 2014GOME-2 total ozone and assimilation in
MACC
N. Hao et al.
Title Page
Abstract Introduction
Conclusions References
Tables Figures
◭ ◮
◭ ◮
Back Close
Full Screen / Esc
Printer-friendly Version Interactive Discussion
Discussion
P
a
per
|
D
iscussion
P
a
per
|
Discussion
P
a
per
|
Discuss
ion
P
a
per
|
– The new GOME data processor (GDP) version 4: 1. Algorithm description, J. Geophys. Res., 111, D14311, doi:10.1029/2005JD006375, 2006.
Van Roozendael, M., Spurr, R., Loyola, D., Lerot, C., Balis, D., Lambert, J.-C., Zim-mer, W., van Gent, J., Van Geffen, J., Koukouli, M., Granville, J., Doicu, A., Fayt, C., and Zehner, C.: Sixteen years of GOME/ERS-2 total ozone data: the new direct-fitting GOME
5
Data Processor (GDP) version 5-Algorithm description, J. Geophys. Res., 117, D03305, doi:10.1029/2011JD016471, 2012.
Waters, J. W., Froidevaux, L., Harwood, R. S., Jarnot, R. F., Pickett, H. M., Read, W. G., Siegel, P. H., Cofield, R. E., Filipiak, M. J., Flower, D. A., Holden, J. R., Lau, G. K. K., Livesey, N. J., Manney, G. L., Pumphrey, H. C., Santee, M. L., Wu, D. L., Cuddy, D. T., Lay, R. R., Loo,
10
M. S., Perun, V. S., Schwartz, M. J., Stek, P. C., Thurstans, R. P., Boyles, M. A., Chandra, K. M., Chavez, M. C., Chen, G. S., Chudasama, B. V., Dodge, R., Fuller, R. A., Girard, M. A., Jiang, J. H., Jiang, Y. B., Knosp, B. W., LaBelle, R. C., Lam, J. C., Lee, K. A., Miller, D., Oswald, J. E., Patel, N. C., Pukala, D. M., Quintero, O., Scaff, D. M., Van Snyder, W., Tope, M. C., Wagner, P. A., and Walch, M. J.: The Earth Observing System Microwave Limb Sounder
15
(EOS MLS) on the Aura satellite, IEEE T. Geosci. Remote, 44, 1075–1092, 2006.
Weber, M., Chehade, W., and Spietz, P.: Impact of ozone cross-section choice on WFDOAS total ozone retrieval applied to GOME, SCIAMACHY, and GOME2 (1995–present), Technical Note, available at: http://www.iup.uni-bremen.de/UVSAT_material/technotes/weber_acso_ 201311.pdf (last access: 5 March 2014), 2011.
AMTD
7, 2259–2299, 2014GOME-2 total ozone and assimilation in
MACC
N. Hao et al.
Title Page
Abstract Introduction
Conclusions References
Tables Figures
◭ ◮
◭ ◮
Back Close
Full Screen / Esc
Printer-friendly Version Interactive Discussion
Discussion
P
a
per
|
D
iscussion
P
a
per
|
Discussion
P
a
per
|
Discuss
ion
P
a
per
|
Fig. 1. (a)RMS fit residuals,(b)Effective temperatures,(c)O3cross section wavelength shifts
AMTD
7, 2259–2299, 2014GOME-2 total ozone and assimilation in
MACC
N. Hao et al.
Title Page
Abstract Introduction
Conclusions References
Tables Figures
◭ ◮
◭ ◮
Back Close
Full Screen / Esc
Printer-friendly Version Interactive Discussion
Discussion
P
a
per
|
D
iscussion
P
a
per
|
Discussion
P
a
per
|
Discuss
ion
P
a
per
|
* BDM
* FM98
◊GOME-2B FM
a b
d c
Fig. 2. (a)RMS fit residuals,(b)Effective temperatures,(c)O3cross section wavelength shifts
AMTD
7, 2259–2299, 2014GOME-2 total ozone and assimilation in
MACC
N. Hao et al.
Title Page
Abstract Introduction
Conclusions References
Tables Figures
◭ ◮
◭ ◮
Back Close
Full Screen / Esc
Printer-friendly Version Interactive Discussion
Discussion
P
a
per
|
D
iscussion
P
a
per
|
Discussion
P
a
per
|
Discuss
ion
P
a
per
|
Fig. 3.The scan angle dependency of ozone vertical column densities as function of latitude for GOME-2A (2008, black) and GOME-2B (2013, red) for January (left) and June (right). East pixels represent scan angles smaller than 0◦and west pixels represent scan angles larger than
AMTD
7, 2259–2299, 2014GOME-2 total ozone and assimilation in
MACC
N. Hao et al.
Title Page
Abstract Introduction
Conclusions References
Tables Figures
◭ ◮
◭ ◮
Back Close
Full Screen / Esc
Printer-friendly Version Interactive Discussion
Discussion
P
a
per
|
D
iscussion
P
a
per
|
Discussion
P
a
per
|
Discuss
ion
P
a
per
|
Fig. 4.Empirical correction factors as a function of latitude and scan angle (East: scan angle
<0◦ ; West: scan angle>0◦) for January and July. Correction ratios larger than one (red) are