AMTD
7, 9573–9601, 2014Validation of GOME-2/MetOp-A total water vapour
column
M. Antón et al.
Title Page
Abstract Introduction
Conclusions References
Tables Figures
◭ ◮
◭ ◮
Back Close
Full Screen / Esc
Printer-friendly Version Interactive Discussion
Discussion
P
a
per
|
Discus
sion
P
a
per
|
Discussion
P
a
per
|
Discussion
P
a
per
|
Atmos. Meas. Tech. Discuss., 7, 9573–9601, 2014 www.atmos-meas-tech-discuss.net/7/9573/2014/ doi:10.5194/amtd-7-9573-2014
© Author(s) 2014. CC Attribution 3.0 License.
This discussion paper is/has been under review for the journal Atmospheric Measurement Techniques (AMT). Please refer to the corresponding final paper in AMT if available.
Validation of GOME-2/MetOp-A total water
vapour column using reference
radiosonde data from GRUAN network
M. Antón1, D. Loyola2, R. Román3, and H. Vömel4
1
Departamento de Física, Universidad de Extremadura, Badajoz, Spain 2
Remote Sensing Technology Institute (IMF), German Aerospace Center (DLR), Oberpfaffenhofen, Germany
3
Grupo de Óptica Atmosférica (GOA), Universidad de Valladolid, Valladolid, Spain 4
Meteorological Observatory Lindenberg, Deutscher Wetterdienst, Lindenberg, Germany
Received: 28 July 2014 – Accepted: 8 September 2014 – Published: 18 September 2014
Correspondence to: M. Antón ([email protected])
AMTD
7, 9573–9601, 2014Validation of GOME-2/MetOp-A total water vapour
column
M. Antón et al.
Title Page
Abstract Introduction
Conclusions References
Tables Figures
◭ ◮
◭ ◮
Back Close
Full Screen / Esc
Printer-friendly Version Interactive Discussion
Discussion
P
a
per
|
Discus
sion
P
a
per
|
Discussion
P
a
per
|
Discussion
P
a
per
|
Abstract
The main goal of this article is to validate the total water vapour column (TWVC) mea-sured by the Global Ozone Monitoring Experiment-2 (GOME-2) satellite sensor and generated using the GOME Data Processor (GDP) retrieval algorithm developed by the German Aerospace Center (DLR). For this purpose, spatially and temporally col-5
located TWVC data from highly accurate sounding measurements for the period Jan-uary 2009–May 2014 at six sites are used. These balloon-borne data are provided by GCOS Reference Upper-Air Network (GRUAN). The correlation between GOME-2 and
sounding TWVC data is reasonably good (determination coefficient (R2) of 0.89) when
all available radiosondes (1400) are employed in the inter-comparison. When cloud-10
free cases (544) are selected by means of the satellite cloud fraction (CF), the
corre-lation exhibits a remarkable improvement (R2∼0.95). Nevertheless, analyzing the six
datasets together, the relative differences between GOME-2 and GRUAN data shows
mean values (in absolute term) of 19 % for all-sky conditions and 14 % for cloud-free cases, which evidences a notable bias in the satellite TWVC data against the reference 15
balloon-borne measurements. The satellite-sounding TWVC differences show a strong
solar zenith angle (SZA) dependence for values above 50◦ with a stable behaviour
for values below this zenith angle. The smallest relative differences found in the
inter-comparison (between−5 and+3 %) are achieved for those cloud-free cases with SZA
below 50◦. Furthermore, the detailed analysis of the influence of cloud properties (CF,
20
cloud top albedo (CTA) and cloud top pressure (CTP)) on the satellite-sounding diff
er-ences reveals, as expected, a large effect of clouds in the GOME-2 TWVC data. For
instance, the relative differences exhibit a large negative dependence on CTA, varying
from+5 to−20 % when CTA rises from 0.3 to 0.9. Finally, the satellite-sounding
dif-ferences also show a negative dependence on the reference TWVC values, changing 25
AMTD
7, 9573–9601, 2014Validation of GOME-2/MetOp-A total water vapour
column
M. Antón et al.
Title Page
Abstract Introduction
Conclusions References
Tables Figures
◭ ◮
◭ ◮
Back Close
Full Screen / Esc
Printer-friendly Version Interactive Discussion
Discussion
P
a
per
|
Discus
sion
P
a
per
|
Discussion
P
a
per
|
Discussion
P
a
per
|
1 Introduction
Atmospheric water vapour is a key component for weather and the climate system because it plays a vital role in the formation of clouds and precipitation, the growth of aerosols and significantly contributes to the energy balance of the Earth when acting as a powerful greenhouse gas. Unlike the most trace gases, the atmospheric water vapour 5
exhibits a highly variable spatial and temporal distribution. Hence, close monitoring of its variability and long-term changes is a critical issue for the scientific community (e.g., Hartmann et al., 2013).
Remote sensing instruments aboard satellite platforms provide an effective way to
monitor the geographical and temporal distribution of the column-integrated amount of 10
atmospheric water vapour, called total water vapour column (TWVC), thanks to their global coverage, high spatial resolution and accurate observations (e.g., Kaufman and Gao, 1992; Bauer and Schluessel, 1993; Noël et al., 1999, 2004; Maurellis et al., 2000; Wagner et al., 2006; Li et al., 2006; Deeter, 2007; Lang et al., 2007; Mieruch et al., 2008; Pougatchev et al., 2009). Within this framework, the European satellite-borne 15
atmospheric sensor Global Ozone Monitoring Experiment 2 (GOME-2) aboard Meteo-rological Operational satellite program (MetOp-A and MetOp-B) provides the potential for a detailed analysis of the global distribution of the atmospheric water vapour (Grissi et al., 2014). MetOp-A and MetOp-B were launched in 2006 and 2012, respectively, belonging to a series of three similar meteorological satellites from EUMESAT (MetOp-20
C is expected to be in orbit in 2018). The main objective of MetOp mission is to provide continuous and long-term observations of the most important trace gases, supporting operational meteorology, global weather forecasting and climate monitoring (Edwards et al., 2006). The three MetOp satellites will guarantee continuous TWVC time series using the same sensor (GOME-2) to at least the first half of 2020s.
25
AMTD
7, 9573–9601, 2014Validation of GOME-2/MetOp-A total water vapour
column
M. Antón et al.
Title Page
Abstract Introduction
Conclusions References
Tables Figures
◭ ◮
◭ ◮
Back Close
Full Screen / Esc
Printer-friendly Version Interactive Discussion
Discussion
P
a
per
|
Discus
sion
P
a
per
|
Discussion
P
a
per
|
Discussion
P
a
per
|
weather balloons equipped with pressure, temperature, and humidity sensors is an es-sential technique to monitor the TWVC changes under all weather conditions (e.g., Ross and Elliott, 2001; Durre et al., 2009). Nevertheless, it is well known that ra-diosonde humidity records can contain sensor-dependent errors that vary notably over time and space (e.g., Vömel et al., 2007; Wang and Zhang, 2008; Dai et al., 2011). 5
Therefore, the balloon-borne data used as reference in the validation of satellite ob-servations must be generated by high-quality networks with identical instrumentation and a common mode of operation. For instance, GCOS Reference Upper-Air Network (GRUAN) provides highly accurate sounding measurements complemented by ground-based instruments for the study of atmospheric processes (Seidel et al., 2009; Immler 10
et al., 2010). GRUAN has developed a high-quality data product based on measure-ments of temperature, humidity, wind and pressure by the Vaisala RS92 radiosonde (Immler and Sommer, 2011; Dirksen et al., 2014).
This paper focuses on the validation of the TWVC data measured by the GOME-2/MetOp-A satellite instrument using as reference the balloon-borne data recorded 15
between January 2009 and May 2014 from six GRUAN stations. In this satellite valida-tion, we use the TWVC data inferred from the GOME Data Processor (GDP) retrieval algorithm (versions 4.6 and 4.7) generated by the German Aerospace Center, Remote Sensing Technology Institute (DLR-IMF) in the framework of the EUMETSAT Satel-lite Application Facility on Atmospheric Chemistry Monitoring (O3M SAF) (Valks et al., 20
2013). This retrieval algorithm is based on the classical Differential Optical Absorption
Spectroscopy (DOAS) technique (Platt, 1994). Although some validation exercises of GOME-2 TWVC data have been separately carried out before (e.g., Kalakoski et al., 2011; Schröder and Schneider, 2012; Grossi et al., 2013, 2014), the present study should be considered as complementary since it works with a homogeneous high-25
quality datasets as reference (RS92 GRUAN Data Product, RS92-GDP) and with a
fo-cus on the analysis of the effects of cloudiness and geometrical properties that has not
AMTD
7, 9573–9601, 2014Validation of GOME-2/MetOp-A total water vapour
column
M. Antón et al.
Title Page
Abstract Introduction
Conclusions References
Tables Figures
◭ ◮
◭ ◮
Back Close
Full Screen / Esc
Printer-friendly Version Interactive Discussion
Discussion
P
a
per
|
Discus
sion
P
a
per
|
Discussion
P
a
per
|
Discussion
P
a
per
|
understanding of the quality of the GOME-2 TWVC data retrieved by the GDP retrieval algorithm.
The satellite and sounding data employed in this article are described in Sect. 2. Section 3 explains the methodology applied in the validation. The results obtained are presented and discussed in Sect. 4 and, finally, the foremost conclusions derived from 5
this work are summarized in Sect. 5.
2 Data
2.1 Satellite observations
The GOME-2 is an across-track scanning nadir-viewing (from about 240 to 790 nm) spectrometer launched on board EUMETSAT MetOp-A in October 2006 (Munro et al., 10
2006). This satellite instrument is an enhanced version of its antecessor GOME/ERS-2 launched in 1995 (Burrows at al., 1999) with an improved temporal coverage (daily
near global coverage at the Equator) thanks to a spatial resolution of 80 km×40 km and
a swath of 1920 km. The MetOp-A has a sun-synchronous orbit, with a mean altitude of 817 km and an equator crossing time of 09:30 LT.
15
The operational algorithms for the retrieval of TWVC data from the GOME-2/MetOp-A is the level-1-to-2 GOME Data Processor (GDP) (versions 4.6 and 4.7), integrated into the Universal Processor for Atmospheric Spectrometers (UPAS, version 1.3.9) pro-cessing system at DLR-IMF. A detailed description of GDP 4.6–4.7 can be found in the Algorithm Theoretical Basis Document of Valks et al. (2013) and in the work of Grossi 20
et al. (2014). Here a brief description is presented. In a first step, this algorithm retrieved the water vapour slant column density (SCD) by means of the DOAS methodology ap-plied in the spectral range 614.0–683.2 nm. In a second step, correction factors derived from numerical simulations are applied to the SCD values in order to remove the
ab-sorption non-linearity effect which is related to the highly fine structured water vapour
25
AMTD
7, 9573–9601, 2014Validation of GOME-2/MetOp-A total water vapour
column
M. Antón et al.
Title Page
Abstract Introduction
Conclusions References
Tables Figures
◭ ◮
◭ ◮
Back Close
Full Screen / Esc
Printer-friendly Version Interactive Discussion
Discussion
P
a
per
|
Discus
sion
P
a
per
|
Discussion
P
a
per
|
Discussion
P
a
per
|
dividing the corrected SCD values by appropriated Air Mass Factors (AMF) which is
derived from the measured O2absorption. The major improvement in the current GDP
4.7 compared with the previous GDP 4.6 is the empirical correction for the scan an-gle dependency which almost completely removes the bias between East and West ground pixels in the 24 forward scans (Grossi et al., 2014). The new GDP 4.7 version 5
was released in July 2013, hence, most of the GOME-2 TWVC data used in this study
(∼86 %) correspond to the GDP 4.6 version.
2.2 Sounding measurements
The reference balloon-borne data used in this work to validate the GOME-2 TWVC ob-servations are taken from the GRUAN network which aims to provide traceable mea-10
surements of atmospheric profiles for a detailed characterization of essential climate variables (e.g., pressure, temperature, water vapour) over a long-term period (Seidel et al., 2009; Immler et al., 2010).
The GRUAN data product (RS92-GDP) currently available is based on balloon-borne measurements using Vaisala RS92 sondes (Immler and Sommer, 2011; Dirksen et al., 15
2014). This instrument presents a contrasted quality exhibiting the smallest systematic and random errors among the diverse types of radiosonde sensors (e.g., Miloshevich et al., 2006; Nash et al., 2011; Moradi et al., 2013). Nevertheless, there are several error sources of RS92 measurements which may limit their quality such as the so-lar radiation error related to the soso-lar heating of the humidity sensor (see Miloshevich 20
et al. (2009) and references within). Hence, the added value of the GRUAN product is associated with the implementation of an exhaustive data processing method including
corrections for the different error sources which guarantees high quality sounding
mea-surements (Immler and Sommer, 2011; Dirksen et al., 2014). Additionally, RS92-GDP is the first dataset of balloon-borne measurements that provides vertically resolved un-25
AMTD
7, 9573–9601, 2014Validation of GOME-2/MetOp-A total water vapour
column
M. Antón et al.
Title Page
Abstract Introduction
Conclusions References
Tables Figures
◭ ◮
◭ ◮
Back Close
Full Screen / Esc
Printer-friendly Version Interactive Discussion
Discussion
P
a
per
|
Discus
sion
P
a
per
|
Discussion
P
a
per
|
Discussion
P
a
per
|
absolute errors in the relative humidity from RS92-GDP used in this work are below 4 %.
The TWVC values used as reference in this paper are obtained by integrating the vertical-profiles of water vapour volume mixing ratio from the RS92-GDP files:
TWVC =1
g
Z
M(p)·dp, (1)
5
whereM(p) is the mixing ratio at the pressure levelpandgis the acceleration due to
gravity.
3 Methodology
In this work, two co-location criteria are followed to select TWVC data for inter-10
comparison purposes. Firstly, the GOME-2 data are selected such that the distance between the center of the satellite pixel and the location of the GRUAN station is always less than 100 km. The mean distance of all selected GOME-2 overpasses is 27 km. The second criterion is related to the measured time, being only selected those
radioson-des with a difference between their launch time and the satellite overpass time smaller
15
than 120 min. Additionally, all GOME-2 TWVC data used in this work correspond with those cases, which are not flagged as cloud contaminated by the GDP 4.6–4.7 retrieval algorithms. The “H2O flag” is set when the observed surface reflection indicates heavy
cloudy conditions (cloud albedo×cloud fraction >0.6) or when the O2 absorption is
too small (Valks et al., 2013). 20
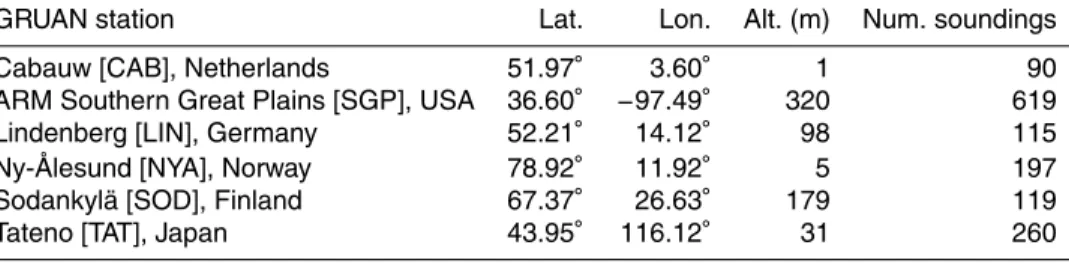
Applying the two co-location criteria and the “H2O flag”, a total of 1400 soundings of six GRUAN stations (Table 1) were used to be compared against GOME-2 TWVC data throughout the period 2009–2014. Detailed information about these six stations can be found at www.gruan.org.
A linear regression analysis is performed between the TWVC values measured by 25
AMTD
7, 9573–9601, 2014Validation of GOME-2/MetOp-A total water vapour
column
M. Antón et al.
Title Page
Abstract Introduction
Conclusions References
Tables Figures
◭ ◮
◭ ◮
Back Close
Full Screen / Esc
Printer-friendly Version Interactive Discussion
Discussion
P
a
per
|
Discus
sion
P
a
per
|
Discussion
P
a
per
|
Discussion
P
a
per
|
coefficients of determination (R2) and the root mean square errors (RMSE) are
eval-uated in this analysis. Furthermore, the relative differences (RD) between radiosonde
TWVC data (Rad) and satellite TWVC data (Sat) are obtained for each GRUAN site by means of the next expression:
RD =100·Sat-Rad
Rad (2)
5
From these relative differences, the mean bias error (MBE) and the mean absolute bias
error (MABE) parameter are determined as:
MBE = 1
N
N
X
i=1
RDi (3)
MABE = 1
N
N
X
i=1
|RDi|, (4)
10
whereN is the number of data pairs Satellite–Radiosonde recorded in each GRUAN
site.
The uncertainty of MBE and MABE is characterized by the standard error (SE) de-fined as:
15
SE =√SD
N
, (5)
where SD is the standard deviation.
4 Results and discussion
4.1 Regression analysis
20
AMTD
7, 9573–9601, 2014Validation of GOME-2/MetOp-A total water vapour
column
M. Antón et al.
Title Page
Abstract Introduction
Conclusions References
Tables Figures
◭ ◮
◭ ◮
Back Close
Full Screen / Esc
Printer-friendly Version Interactive Discussion
Discussion
P
a
per
|
Discus
sion
P
a
per
|
Discussion
P
a
per
|
Discussion
P
a
per
|
their proportionality and similarity. Statistical parameters (the slope of the regression,
R2 and RMSE) derived from the linear fitting between radiosonde and GOME-2 data
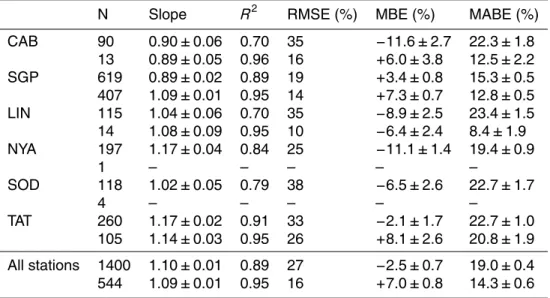
are shown in Table 2. Additionally, this table also shows the MBE and MABE parame-ter obtained by Eqs. (3) and (4). The results shown for all-sky conditions (upper rows) reveal a fair agreement between GRUAN and GOME-2 TWVC with determination coef-5
ficients higher than 0.70 for the six stations. Furthermore, the linear regression analysis provides slopes close to unity which is a sign of the proportionality between the sound-ing and satellite data. The negative values of the almost all MBE parameters indicates that GOME-2 TWVC data underestimate on average the GRUAN balloon-borne mea-surements when all-sky conditions are used in the inter-comparison. Nevertheless, this 10
underestimation is small, being 2.5 % when the six stations are analyzed together. Ta-ble 2 also shows high MABE values (between 15 and 23 %) with an average value of 19 % for all-sky conditions. These results evidence a notable bias in the GOME-2 TWVC with respect to the reference sounding data.
Although a satellite “H2O flag” has been used to select those GOME-2 TWVC data 15
not contaminated by heavy cloudy conditions (see previous Section), the remaining cloudy cases can introduce additional bias in the inter-comparison between satellite and sounding TWVC data. Thus, a correlation analysis between GOME-2 and GRUAN data has been performed only for those cases with satellite cloud fraction smaller than 5 % (called cloud-free cases). These cloud-free cases represent about 39 % of 20
all cases. Table 2 also shows the results for these cloud-free correlations (lower rows). Thus, when exclusively cloud-free conditions are used in the correlation analysis, it
can be seen that, as expected, the statistical parametersR2and RMSE improve
sub-stantially. Furthermore, the MABE values are also notably reduced. It must be noted that MBE values turns to positive values which may suggest that GOME-2 TWVC data 25
overestimate the reference balloon-borne measurements for cloud-free conditions. Figure 1 shows the relationship between satellite and sounding TWVC data for all-sky conditions (top plot), revealing a good agreement in the correlation but with
AMTD
7, 9573–9601, 2014Validation of GOME-2/MetOp-A total water vapour
column
M. Antón et al.
Title Page
Abstract Introduction
Conclusions References
Tables Figures
◭ ◮
◭ ◮
Back Close
Full Screen / Esc
Printer-friendly Version Interactive Discussion
Discussion
P
a
per
|
Discus
sion
P
a
per
|
Discussion
P
a
per
|
Discussion
P
a
per
|
cloud-free conditions are selected for the analysis (bottom plot), decreasing the RMSE value to about 16 %. Overall, the inclusion of cloudy cases in the satellite-sounding inter-comparison produces an increase of the both the scatter in the correlation and the bias with respect to the reference data.
4.2 Dependence of the differences on geometrical parameters
5
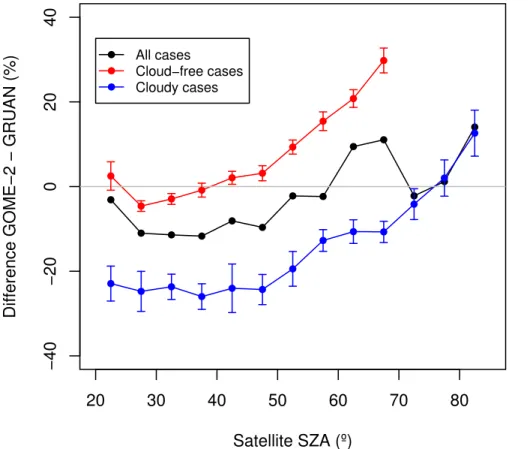
The mean relative differences between sounding and GOME-2 TWVC data (Eq. 3) as
a function of satellite ground pixel solar zenith angle (SZA) are shown in Fig. 2 using
5◦ bins of SZA. This dependence has been studied for three data sets: all data (in
black), cloud-free cases (CF<5 %, in red) and cloudy conditions (CF>50 %, in blue).
The percentage of cases selected is about 39 % for cloud-free conditions and 31 % for 10
cloudy conditions. Error bars represent the standard errors (Eq. 5) which are plotted for cloud-free and cloudy data sets. The three curves follow practically similar pattern,
showing, firstly, a stable behavior until 45–50◦and, from this zenith angle, a monotonic
increase until high SZA values in agreement with other GOME-2 validation exercises (e.g., Kalakoski et al., 2011). GOME-2 data strongly underestimate the GRUAN mea-15
surements recorded under cloudy conditions (relative differences between−25 % and
−10 %) for the whole range of SZA values. By contrast, the results for the cloud-free
data set reveals a good agreement between satellite and balloon-borne data for SZA
values up to 50◦(relative differences between−5 and+3 %), while a clear
overestima-tion appears for higher SZA values. For SZA values above 50◦, the cloud-free curve
20
shows a significant dependence on SZA with relative differences between+3 % (SZA
of 50◦) and+28 % (SZA of 70◦).
The SZA dependence found for both cloud-free and cloudy data sets is currently un-der investigation and could be due to some calibration issues in the level 1B (calibrated radiances) satellite products. Another possible error source for this SZA dependence 25
may be related to the correction factor applied to obtain the AMF of the water vapour,
AMTD
7, 9573–9601, 2014Validation of GOME-2/MetOp-A total water vapour
column
M. Antón et al.
Title Page
Abstract Introduction
Conclusions References
Tables Figures
◭ ◮
◭ ◮
Back Close
Full Screen / Esc
Printer-friendly Version Interactive Discussion
Discussion
P
a
per
|
Discus
sion
P
a
per
|
Discussion
P
a
per
|
Discussion
P
a
per
|
into account the different vertical profiles of these trace gases and it strongly depends
on SZA (see Fig. 11 in Valks et al., 2013).
The significant SZA dependence found on the GOME-2 TWVC data leads to a sys-tematic seasonal dependence (not shown) with respect to reference balloon-borne measurements. While the satellite observations underestimate the sounding data in 5
summer months, a substantial overestimation appears for the winter months. Thus, for
the cloud-free data set, the monthly averages of the relative differences varies from
(−5±2) % in July to (+31±5) % in December.
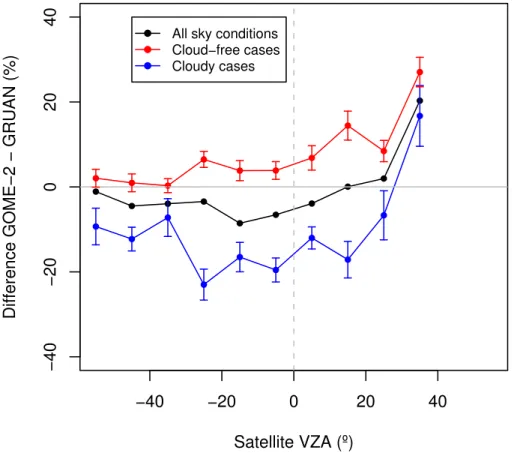
The satellite view zenith angle (VZA) also known as satellite scan angle is other rel-evant geometry parameter. GOME-2/MetOp-A measured 24 scenes along the ground 10
swath, one for each satellite VZA stepping at 5◦intervals between−60 and+60◦(Munro
et al., 2006). As was commented in the Sect. 2.1, the main improvement in the current GDP 4.7 with respect to the previous version GDP 4.6 is the inclusion of an empirical correction to reduce the bias detected for the outermost west pixels (positive scan
an-gles). The satellite-soundings relative differences as a function of the satellite VZA are
15
shown in Fig. 3 using exclusively GOME-2 data from GDP 4.6. It can be seen that the GOME-2 TWVC data for all sky, cloud-free and cloudy conditions present no signifi-cant dependence on VZA except for the outermost west pixels which exhibits a great
overestimation (∼20 %) with respect to GRUAN data. Furthermore, there is an evident
difference between the curve corresponding to cloud-free and cloudy conditions,
simi-20
lar to the results shown in Fig. 2. When GOME-2 data from GDP 4.7 are used instead of GDP 4.6, the VZA dependence displays similar results for all sky cases (not shown), but with a strong reduction of the bias for the outermost west pixel up to 3 %. The lim-ited number of GOME-2 data from GDP 4.7 prevents the distinction between cloud-free and cloudy conditions in the analysis for the current version.
25
4.3 Dependence of the differences on cloud parameters
AMTD
7, 9573–9601, 2014Validation of GOME-2/MetOp-A total water vapour
column
M. Antón et al.
Title Page
Abstract Introduction
Conclusions References
Tables Figures
◭ ◮
◭ ◮
Back Close
Full Screen / Esc
Printer-friendly Version Interactive Discussion
Discussion
P
a
per
|
Discus
sion
P
a
per
|
Discussion
P
a
per
|
Discussion
P
a
per
|
(e.g, Koelemeijer and Stammes, 1999; Kokhanovsky et al., 2007; Antón and Loyola,
2011; du Piesanie et al., 2013). The previous subsection has shown the strong effect
of the cloudy cases on the GOME-2–GRUAN inter-comparison. Therefore, it is highly
interesting to study the effects of the cloud parameters (cloud fraction (CF), cloud top
albedo (CTA) and cloud top pressure (CTP)) in the satellite-sounding differences. While
5
the GOME-2 CF is retrieved by the OCRA algorithm using broadband radiance mea-surements in the ultraviolet-visible range, GOME-2 CTP and CTA are both derived from the ROCINN algorithm using the spectral information in and around the Oxygen-A band (Loyola et al., 2007). The GDP 4.6 and 4.7 also use improved cloud retrieval algorithms
including detection of Sun glint effects (Loyola et al., 2011).
10
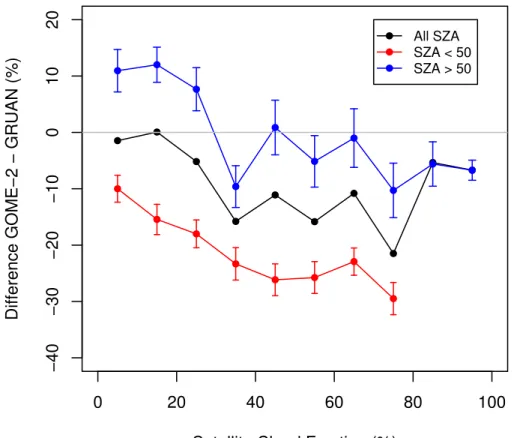
The relative differences as a function of satellite CF are shown in Fig. 4 using bins
of 10 %. This plot exhibits three curves corresponding to all cases (in black), and those
cases with SZA<50◦ (in red) and SZA >50◦ (in blue). It can be appreciated that the
TWVC data inferred from GOME-2 for SZA values below 50◦ clearly present a larger
underestimation of the sounding measurements than the TWVC data for SZA values 15
above 50◦, confirming the SZA dependence observed in Fig. 2. Additionally, the
under-estimation rises with increasing CF, being this dependence stronger for the dataset with
SZA<50◦. From this dependence, one can infer that the cloud effects on the satellite
TWVC retrieval are stronger for low SZA than for high SZA values in agreement with the results reported for other satellite products like the total ozone column (e.g., Antón 20
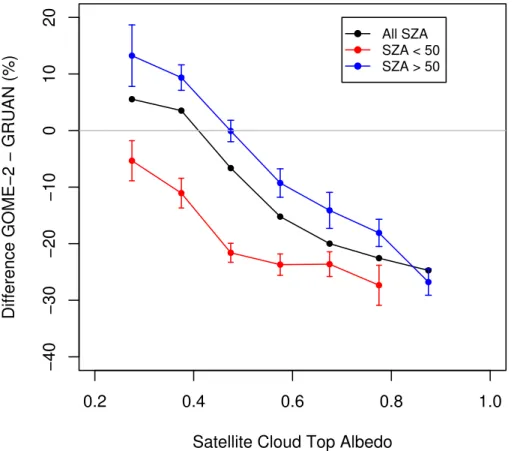
and Loyola, 2011). The significant influence of cloudiness in the relative differences
be-tween satellite and balloon-borne measurements is confirmed by Fig. 5 which exhibits
a remarkable dependence of the relative differences with the satellite CTA for the three
curves shown. For instance, when all cases are considered, the relative differences
change from+5 to−20 % when CTA rises from 0.3 to 0.9.
25
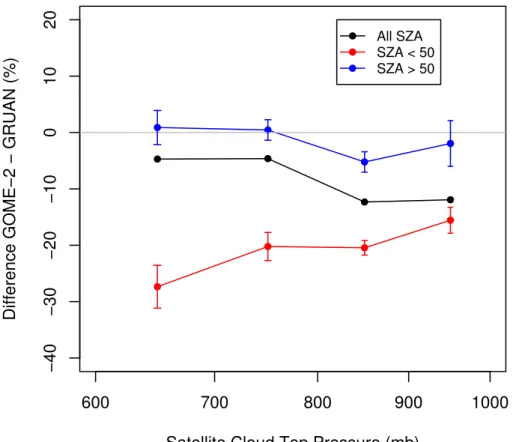
Finally, the dependency of the relative differences between GOME-2 and GRUAN
data with respect to the satellite CTP for all, low and high SZA values is shown in Fig. 6.
It can be seen that the curve corresponding to SZA values above 50◦ shows a stable
AMTD
7, 9573–9601, 2014Validation of GOME-2/MetOp-A total water vapour
column
M. Antón et al.
Title Page
Abstract Introduction
Conclusions References
Tables Figures
◭ ◮
◭ ◮
Back Close
Full Screen / Esc
Printer-friendly Version Interactive Discussion
Discussion
P
a
per
|
Discus
sion
P
a
per
|
Discussion
P
a
per
|
Discussion
P
a
per
|
to SZA values below 50◦presents an increase in relative differences (in absolute term)
with decreasing CTP (increasing cloud top height).
The strong influence of cloudiness in the satellite TWVC retrieval is mainly
asso-ciated with the so-called shielding effect which consist of that part of the trace gas
column below clouds is hidden by them (Kokhanovsky and Rozanov, 2008). As most 5
of the water vapour is found in the troposphere, increasing its volume mixing ratio
to-wards the surface, it is expected a large impact of the shielding effect on the satellite
TWVC retrievals (Mieruch et al., 2008, 2010). Thus, some retrieval algorithms make use of a cloud correction method to take into account the water vapour present below
the clouds, e.g., the AMC-DOAS (Air Mass Corrected Differential Absorption
Spec-10
troscopy) method used to retrieve TWVC from SCIAMACHY (Scanning and Imaging Absorption Spectrometer for Atmospheric Chartography) measurements in the visible spectral range (Noël et al., 2004). du Piesanie et al. (2013) checked this correction
method by means of a detailed analysis of the sounding-satellite differences as a
func-tion of cloud fracfunc-tion, cloud optical thickness and cloud top height. They showed no 15
significant dependencies with the former two cloud properties, but found a strong de-pendence when investigating the bias as a function of cloud top height.
Although the GDP retrieval algorithm provides a “H2O flag” for heavy cloudy condi-tions that invalidates the AMF determination and, consequently, the retrieved TWVC data, it does not apply any cloud correction method for the remaining cloudy cases 20
(Valks et al., 2013). Therefore, it is expected that the TWVC data derived from the GDP algorithm presents a larger dependence on cloud properties than other satellite retrieval algorithms with some implemented cloud correction method.
4.4 Dependence of the differences on reference TWVC data
Figure 7 shows the relative differences between sounding and satellite data as a
func-25
AMTD
7, 9573–9601, 2014Validation of GOME-2/MetOp-A total water vapour
column
M. Antón et al.
Title Page
Abstract Introduction
Conclusions References
Tables Figures
◭ ◮
◭ ◮
Back Close
Full Screen / Esc
Printer-friendly Version Interactive Discussion
Discussion
P
a
per
|
Discus
sion
P
a
per
|
Discussion
P
a
per
|
Discussion
P
a
per
|
small TWVC values (below 10 mm) and a clear underestimation for large TWVC val-ues (above 50 mm). For TWVC valval-ues between 10 and 50 mm, the GOME-2 underesti-mates the GRUAN data, increasing this underestimation with increasing TWVC values.
For instance, for all cases, the relative differences changes from+10 % for small TWVC
values to−20 % for large TWVC values. The bottom plot shows that the
overestima-5
tion observed for TWVC below 10 mm is mainly due to high SZA values, which most of them corresponds with high latitude stations where the TWVC values are generally small. By contrast, the underestimation for TWV above 30 mm is exclusively related to
SZA<50◦.
One should bear in mind that reference TWVC data have some uncertainties, which 10
could partially explain the satellite-sounding differences. To analyze this influence, we
use the “correlated uncertainty” (u_cor_rh) of the humidity profile data (rh) provided by the RS92-GDP, which represents one sigma (i.e., one standard deviation from the mean) and includes the calibration uncertainty and the radiation correction uncertainty (Immler and Sommer, 2010; Dirksen et al., 2014). For each profile, a relative error as-15
sociated with the corresponding TWVC is obtained as the weighted average of the ratio of u_cor_rh to rh based on the contribution of each layer to the TWVC. The mean value of the relative errors determined for the 1400 sounding analyzed in this work is 3.5 %, which highlights the high quality of the reference GRUAN TWVC data. The analysis of
the satellite-sounding differences against the TWVC relative errors exhibits no
signifi-20
cant dependence (not shown), which evidence that the uncertainties of reference data
are negligible compared with the effects shown in Fig. 7. This result can be extended
to the dependences shown in the previous subsections. Overall, the uncertainties re-lated to the satellite data are the main responsible for explaining the satellite-sounding
differences found in this work.
AMTD
7, 9573–9601, 2014Validation of GOME-2/MetOp-A total water vapour
column
M. Antón et al.
Title Page
Abstract Introduction
Conclusions References
Tables Figures
◭ ◮
◭ ◮
Back Close
Full Screen / Esc
Printer-friendly Version Interactive Discussion
Discussion
P
a
per
|
Discus
sion
P
a
per
|
Discussion
P
a
per
|
Discussion
P
a
per
|
5 Conclusions
Several relevant conclusions can be drawn from the detailed validation of GOME-2 TWVC data against reference balloon-borne measurements from GRUAN network pre-sented in this paper:
1. There is a strong interrelationship between the viewing geometry and cloud pa-5
rameters and, hence, their influence on the satellite-sounding TWVC differences must
be analyzed jointly.
2. Although heavy cloudy conditions were removed from the analysis using the “H2O flag” provide by the satellite algorithm, the remaining cloudy cases cause a significant bias in the satellite-sounding inter-comparison. Thus, the clouds that cover the satellite 10
pixel produces, as expected, a remarkable underestimation of the GOME-2 TWVC data compared with the cloud-free satellite scenes. For instance, the mean relative
differences with respect to the reference balloon-borne data change from+7 %
(cloud-free cases) to −2.5 % (all sky conditions). Additionally, it must be noted the strong
negative dependence found between the relative differences and the satellite cloud top
15
albedo.
3. For both cloud-free and cloudy cases, the satellite-sounding differences exhibit
a stable behaviour with respect to the SZA for values below 50◦. However, from this
zenith angle, a strong positive dependence is found. Thus, for example, the relative
differences under cloud-free conditions vary between +3 % (SZA of 50◦) and +28 %
20
(SZA of 70◦). This SZA dependence causes a systematic seasonal dependence and
could be associated with inaccuracies in the level 1B (calibrated radiances) and/or with the geometrical correction factor applied to obtain the AMF of the water vapour using the GDP retrieval algorithm.
4. The empirical correction introduced in the new GDP 4.7 version to remove the 25
scan angle dependency for the outermost west pixels in the GOME-2 TWVC data is
AMTD
7, 9573–9601, 2014Validation of GOME-2/MetOp-A total water vapour
column
M. Antón et al.
Title Page
Abstract Introduction
Conclusions References
Tables Figures
◭ ◮
◭ ◮
Back Close
Full Screen / Esc
Printer-friendly Version Interactive Discussion
Discussion
P
a
per
|
Discus
sion
P
a
per
|
Discussion
P
a
per
|
Discussion
P
a
per
|
and reference balloon-borne data vary from+20 % for the previous GDP 4.6 version to
+3 % for the current GDP 4.7 version.
5. The satellite-sounding differences show a strong negative dependence on the
reference TWVC values, varying from+10 % (TWVC below 10 mm) to −20 % (TWVC
above 50 mm). The overestimation found for small TWVC values can be mainly related 5
to cases with high SZA values.
Overall, a continuous validation effort of the operational GOME-2 TWVC data using
independent measurements from reliable instruments is required in order to assess its accuracy and quality.
Acknowledgements. The GOME-2/MetOp-A products were generated at DLR under the
aus-10
pices of the O3MSAF project funded by EUMETSAT and national contributions. The sound-ing measurements used in this study have been provided by the GCOS Reference Upper-Air Network (GRUAN). This work has been partially supported by Ministerio de Ciencia e Inno-vacion under project CGL2011-29921-C02-01. Manuel Antón thanks Ministerio de Ciencia e Innovación and Fondo Social Europeo for the award of a postdoctoral grant (Ramon y
Ca-15
jal). Financial support to the University of Valladolid was provided by the Spanish MINECO (Ref. Projects CGL2011-23413 and CGL2012-33576).
References
Antón, M. and Loyola, D.: Influence of cloud properties on satellite total ozone observations, J. Geophys. Res., 116, D03208, doi:10.1029/2010JD014780, 2011.
20
Bauer, P. and Schlüssel, P.: Rainfall, total water, ice water, and water vapor over sea from polarized microwave simulations and Special Sensor Microwave/Imager data, J. Geophys. Res., 98, 20737–20759, 1993.
Burrows, J. P., Weber, M., Buchwitz, M., Razonov, V., Ladstatter, A., Richter, A., De Beerk, R., Hoogen, R., Bramsdted, D., Eichmann, K. U., Eisenger, M., and Perner, D.: The Global Ozone
25
Monitoring Experiment (GOME): mission concept and first scientific results, J. Atmos. Sci., 56, 151–175, 1999.
AMTD
7, 9573–9601, 2014Validation of GOME-2/MetOp-A total water vapour
column
M. Antón et al.
Title Page
Abstract Introduction
Conclusions References
Tables Figures
◭ ◮
◭ ◮
Back Close
Full Screen / Esc
Printer-friendly Version Interactive Discussion
Discussion
P
a
per
|
Discus
sion
P
a
per
|
Discussion
P
a
per
|
Discussion
P
a
per
|
Deeter, M.: A new satellite retrieval method for precipitable water vapor over land and ocean, Geophys. Res. Lett., 34, L02815, doi:10.1029/2006GL028019, 2007.
Dirksen, R. J., Sommer, M., Immler, F. J., Hurst, D. F., Kivi, R., and Vömel, H.: Reference quality upper-air measurements: GRUAN data processing for the Vaisala RS92 radiosonde, Atmos. Meas. Tech. Discuss., 7, 3727–3800, doi:10.5194/amtd-7-3727-2014, 2014.
5
Durre, I., Williams, C. N., Yin, X., and Vose, R. S.: Radiosonde-based trends in precip-itable water over the Northern Hemisphere: an update, J. Geophys. Res., 114, D05112, doi:10.1029/2008JD010989, 2009.
du Piesanie, A., Piters, A. J. M., Aben, I., Schrijver, H., Wang, P., and Noël, S.: Validation of two independent retrievals of SCIAMACHY water vapour columns using radiosonde data, Atmos.
10
Meas. Tech., 6, 2925–2940, doi:10.5194/amt-6-2925-2013, 2013.
Edwards, P. G., Berruti, B., Blythe, P., Callies, J., Carlier, S., Fransen, C., Krutsch, R., Lefeb-vre, A.-R., Loiselet, M., and Stricker, N.: The MetOp satellite – weather information from polar orbit, ESA Bull.-Eur. Space, 127, 8–17, 2006.
Grossi, M., Kalakoski, N., and Valks, P.: O3M SAF ORR Validation Report, 20
15
SAF/O3M/DLR/ORR/H2O, Issue 01/2013, 2013.
Grossi, M., Valks, P., Loyola, D., Aberle, B., Slijkhuis, S., Wagner, T., Beirle, S., and Lang, R.: Total column water vapour measurements from GOME-2 MetOp-A and MetOp-B, Atmos. Meas. Tech. Discuss., 7, 3021–3073, doi:10.5194/amtd-7-3021-2014, 2014.
Hartmann, D. L., Klein Tank, A. M. G., Rusticucci, M., Alexander, L. V., Brönnimann, S.,
20
Charabi, Y., Dentener, F. J., Dlugokencky, E. J., Easterling, D. R., Kaplan, A., Soden, B. J., Thorne, P. W., Wild, M., and Zhai, P. M.: Observations: atmosphere and surface, in: Cli-mate Change 2013: The Physical Science Basis. Contribution of Working Group I to the Fifth Assessment Report of the Intergovernmental Panel on Climate Change, edited by: Stocker, T. F., Qin, D., Plattner, G.-K., Tignor, M., Allen, S. K., Boschung, J., Nauels, A.,
25
Xia, Y., Bex, V., and Midgley, P. M., Cambridge University Press, Cambridge, UK and New York, NY, USA, 2013.
Immler, F. J. and Sommer, M.: Brief Description of the RS92 GRUAN Data Product (RS92-GDP), GRUAN Tech. Document GRUAN-TD-4, 17 pp., available at: http://www.gruan.org (last access: 25 July 2014), 2011.
30
AMTD
7, 9573–9601, 2014Validation of GOME-2/MetOp-A total water vapour
column
M. Antón et al.
Title Page
Abstract Introduction
Conclusions References
Tables Figures
◭ ◮
◭ ◮
Back Close
Full Screen / Esc
Printer-friendly Version Interactive Discussion
Discussion
P
a
per
|
Discus
sion
P
a
per
|
Discussion
P
a
per
|
Discussion
P
a
per
|
Kalakoski, N., Wagner, T., Mies, K., Beirle, S., Slijkhuis, S., and Loyola, D.: O3M SAF Validation Report, Offline Total Water Vapour, SAF/O3M/FMI/VR/H2O/111, 2011.
Kaufman, Y. and Gao, B.: Remote sensing of water vapor in the near IR from EOS/MODIS, IEEE T. Geoscience Remote, 30, 871–884, 1992.
Koelemeijer, R. B. A. and Stammes, P.: Effects of clouds on ozone column retrieval from GOME
5
UV measurements, J. Geophys. Res., 104, 8281–8294, 1999.
Kokhanovsky, A. A. and Rozanov, V. V.: The uncertainties of satellite DOAS total ozone retrieval for a cloudy sky, Atmos. Res., 87, 27–36, doi:10.1016/j.atmosres.2007.04.006, 2008. Kokhanovsky, A. A., Mayer, B., Rozano, V. V., Wapler, K., Lamsal, L. N., Weber, M.,
Bur-rows, J. P., and Schumann, U.: The influence of broken cloudiness on cloud top height
10
retrievals using nadir observations of backscattered solar radiation in the oxygen A-band, J. Quant. Spectrosc. Ra., 103, 460–477, doi:10.1016/j.jqsrt.2006.06.003, 2007.
Lang, R., Casadio, S., Maurellis, A., and Lawrence, M.: Evaluation of the GOME water vapor climatology 1995–2002, J. Geophys. Res., 112, D17110, doi:10.1029/2006JD008246, 2007. Li, Z., Fielding, E. J., Cross, P., and Muller, J.-P.: Interferometric synthetic aperture radar
at-15
mospheric correction: MEdium Resolution Imaging Spectrometer and Advanced Synthetic Aperture Radar integration, Geophys. Res. Lett., 33, L06816, doi:10.1029/2005GL025299, 2006.
Loyola, D., Thomas, W., Livschitz, Y., Ruppert, T., Albert, P., and Hollmann, R.: Cloud properties derived from GOME/ERS-2 backscatter data for trace gas retrieval, IEEE T. Geosci. Remote,
20
30, 2747–2758, 2007.
Loyola, D., Koukouli, M. E., Valks, P., Balis, D. S., Hao, N., Van Roozendael, M., Spurr, R. J. D., Zimmer, W., Kiemle, S., Lerot, C., and Lambert, J.-C.: The GOME-2 total column ozone product: retrieval algorithm and ground-based validation, J. Geophys. Res., 116, D07302, doi:10.1029/2010JD014675, 2011.
25
Maurellis, A., Lang, R., van der Zande, W., Aben, I., and Ubachs, W.: Precipitable water column retrieval from GOME data, Geophys. Res. Lett., 27, 903–906, 2000.
Mieruch, S., Noël, S., Bovensmann, H., and Burrows, J. P.: Analysis of global water vapour trends from satellite measurements in the visible spectral range, Atmos. Chem. Phys., 8, 491–504, doi:10.5194/acp-8-491-2008, 2008.
30
AMTD
7, 9573–9601, 2014Validation of GOME-2/MetOp-A total water vapour
column
M. Antón et al.
Title Page
Abstract Introduction
Conclusions References
Tables Figures
◭ ◮
◭ ◮
Back Close
Full Screen / Esc
Printer-friendly Version Interactive Discussion
Discussion
P
a
per
|
Discus
sion
P
a
per
|
Discussion
P
a
per
|
Discussion
P
a
per
|
Miloshevich, L. M., Vömel, H., Whiteman, D. N., Lesht, B. M., Schmidlin, F. J., and Russo, F.: Absolute accuracy of water vapor measurements from six operational radiosonde types launched during AWEX-G and implications for AIRS validation, J. Geophys. Res., 111, D09S10, doi:10.1029/2005JD006083, 2006.
Miloshevich, L. M., Vömel, H., Whiteman, D. N., and Leblanc, T.: Accuracy assessment and
5
correction of Vaisala RS92 radiosonde water vapor measurements, J. Geophys. Res., 114, D11305, doi:10.1029/2008JD011565, 2009.
Moradi, I., Soden, B., Ferraro, R., Arkin, P., and Vömel, H.: Assessing the quality of humidity measurements from global operational radiosonde sensors, J. Geophys. Res., 118, 8040– 8053, doi:10.1002/jgrd.50589, 2013.
10
Munro, R., Eisinger, M., Anderson, C., Callies, J., Corpaccioli, E., Lang, R., Lefebvre, A., Livs-chitz, Y., and Perez, A.: GOME-2 on METOP: from In-Orbit Verification to Routine Opera-tions, Paper Presented at Meteorological Satellite Conference, EUMETSAT, Helsinki, Fin-land, 2006.
Nash, J., Oakley, T., Vömel, H., and Wei, L.: WMO Intercomparison of High Quality Radiosonde
15
Systems, Tech. Rep. WMO/TD-No. 1580, World Meteorological Organization, 2011.
Noël, S., Buchwitz, M., Bovensmann, H., Hoogen, R., and Burrows, J.: Atmospheric water vapor amounts retrieved from GOME satellite data, Geophys. Res. Lett., 26, 1841–1844, 1999. Noël, S., Buchwitz, M., and Burrows, J. P.: First retrieval of global water vapour column amounts
from SCIAMACHY measurements, Atmos. Chem. Phys., 4, 111–125,
doi:10.5194/acp-4-20
111-2004, 2004.
Platt, U.: Differential optical absorption spectroscopy (DOAS), in: Air Monitoring by Spectro-scopic Techniques, vol. 127, Chem. Anal. Ser, edited by: Sigrist, W., John Wiley, New York, 22–85, 1994.
Pougatchev, N., August, T., Calbet, X., Hultberg, T., Oduleye, O., Schlüssel, P., Stiller, B.,
Ger-25
main, K. St., and Bingham, G.: IASI temperature and water vapor retrievals – error as-sessment and validation, Atmos. Chem. Phys., 9, 6453–6458, doi:10.5194/acp-9-6453-2009, 2009.
Ross, R. J. and Elliott, W. P.: Radiosonde-based Northern Hemisphere tropospheric water va-por trends, J. Climate, 14, 1602–1611, 2001.
30
AMTD
7, 9573–9601, 2014Validation of GOME-2/MetOp-A total water vapour
column
M. Antón et al.
Title Page
Abstract Introduction
Conclusions References
Tables Figures
◭ ◮
◭ ◮
Back Close
Full Screen / Esc
Printer-friendly Version Interactive Discussion
Discussion
P
a
per
|
Discus
sion
P
a
per
|
Discussion
P
a
per
|
Discussion
P
a
per
|
upper-air observations for climate: rationale, progress, and plans, B. Am. Meteorol. Soc., 90, 361–369, 2009.
Schröder, M. and Schneider, N.: DUE GLOBVAPOUR Product Validation Report (PVR) Cross-Comparison, Issue 1, Revision 1, 21 August 2012, 2012.
Valks, P., Loyola, D., Hao, N., Rix, M., and Slijkhuis, S.: Algorithm Theoretical Basis Document
5
for GOME-2 Total Column Products of Ozone, Minor Trace Gases and Cloud Properties (GDP 4.5 for O3M-SAF OTO and NTO), DLR/GOME-2/ATBD/01, Iss./Rev.: 2/H, 2013. Vömel, H., Selkirk, H., Miloshevich, L., Valverde-Canossa, J., Valds, J., Kyrö, E., Kivi, R.,
Stolz, W., Peng, G., and Diaz, J. A.: Radiation dry bias of the Vaisala RS92 humidity sensor, J. Atmos. Ocean. Tech., 24, 953–963, 2007.
10
Wagner, T., Beirle, S., Grzegorski, M., and Platt, U.: Global trends (1996–2003) of total col-umn precipitable water observed by Global Ozone Monitoring Experiment (GOME) on ERS-2 and their relation to near-surface temperature, J. Geophys. Res., 111, D12102, doi:10.1029/2005JD006523, 2006.
Wang, J. and Zhang, L.: Systematic errors in global radiosonde precipitable water data
15
AMTD
7, 9573–9601, 2014Validation of GOME-2/MetOp-A total water vapour
column
M. Antón et al.
Title Page
Abstract Introduction
Conclusions References
Tables Figures
◭ ◮
◭ ◮
Back Close
Full Screen / Esc
Printer-friendly Version Interactive Discussion
Discussion
P
a
per
|
Discus
sion
P
a
per
|
Discussion
P
a
per
|
Discussion
P
a
per
|
Table 1. GRUAN stations with available sounding data within 100 km and 120 min GOME-2
overpass.
GRUAN station Lat. Lon. Alt. (m) Num. soundings
AMTD
7, 9573–9601, 2014Validation of GOME-2/MetOp-A total water vapour
column
M. Antón et al.
Title Page
Abstract Introduction
Conclusions References
Tables Figures
◭ ◮
◭ ◮
Back Close
Full Screen / Esc
Printer-friendly Version Interactive Discussion
Discussion
P
a
per
|
Discus
sion
P
a
per
|
Discussion
P
a
per
|
Discussion
P
a
per
|
Table 2.Parameters obtained in the correlation analysis between GOME-2 TWVC data and
GRUAN radiosonding measurements during the period 2009–2014. Upper (lower) rows show the parameters obtained for all-sky (cloud-free) conditions.
N Slope R2 RMSE (%) MBE (%) MABE (%)
CAB 90 0.90±0.06 0.70 35 −11.6±2.7 22.3±1.8
13 0.89±0.05 0.96 16 +6.0±3.8 12.5±2.2
SGP 619 0.89±0.02 0.89 19 +3.4±0.8 15.3±0.5
407 1.09±0.01 0.95 14 +7.3±0.7 12.8±0.5
LIN 115 1.04±0.06 0.70 35 −8.9±2.5 23.4±1.5
14 1.08±0.09 0.95 10 −6.4±2.4 8.4±1.9
NYA 197 1.17±0.04 0.84 25 −11.1±1.4 19.4±0.9
1 – – – – –
SOD 118 1.02±0.05 0.79 38 −6.5±2.6 22.7±1.7
4 – – – – –
TAT 260 1.17±0.02 0.91 33 −2.1±1.7 22.7±1.0
105 1.14±0.03 0.95 26 +8.1±2.6 20.8±1.9
AMTD
7, 9573–9601, 2014Validation of GOME-2/MetOp-A total water vapour
column
M. Antón et al.
Title Page
Abstract Introduction
Conclusions References
Tables Figures
◭ ◮
◭ ◮
Back Close
Full Screen / Esc
Printer-friendly Version Interactive Discussion
Discussion
P
a
per
|
Discus
sion
P
a
per
|
Discussion
P
a
per
|
Discussion
P
a
per
|
0 10 20 30 40 50 60 70
0
10
20
30
40
50
60
70
GOME−2 TWVC (mm)
GRUAN TWVC (mm)
All cases
R²=0.89 RMSE=27%
0 10 20 30 40 50 60 70
0
10
20
30
40
50
60
70
GOME−2 TWVC (mm)
GRUAN TWVC (mm)
Cloud−free cases
R²=0.95 RMSE=16%
Figure 1. GRUAN TWVC against GOME-2 TWVC data for all-sky conditions (top plot) and
AMTD
7, 9573–9601, 2014Validation of GOME-2/MetOp-A total water vapour
column
M. Antón et al.
Title Page
Abstract Introduction
Conclusions References
Tables Figures
◭ ◮
◭ ◮
Back Close
Full Screen / Esc
Printer-friendly Version Interactive Discussion
Discussion
P
a
per
|
Discus
sion
P
a
per
|
Discussion
P
a
per
|
Discussion
P
a
per
|
20 30 40 50 60 70 80
−40
−20
0
20
40
Satellite SZA (º)
Difference GOME−2 − GRUAN (%)
All cases
Cloud−free cases Cloudy cases
Figure 2.Differences between TWVC data retrieved by GOME-2 and GRUAN sounding data
AMTD
7, 9573–9601, 2014Validation of GOME-2/MetOp-A total water vapour
column
M. Antón et al.
Title Page
Abstract Introduction
Conclusions References
Tables Figures
◭ ◮
◭ ◮
Back Close
Full Screen / Esc
Printer-friendly Version Interactive Discussion
Discussion
P
a
per
|
Discus
sion
P
a
per
|
Discussion
P
a
per
|
Discussion
P
a
per
|
−40 −20 0 20 40
−40
−20
0
20
40
Satellite VZA (º)
Difference GOME−2 − GRUAN (%)
All sky conditions Cloud−free cases Cloudy cases
Figure 3.Differences between TWVC data retrieved by GOME-2 and GRUAN sounding data
AMTD
7, 9573–9601, 2014Validation of GOME-2/MetOp-A total water vapour
column
M. Antón et al.
Title Page
Abstract Introduction
Conclusions References
Tables Figures
◭ ◮
◭ ◮
Back Close
Full Screen / Esc
Printer-friendly Version Interactive Discussion
Discussion
P
a
per
|
Discus
sion
P
a
per
|
Discussion
P
a
per
|
Discussion
P
a
per
|
0 20 40 60 80 100
−40
−30
−20
−10
0
10
20
Satellite Cloud Fraction (%)
Difference GOME−2 − GRUAN (%)
All SZA SZA < 50 SZA > 50
Figure 4.Differences between TWVC data retrieved by GOME-2 and GRUAN sounding data
AMTD
7, 9573–9601, 2014Validation of GOME-2/MetOp-A total water vapour
column
M. Antón et al.
Title Page
Abstract Introduction
Conclusions References
Tables Figures
◭ ◮
◭ ◮
Back Close
Full Screen / Esc
Printer-friendly Version Interactive Discussion
Discussion
P
a
per
|
Discus
sion
P
a
per
|
Discussion
P
a
per
|
Discussion
P
a
per
|
0.2 0.4 0.6 0.8 1.0
−40
−30
−20
−10
0
10
20
Satellite Cloud Top Albedo
Difference GOME−2 − GRUAN (%)
All SZA SZA < 50 SZA > 50
Figure 5.Differences between TWVC data retrieved by GOME-2 and GRUAN sounding data
AMTD
7, 9573–9601, 2014Validation of GOME-2/MetOp-A total water vapour
column
M. Antón et al.
Title Page
Abstract Introduction
Conclusions References
Tables Figures
◭ ◮
◭ ◮
Back Close
Full Screen / Esc
Printer-friendly Version Interactive Discussion
Discussion
P
a
per
|
Discus
sion
P
a
per
|
Discussion
P
a
per
|
Discussion
P
a
per
|
600 700 800 900 1000
−40
−30
−20
−10
0
10
20
Satellite Cloud Top Pressure (mb)
Difference GOME−2 − GRUAN (%)
All SZA SZA < 50 SZA > 50
Figure 6.Differences between TWVC data retrieved by GOME-2 and GRUAN sounding data
AMTD
7, 9573–9601, 2014Validation of GOME-2/MetOp-A total water vapour
column
M. Antón et al.
Title Page
Abstract Introduction
Conclusions References
Tables Figures
◭ ◮
◭ ◮
Back Close
Full Screen / Esc
Printer-friendly Version Interactive Discussion
Discussion
P
a
per
|
Discus
sion
P
a
per
|
Discussion
P
a
per
|
Discussion
P
a
per
|
0 10 20 30 40 50 60
−40
−30
−20
−10
0
10
20
GRUAN TWVC (mm)
Difference GOME−2 − GRUAN (%)
All cases Cloud−free cases Cloudy cases
0 10 20 30 40 50 60
−40
−30
−20
−10
0
10
20
GRUAN TWVC (mm)
Difference GOME−2 − GRUAN (%)
All cases SZA < 50 SZA > 50
Figure 7.Differences between GOME-2 and GRUAN sounding data as function of the GRUAN