Across Scale: Implications for the Evolution of Filter
Feeding and the Limits to Maximum Body Size
Jean Potvin1*, Jeremy A. Goldbogen2, Robert E. Shadwick3
1Department of Physics, Saint Louis University, Saint Louis, Missouri, United States of America,2Cascadia Research Collective, Olympia, Washington, United States of America,3Department of Zoology, University of British Columbia, Vancouver, British Columbia, Canada
Abstract
Bulk-filter feeding is an energetically efficient strategy for resource acquisition and assimilation, and facilitates the maintenance of extreme body size as exemplified by baleen whales (Mysticeti) and multiple lineages of bony and cartilaginous fishes. Among mysticetes, rorqual whales (Balaenopteridae) exhibit an intermittent ram filter feeding mode, lunge feeding, which requires the abandonment of body-streamlining in favor of a high-drag, mouth-open configuration aimed at engulfing a very large amount of prey-laden water. Particularly while lunge feeding on krill (the most widespread prey preference among rorquals), the effort required during engulfment involve short bouts of high-intensity muscle activity that demand high metabolic output. We used computational modeling together with morphological and kinematic data on humpback (Megaptera noveaangliae), fin (Balaenoptera physalus), blue (Balaenoptera musculus) and minke (Balaenoptera acutorostrata) whales to estimate engulfment power output in comparison with standard metrics of metabolic rate. The simulations reveal that engulfment metabolism increases across the full body size of the larger rorqual species to nearly 50 times the basal metabolic rate of terrestrial mammals of the same body mass. Moreover, they suggest that the metabolism of the largest body sizes runs with significant oxygen deficits during mouth opening, namely, 20% over maximumVV O_ 2at the size of the largest blue whales, thus requiring significant contributions from anaerobic catabolism during a lunge and significant recovery after a lunge. Our analyses show that engulfment metabolism is also significantly lower for smaller adults, typically one-tenth to one-halfVV O_ 2 maxj . These results not only point to a physiological limit on maximum body size in this lineage, but also have major implications for the ontogeny of extant rorquals as well as the evolutionary pathways used by ancestral toothed whales to transition from hunting individual prey items to filter feeding on prey aggregations.
Citation:Potvin J, Goldbogen JA, Shadwick RE (2012) Metabolic Expenditures of Lunge Feeding Rorquals Across Scale: Implications for the Evolution of Filter Feeding and the Limits to Maximum Body Size. PLoS ONE 7(9): e44854. doi:10.1371/journal.pone.0044854
Editor:Andreas Fahlman, Texas A&M University-Corpus Christi, United States of America
ReceivedJune 15, 2012;AcceptedAugust 8, 2012;PublishedSeptember 14, 2012
Copyright:ß2012 Potvin et al. This is an open-access article distributed under the terms of the Creative Commons Attribution License, which permits unrestricted use, distribution, and reproduction in any medium, provided the original author and source are credited.
Funding:J. Goldbogen was supported by funding from the United States Navy and Office of Naval Research awarded to J. Calambokidis and Cascadia Research Collective. R. Shadwick was funded by the Natural Sciences and Engineering Research Council of Canada (NSERC). The funders had no role in study design, data collection and analysis, decision to publish, or preparation of the manuscript.
Competing Interests:The authors have declared that no competing interests exist.
* E-mail: [email protected]
Introduction
The extreme body size of baleen whales (Mysticeti) is generally attributed to the overall energetic efficiency of bulk filter feeding [1]. Instead of hunting single prey items which is typified by the raptorial and suction feeding strategies in toothed whales (Odontoceti), baleen whales are obligate suspension filter feeders that engulf large quantities of prey-laden water. By processing vast amounts of small prey in bulk, baleen whales are thought to reap the rewards of an abundant resource using a more efficient feeding mechanism [2,3]. However, the energetics of foraging in cetaceans has yet to be fully assessed, especially with respect to microphagy in large mysticetes. Considering that some baleen whale species represent the largest animals to have ever lived, exploring the metabolic expenditures of feeding in baleen whales may shed light on the evolution of gigantism as well as the potential energetic limits to body size.
Baleen whales exhibit a variety of filter feeding mechanisms, with distinct modes occurring in different mysticete lineages [2,4].
the depth and quality of the krill patch, several lunge feeding sequences of pre-approach, engulfment and filtering/recovery may be repeated during a single dive.
Lunge feeding requires a coordinated suite of anatomical and biomechanical adaptations [9,16]. In addition to the foldable (and muscularized) ventral pouch [17–19], the rorqual engulfment apparatus is comprised of flexible jaw joints that enable the rotation of the mandibles, which directly increase the area of the mouth [20,21] and therefore the flux of water into the oropharyngeal cavity [22]. The engulfment capacity of the ventral pouch is ultimately limited by the mechanical properties of the ventral groove blubber (VGB), a specialized blubber layer that is reversibly extensible up to several times its resting length [19]. Both the hard and soft tissue structures of the engulfment apparatus exhibit positive allometry, whereby the dimensions of these elements are relatively longer in larger animals [23]. As a consequence, mass-specific engulfment capacity increases with body size both within and among rorqual species [24]. Because larger rorquals have the ability to engulf relatively larger volumes of prey-laden water, overall feeding efficiency is significantly increased in larger whales [25].
Hydrodynamic modeling of engulfment parameterized with kinematic and morphological data indicates that lunge feeding comes at high energetic costs which are largely incurred from the engulfment and entrainment of a very large amount of water [25– 27]. Such high energetic expenditures are significant enough to greatly reduce, in comparison with non lunge-feeding whales of similar size, the diving time in which foraging occurs [28]. This phenomenon has previously been addressed in the context of the
Theoretical Aerobic Dive Limit(TADL), which is largely a function of the ratio of the metabolic expenditures during a dive to the oxygen storage capacity in blood, muscle and lungs [24,28,29]. What TADL doesn’t explain, however, is the fact that even though all large rorquals have similar maximal foraging diving times, namely, anywhere from 9 to 11 min. in humpback (Megaptera noveaangliae), fin (Balaenoptera physalus) and blue (Balaenoptera musculus) whales [24], their capacity to execute many lunges during a single dive declines significantly with body size, i.e., from 12, to 7, to 4 lunges per dive in those same three species respectively [24]. Although there appears to be enough oxygen storage capacity to meet the energetic demands of foraging at all body sizes and to the same depths, there seems to be a more proximate limit associated with the lunge component of foraging at the largest sizes, in particular with therateof energy expenditure during the engulfment stage. Here we explore the hypothesis that reduced lunge frequency at the larger sizes is, at least for these three large Rorqual species, a reflection of the metabolic power requirements of engulfment becoming so high to involve significant oxygen deficits and muscle fatigue during each lunge. Such increased power requirements follow from the allometry of the skull which permits the engulfment of ever greater masses of water and prey (relative to body mass [23]) and at greater energetic costs, but as performed over nearly unchanging engulfment durations constrained by the escape time scales of the prey [27]. Reduced diving capacity and lunge frequency during foraging has major consequences for rorqual ecology and evolution because it begins to decrease the prime benefit of bulk feeding, namely a high energetic efficiency, by limiting access duration to high quality prey resources at depth [25].
Understanding the relative importance of total energetic expenditures versus power output (the rate of expenditure) requires the consideration of the various time scales characterizing the stages of a lunge. Within the context of a single foraging dive where durations and expenditures for diving, prey-approach,
engulfment and filtering/recovery are all accounted for, the (averaged) metabolic rates and corresponding energetic expendi-tures are found to be only slightly higher than those of steady swimming [25]. When extrapolated over several months of intense foraging during the summer, these power requirements of foraging are still low compared to the rate of energy intake such that it facilitates the deposition of substantial lipid stores needed for long distance migration and reproduction [30]. However, and at the smaller time scale of the engulfment stage (of about 10 seconds or less), there is a requirement for short bouts of intense muscle activity and for a metabolic output during which a large body of water (both external and internal) needs to be quickly set into motion, a process for which muscle fatigue and consequent recovery may become a limitation. Although previous research has focused on estimating the energetic cost of lunge feeding [24,25,27], scant attention has been paid to the power output required by this extreme feeding strategy. As a result, both its ecological and evolutionary implications remain poorly under-stood. Here we address this dearth in our knowledge of rorqual foraging energetics with a new, high time-resolved hydro-mechanical model based on previous work [26,27], but now capable of accurately distinguishing the changing physics of the various sub-stages of engulfment.
The obvious impossibility of studying the energetics of large whales in a laboratory setting makes computer modeling the only tool available for assessing the relevant factors driving the metabolic requirements of engulfment. These include the work done by the locomotor muscles for swimming and by the musculature embedded in the VGB for accelerating the engulfed water mass. An additional factor is the large amount of energy a whale typically loses to hydrodynamic drag. Given the substantial speeds imparted to the engulfed mass, and the need for coordinating the dynamics of a lunge in order to optimize engulfment volume [26], engulfment modeling must also include a hydrodynamic model that is coupled to the forces generated by VGB musculature. Here we quantify the effects of these factors over the adult sizes of humpback, fin and blue whales, as well as at one size of the much smaller minke whale (Balaenoptera acutorostrata), all investigated at a level of detail that we believe yields the correct physics across all body sizes and over the time scales of prey escape and engulfment [27]. This model now accounts for the water being engulfed anterior to the temporomandibular joint (TMJ) in between the mandibles, in addition to the water engulfed posterior to the TMJ [26], as well as the effects arising from the wake re-contacting a decelerating whale during mouth closure. The new model thus removes some of the uncertainties that required input sensitivity analyses in previous studies [24,25] and which inevitably reduced the prediction ability of the model.
with the BMR of terrestrial mammals of the same mass (BMR(terr)), an increase from about 8 BMR(terr) at 8 m body lengths, to 48 BMR(terr) at 27 m. When further compared in terms of maximum aerobic capacityVV O_ 2 maxj (as represented by the
Maximum Metabolic Rate (MMR)), the magnitude of maximum
instantaneous EMR suggests substantial oxygen deficits at the largest body sizes (27 m), with expenditure rates exceeding
_ V
V O2 maxj by 20% during a good portion the mouth opening stage. Characterized as asupramaximaltype of effort [31], we suggest that such expenditure levels can only be met by significant contribu-tions of anaerobic metabolism for which muscular fatigue is more important and metabolic recovery longer (i.e., recovery after each lunge during filtering and after each dive). Interestingly, a simulated 33 m blue whale shows required power outputs as high as 80% aboveVV O_ 2 maxj , and maintained over durations that are long enough to explain why it is perhaps non-extant. On the other hand, engulfment metabolism requires significantly lower outputs, namely 0.1 to 0.5VV O_ 2 maxj , at the small body sizes of all three large species and at the one simulated size of the minke whale, the smallest of the Rorquals (with body lengths of less than 10 m). As often characterized as light submaximal and heavy submaximal [31], such effort levels can be sustained for longer periods of activity and over several lunges during a single dive. These drastically reduced metabolic demands at smaller body sizes are similar to those of non-feeding swimming, and bring about interesting questions about the ontogeny of extant rorquals, as well as the evolution and physiological limits to different lunge feeding modes.
Materials and Methods
Engulfment metabolic rate calculations are based on a simulation of the forces at play during mouth opening and closure. Determination of the metabolic rates follows after tallying the corresponding (mechanical) energy and power while taking into account assumed metabolic efficiencies. The hydrodynamic model used for engulfment simulations, theBasic Lunge Feeding model
(or BLF for short; version 3.0), is a significant upgrade of a model originally devised a few years ago [26,27]. Although the BLF dynamically couples both structure (whale) and fluid (flow), its one-dimensional fluid dynamics and simple (bulk) VGB force modeling makes it far less complex than computationally detailed models where changing body shape morphometrics is digitized into structure meshes about which three-dimensional fluid simulations are performed [32], or for which structural (elastic) strains are computed with finite element methods [33]. Simplicity is allowed here by the physics of lunge feeding, where most of the relevant fluid masses being displaced are moving in only one direction, i.e., forward, along the whale’s trajectory. Moreover, the fluid-pushing forces supplied by the whale’s VGB are active pulls by muscles of (quantitatively) unknown distributions and densities, rather than elastic-based strains of a well-defined rigid structure (the skeleton). The general principles, upgrades and approximations of the BLF model will be summarized in the following paragraphs and its mathematics discussed in Modeling Details (which follows the
Conclusion). Estimates of the metabolic output sustained during prey-approach, as well as that of the active metabolic rate specific to Rorquals, will also be discussed below while the filter/recovery metabolic rates will be described in the Discussion. A list of the symbols and acronyms can be found in Text S1.
Hydrodynamic Model
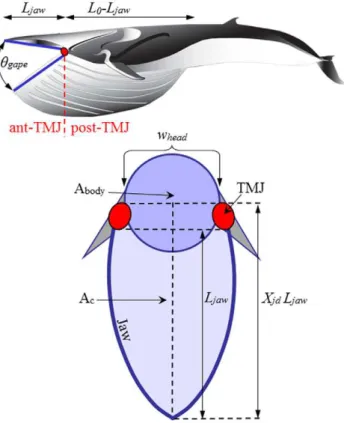
Input parameters and scope. The BLF is informed by a variety of inputs, including six entries based on the known morphology of the VGB and skull (Figure 1 and Tables 1, 2, 3, 4).
On the other hand, one table input, as well as the validation of the speeds calculated at each species’ average body size, have relied on the velocity data collected by tags deployed on humpback, fin and blue whales lunging at depth along horizontal or inclined tracks (both ‘‘uphill’’ or ‘‘downhill’’ tracks; see discussions in [11,25, 34,35]). Finally, the overall sequence of body shapes being simulated [26,27] is similar to what is shown in the film and photographic record of rorquals feeding on krill at or near the surface. Although these data provide many useful insights, they obviously limit the applicability of the model to lunges towards slow-moving prey along horizontal or straight but inclined trajectories. As observed with many rorqual species, lunge-feeding is a plastic behavior where diverse combinations of lunge speeds, body-rolling maneuvers, motion headings and gape angle dynamics are used to exploit different prey types and distributions [10,11], including the bubble-netting technique used by hump-back whales to lunge-feed vertically towards fish [12]. However, the types of lunges discussed here represent the most common foraging strategy among rorquals and consequently their simula-tions should provide a realistic assessment of engulfment energetics.
Synchronized engulfment. The model uses the (coupled) Newtonian motion equations of the whale body and engulfed water, as constrained by an engulfment scenario in which, and as suggested by the film record, the filling of the cavity sections posterior and anterior to the TMJ are sequential rather than simultaneous (see Diagram 1 in [27]). In what is described here as
Synchronized Engulfment(SE), a whale is assumed to first fill its cavity post-TMJ until maximum gape. This is followed, during mouth closure, by the filling of the buccal cavity anterior to the TMJ, as well as by the engulfed mass moving at the speed of the whale - a state of motion herein termed as equivelocity. Equivelocity is an
Figure 1. Dimensional characteristics of the mouth apparatus and ventral cavity.
important simulation constraint as it implies the absence of flows out of the cavity past the moment of maximum gape, as shown by the film record of surface lunges. On the other hand, the term ‘‘synchronized’’ in SE refers to the coordinated use of swimming muscles and engulfment apparatus (VGB muscles, temporalis, sternomandibularis) being individually modulated to ensure sequential cavity filling [27], possibly according to the inputs of a recently identified sensory organ located at the mandibular symphysis [16].
Computer simulations suggest that the expansion of the ventral pouch is actively resisted by the eccentric contraction of the VGB musculature [26] rather than passively by VGB elasticity [19]. The engulfed water is thus accelerated forward from inside the open mouth and therefore represents an additional source of drag (engulfment drag) to that generated by the flow deflected around the body (shape drag). This concept of active (captured) flow control is supported by photographic evidence showing the lack of sufficient VGB distension at mouth closure [36], suggesting that the VGB is not stretching enough to enter the high stiffness region of the stress-strain curve obtained duringin vitrotests on fin whale VGB [19]. We note, however, that VGB elasticity could play a minor role during and after engulfment as an energy absorber against the sloshing of engulfed water within the ventral pouch.
SE provides important constraints on body and fluid dynamics which simplifies the model without unduly compromising its accuracy. It provides also quantitative relationships among the model’s dynamical variables (such as engulfment duration), in terms of not only time and body dimensions but also of escape modes of the prey. These constraints and relationships are further discussed in [27] and summarized inModelingDetails.
Forces at Play
The BLF model is a numerical scheme that computes the accelerations and speeds of the whale’s body (ac and Vc) and its
engulfed mass (awand Vw) as both interact with each other and
with the surrounding fluid (Figure 2). The forces acting on the body consist in the following: the buccal cavity wall force (FBC),
which by virtue of Newton’s third law of motion is equal in magnitude to the engulfment component of hydrodynamic drag (FED); the so-called ‘‘shape’’ component of drag (FSD), arising from
the flow deflection around the whale’s body; the tail thrust force (Fthrust), and finally the weight-subtracted buoyancy force (Fext). The
forces acting on the engulfed mass include the forceFBCgenerated
within the buccal cavity walls and mostly acting on its posterior-most section; and the ‘‘ocean-to-engulfed mass’’ dragFww, acting
on its ocean-facing end (Figure 2). The latter parameterize the effects of fluid pressure buildup under the palate, where the moving engulfed mass is meeting a static ocean. We note that using the forceFBCacting in the bulk, rather than being unevenly
distributed in magnitude and direction over the surface of the VGB, is a drastic oversimplification of reality, but one allowed by the overall one-dimensional (and incompressible) character of the moving engulfed mass (Figure 2).
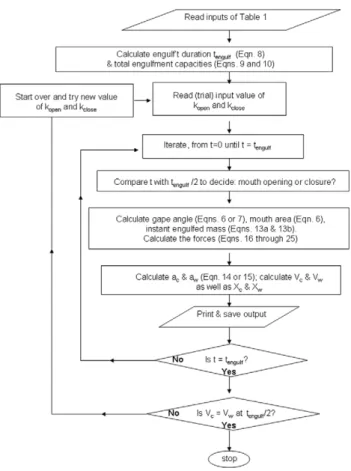
As shown in the flow chart of Figure 3, the BLF model simulates the full mouth-opening and closure sequence, beginning with the calculation (and prediction) of the duration of engulfment (tengulf;
see equation 8 below) and total engulfed volumetric capacities (equations 9 and 10). This information is then fed into an iteration scheme aimed at calculating the forces, accelerations and speeds applied to the engulfed mass and body via Newton’s 2ndlaw of motion, over each steps of a temporal sequence encompassing both mouth opening and closure. With the forces and speeds thus known, the mechanical work performed by each relevant force can be calculated at each time step and stored for the subsequent calculation of the metabolic rates.
Modeling Metabolic Power Output
Metabolic power expenditures during engulfment are calculated from the BLF-simulated forces and mechanical energies related to muscle use for swimming thrust (Fthrust) and buccal cavity push
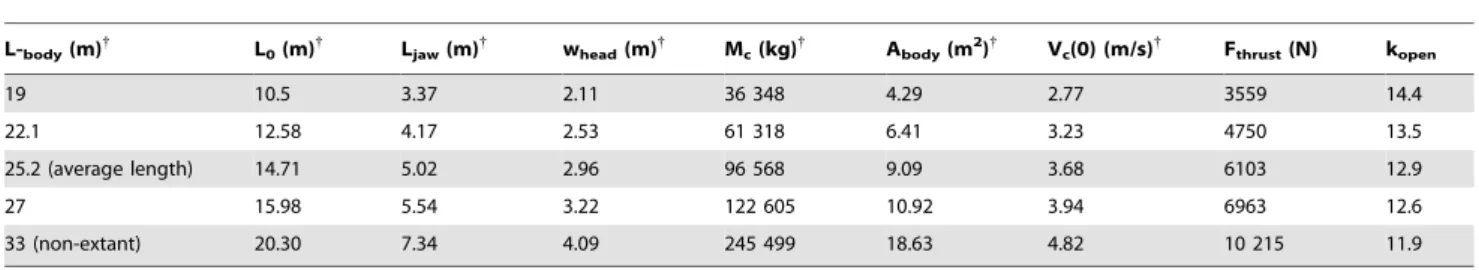
Table 1.BLF3 simulation inputs – blue whales.
L-body(m){
L0(m){
Ljaw(m){
whead(m){
Mc(kg){
Abody(m2){
Vc(0) (m/s){
Fthrust(N) kopen
19 10.5 3.37 2.11 36 348 4.29 2.77 3559 14.4
22.1 12.58 4.17 2.53 61 318 6.41 3.23 4750 13.5
25.2 (average length) 14.71 5.02 2.96 96 568 9.09 3.68 6103 12.9
27 15.98 5.54 3.22 122 605 10.92 3.94 6963 12.6
33 (non-extant) 20.30 7.34 4.09 245 499 18.63 4.82 10 215 11.9
{
References 24, 39, 55–62.
Inputs applying to all body lengths:rw = 1025 kg/m3, dt = 0.01 s,hgapemax = 78u, kam = 0.2, kopen/kclose = 1.83, CDopen = 0.3, CDclose = 0.5, CDbody = 0.05, Xjd = 1.00,C= 1.2, Vw(0) = 0 m/s,x= 1.0,Q= 1.6 (0#t#0.66 topen),Q= 0.0 (0.66 topen,t#tengulf). hsync is computed from Fsync/Xjd = (hgapemax/C) sin
hgapemax Ljaw/(L0 - Ljaw) (Potvin et al [27]).
L body = Body length; L0 = Length of the VGB; Ljaw = Length of the palate; whead = Width of the skull; Mc = Body mass; Abody = Mean cross section area of the (empty) body; Vc(0) = Whale speed at beginning of mouth opening; Fthrust = Fluking thrust during mouth opening (equation 20); kopen = Reaction constant (mouth opening). The symbols are further explained in the text or in Text S1.
doi:10.1371/journal.pone.0044854.t001
Figure 2. Forces acting on the whale body and engulfed mass.
(FBC) (or engulfment drag (FED)). Note that in Goldbogen et al.
[24], the expenditures were based on the consideration of total drag and swimming thrust accordingly to a scenario of shape drag possessing an active component (see Appendix S1 of that paper). The expended energy for each force is obtained by summing the incrementsDQT
mech
= FthrustDXcandDQVGB mech
=FBCDXcover all
steps of the simulation, with DXc corresponding to the distance
travelled during each time step (DXc =Vc(t) dt). The translation of
mechanical energy into metabolic energy is achieved by dividing the sumsgDQT
mech
andgDQVGB mech
by efficiency factors, namely by 0.15 and 0.25, respectively [24]. The 0.15 efficiency factor applied to swimming thrust takes into account both losses from muscle activity and propulsive inefficiency, namely 75% and 10%-loss of the total metabolic power generated respectively [37,38]; the 0.25 factor applied to gDQVGB
mech
accounts for the 75% metabolic losses incurred during VGB contractions. The rate of energy expenditure is calculated by dividing the work incurred by engulfment time (tengulf), namely, as PT
metab
=gDQT metab
/tengulfand
PVGB metab
=gDQVGB metab
/tengulf. The metabolic power outputs
dur-ing the mouth opendur-ing and closure stages are calculated similarly, but integrated during their respective duration (i.e., overtengulf/2;
see Equation 8 below), and the instant EMR (labeled EMR*) integrated over time intervals of 0.1 s.
The calculation of EMR also includes an estimate of the metabolic expenditures incurred by the rest of the body (i.e., besides swimming muscles and VGB musculature). This is achieved by adding toPTmetab+PVGBmetabthe metabolic output of
the mass fraction X of those body parts that spend metabolic energy at rates obtained from the oft-used Active Metabolic Rate (AMR) [20], and the output of fractionY that expend energy at
rates similar to the Basal Metabolic Rate:
EMR~PTmetabzPVGBmetabzX:AMRzY:BMR ð1Þ
Previous studies that determined body composition in baleen whales estimates muscle mass at approximately 43% of total mass, in comparison with 25% blubber, 17% bone and 12% viscera [39]. Another study suggested locomotor musculature as repre-senting 15% of total body mass [40]. If VGB musculature comprises about the same proportion as locomotor musculature (i.e.,,15%), there remains about 43%–30% ,13% of muscle mass which, along with viscera, could represent about 25% of body mass that may also function at higher metabolic rates. Given the presumed intensity of engulfment, and further assuming such tissues operating at rates similar to AMR, Equation 1 would thus useX = 0.25andY = 0. Such values are obviously tentative but it turns out that they have minimal effects on the overall value of EMR.
We estimated AMR and BMR from allometric equations relating body mass to power, where AMR = 3 BMR [41,42]. Following previous studies of marine mammal metabolism [1,41,43], BMR is assumed herein as twice that of terrestrial animals expressed via Kleiber’s scaling formula [44,45]. Those two assumptions thus lead to:
AMR~3|2|4Mc0:75
ð2Þ
AMR-costs related to non-resting metabolic outputs by rorquals have been estimated either via assumed allometric formulations of AMR and BMR [42,46,47], or by assuming a specific form of the shape drag force [40]. These AMR-based studies have yielded estimates that differ by as much as 100%, depending on the specific AMR-BMR relationship and BMR-model being used, as discussed by Croll et al. [42]. The drag-based approach has yielded estimates lower than all AMR-based estimates, most likely due to an inadequate drag model that neglects the effects of surface-induced drag (i.e., ventilation and wave drag [48]), effects which are important in other marine mammals [49]. In the case of blue and fin whales, Equation 2 yields active metabolic rates that are lower than Lockyer [47] by about 50%, and higher than Croll et al. [42] by 50%. Further support for Equation 2 is presented below with another measure of active metabolic rate that is more specific to the bio-mechanics and ecology of rorquals.
Rorqual Average Active Metabolic Rate (RAAMR) and Prey-Approach Metabolic Rate (PAMR)
Rorqual Average Active Metabolic Rate (RAAMR) is primarily based on a calculation by Bose and Lien [37] of the thrust generated by actual flukes using classical 2-dimensional airfoil theory with finite span corrections. Under an assumption of steady travel, power expenditures are calculated from the product of this calculated thrust (Fthrust steady) and average speed of transport
(,Vc.), with the latter obtained here from long duration tracking
data [50,51]. In what follows,,Vc.=2.16 m/s and 2.4 m/s for
fin and blue whales respectively. Being extracted from data spanning days, these speeds reflect motions characteristic of not only long distance transit, but also of shorter events such as resting, mingling (socializing) and lunge-feeding. Although these activities are generally performed at different speeds, the long duration of the monitoring should be dominated mostly by the long-distance travel component of the track.
Figure 3. Logic flow diagram of the BLF model.
The calculations by Bose and Lien applied only to the fluke shape and size of a 14.5 m fin whale and, as such, needed to be extrapolated over body size and across species. This was done by first scaling the Bose-Lien result according to body drag, and thus to surface area (or, equivalently to body areaAbody(Figure 1 and
Tables 1,2,3 4). As non-feeding swimming is often performed in groups of variously-sized individuals moving at the same speed, the transport speed,Vc.is herein assumed as body size-independent.
Moreover, non-feeding swimming speed tends to be relatively low across body size in many different taxa [52,53]. The Bose-Lien results were also scaled across the body length of blue whales given their morphologic similarity with that of fin whales. This analysis was not extended to humpback whales given their significantly different fluke morphology.
A third extrapolation of the Bose-Lien thrust was performed with respect to travel speed, given the high flow speed these authors used (i.e., 4 to 12 m s21
) in comparison to the average travel speed measured by tracking. Considering the Bose-Lein data below 8 m s21
and extrapolating down to 2 m s21
yields the formula Fthrust steady =1000 (1.216,Vc. +0.0205,Vc.2). The
RAAMR that results is computed using a metabolic output model similar to that of Equation 1:
RAAMR~PTransitmetabzX:AMRzY:BMR ð3aÞ
where
PTransitmetab(Lbody)~ Fthruststeady
Abody(Lbody)
Abody(14:5m)
:SVcT
:
1 0:15
ð3bÞ
The value of the cross sectional area at 14.5 m (orAbody(14.5 m)) is
2.81 m2 for both fin and blue whales, and follows from the
allometry ofAbodyshown in Tables 1, 2, 3, 4. The body fraction are
set toX = 0.15andY = 0.2but as with Equation 1, their specific choice yield small contributions in comparison to those of
Ptransitmetab. Note the efficiency factor of 0.15 discussed previously.
Note also that,Vc.=2.16 m s21and 2.4 m s21are applied at all
body length for fin and blue whales respectively. As shown next, the RAAMR exceeds AMR by factors of only 1.1 to 1.6.
The metabolic rate incurred during prey-approach (PAMR) is calculated by assuming fluking thrust as being much greater than drag and (weight-adjusted) buoyancy (see figure 2 but without the engulfment-specific forces). With thrust being the only force at play, the (metabolic) power output of fluking is computed from the change in (whale) kinetic energy during a stage of durationtpa,
namely from the end of the filter/recovery stage of the previous lunge to the beginning of engulfment of the current lunge. Factoring in the metabolic and fluke hydrodynamic efficiency, as well as the ‘‘rest-of-the-body’’ expenditures, one has:
PAMR~1=2Mc Vc(0) 2{V
c(tfilter)2
0:15|tpa zX
:AMRzY:BMR ð4Þ
The fractionsX and Y are set toX = 0.25 and Y = 0as with EMR. Values for the whale’s mass (Mc) and speed at the beginning
of engulfment (Vc(0)) can be found in Tables 1, 2, 3, 4. The values
for tpa are shown Table 5 and extracted from tag studies
[24,25,34,35]. These correspond only to each species’ average body size. Finally, the speed at the end of the filter/recovery stage (Vc(tfilter)) is set at 1.0m /s for the three species, again as hinted by
digital tag studies [24,25,34,35].
Results
Simulation Inputs
This BLF upgrade now requires, for each value ofLbody, a total
of 22 inputs on body dimensions, body dynamics and hydro-dynamics (Tables 1, 2, 3, 4). The former include the relevant body characteristicsLbody,L0,whead,Ljaw, McandAbody(Figure 1) which
were obtained from reduced major axis regressions [54] of morphometric studies [39,55–62] in humpback, fin and blue whales. These regressions yield allometric equations of each body characteristic over body sizes ranging from weaned juveniles to the largest adults. Simulations were performed for minke whales as well, but at only one body size due to limited data.
As the most important body dynamics input, the initial speed of a whale just prior to the mouth opening stage (orVc(0)in Tables 1,
2, 3, 4) was determined from tag studies of large rorquals lunge-feeding at depth for krill [24]. These data, along with the modeling of possible escape scenarios of the prey [27], suggest this initial speed to vary asVc(0) = VnLbody, withVn=0.159/sec (humpback),
0.148/sec (fin) and 0.146/sec (blue) [24]. Given the unavailability
Table 2.BLF3 simulation inputs – fin whales.
L-body(m){ L0(m){ Ljaw(m){ whead(m){ Mc(kg){ Abody(m2){ Vc(0)(m/s){ Fthrust(N) kopen
10.0 4.99 1.59 0.93 6853 1.02 1.45 1044 14.0
13.5 7.07 2.35 1.34 15 595 2.31 2.00 1852 11.7
17.7 9.68 3.32 1.86 32 758 4.84 2.63 3108 10.0
18.5 10.19 3.52 1.96 36 976 5.45 2.75 3382 9.7
20.2 (average length) 11.29 3.95 2.18 47 047 6.93 3.00 4000 9.1
22.7 12.92 4.59 2.51 64 770 9.52 3.37 4999 8.5
24.0 13.78 4.93 2.68 75 448 11.07 3.56 5560 8.2
{References 24, 39, 55–62.
Inputs applying to all body lengths:rw = 1025 kg/m3, dt = 0.01 s,hgapemax = 78u, kam = 0.2, kopen/kclose = 1.82, CDopen = 0.5, CDclose = 0.5, CDbody = 0.05, Xjd = 1.2,
C= 1.2, Vw(0) = 0 m/s,x= 1.0,Q= 1.6 (0#t#0.66 topen),Q= 0.0 (0.66 topen,t#tengulf). hsync is computed from Fsync/Xjd = (hgapemax/C) sinhgapemax Ljaw/(L0 -Ljaw) (Potvin et al [27]).
of tag data in the case of minke whales, the initial speed was assumed atVc(0)= 1.16 m/s (as computed fromVn=0.15/sec), a
value which turned out lower than the reported average minke cruising speeds (,3 m/s [63]), but one that appears nevertheless within the range of this species’ feeding speeds.
The values of the dynamical and hydrodynamic parameters
kopen,Q,x, CDetc. listed in Table 1 are further discussed inModeling
Details. Note that with minke whales, and again due to lack of tag data, these (dimensionless) parameters were set at values typical of fin and blue whales given their similar morphology. An exception was with the maximum gape angle, which was set to 50uinstead of 78u. BLF simulations, along with the film record, seem to suggest the impossibility for minke whales to carry out horizontal engulfments without premature cavity filling or draining at the maximum gape angle of 78uused by the larger Rorqual species (while lunging on krill).
Body Motion, Engulfed Mass, Force Output and Expended Power
The simulation diagram sketched in Figure 3 yields calculations of the engulfed mass, muscular-based forces and whale body speeds, and ultimately of the energy expenditures. Sample outputs are shown below in the case of fin whales (outputs for humpback and blue whales are qualitatively similar). The scaling laws relevant to the graphed results are summarized in Tables 5, 6 and 7 for each species.
Simulations of a 20.2 m fin whale are shown in Figures 4 and 5. These are compared in Figure 4 with averaged speed data collected by digital tags [35], as 20.2 m fin whales represent the average body size of this species [24]. The fact that the simulated lunges reproduced the measured speeds shouldn’t be too surprising given that several dynamic input parameters were tuned to yield a good match, in particular that of Fthrust (at t , topen). Such
parameter tuning was carried out only at the average body size of
each species (where the tags data applies), and then scaled with respect toLbodyat all other body sizes according to scaling rules
further discussed inModeling Details.
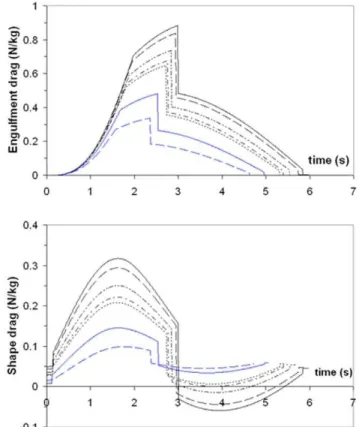
The forces of engulfment are shown in Figure 5. Comparing with a similar figure produced in a previous version of the BLF shows overall qualitative agreement (see Diagram 10, in Potvin et al. [26] or Diagram 5 in Goldbogen et al. [25]). In this new version, however, engulfment drag is dominating over shape drag and fluking thrust during the entire engulfment sequence. Moreover, shape drag becomes very small as a result of the re-contact of the wake onto the whale’s decelerating body. In fact, shape drag can become negative at sufficiently large body size, i.e., a pushing force rather than a resistance (as illustrated further in
Modeling Details), in analogy with the wake pushing a power boat upon engine cut-off. But here the effects of wake re-contact on the forward motion are mitigated by fluke thrust which then becomes negative, i.e., when producing a braking rather than a propulsive action. Interestingly, such wake re-contact affects only the larger sized whales given their greater decelerations, a result of having to push forward a larger engulfed mass (relative to body size) as caused by the positive allometry of the skull (more on this below). The variations in intra- and inter- specific scaling among the humpback, fin and blue whales can be summarized by the (mass-specific) peak engulfment drag (i.e.,FEDatt = tengulf/2(the time of
maximum gape)) and engulfment timetengulf shown in Figures 6
and 7 (see also Table 6). Note that Figure 7 also shows the so-called VGB contraction time scale t (in contrast to engulfment
duration), which is about three times as small, and in the range of 1 to 2 seconds over the entire body dimensions of humpback, fin and blue whales, as further discussed inModeling Details.
Metabolic Expenditures
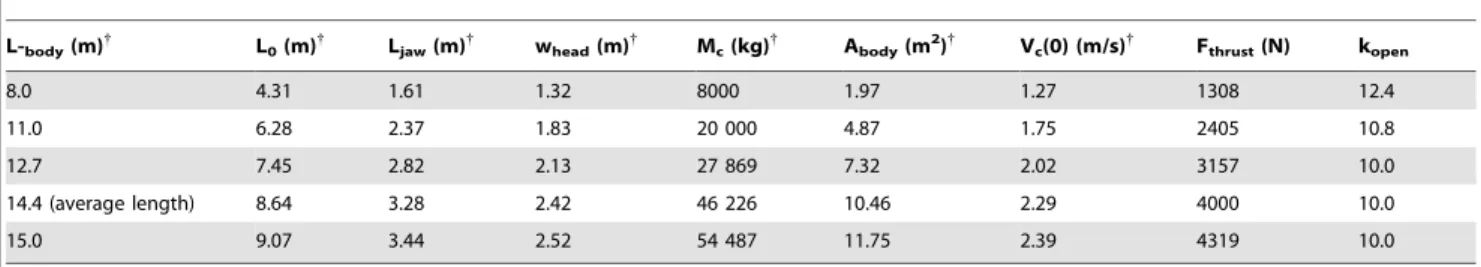
Figures 8 and 9 show the calculated metabolic expenditures (mass-specific) during non-feeding transport (RAAMR; Figure 8) Table 3.BLF3 simulation inputs – humpback whales.
L-body(m){
L0(m){
Ljaw(m){
whead(m){
Mc(kg){
Abody(m2){
Vc(0) (m/s){
Fthrust(N) kopen
8.0 4.31 1.61 1.32 8000 1.97 1.27 1308 12.4
11.0 6.28 2.37 1.83 20 000 4.87 1.75 2405 10.8
12.7 7.45 2.82 2.13 27 869 7.32 2.02 3157 10.0
14.4 (average length) 8.64 3.28 2.42 46 226 10.46 2.29 4000 10.0
15.0 9.07 3.44 2.52 54 487 11.75 2.39 4319 10.0
{
References 24, 39, 55–62.
Inputs applying to all body lengths:rw = 1025 kg/m3, dt = 0.01 s,hgapemax = 78u, kam = 0.2, kopen/kclose = 1.26, CDopen = 0.5, CDclose = 0.5, CDbody = 0.05, Xjd = 1.03,C= 1.00, Vw(0) = 0 m/s,x= 1.0,Q= 1.6 (0#t#0.66 topen),Q= 0.0 (0.66 topen,t#tengulf). hsync is computed from Fsync/Xjd = (hgapemax/C) sin
hgapemax Ljaw/(L0 - Ljaw) (Potvin et al [27]).
The symbols are further explained in the text, in Table 1, or in Text S1. doi:10.1371/journal.pone.0044854.t003
Table 4.BLF3 simulation inputs – minke whales.
L-body(m){
L0(m){
Ljaw(m){
whead(m){
Mc(kg){
Abody(m2){
Vc(0) (m/s){{
Fthrust(N) kopen
7.75 (typical adult length) 3.54 1.44 0.86 6650 1.02 1.16 641 18.4
{
J. Goldbogen; unpublished data.{{Vc(0) = 0.15 Lbody,as with the large Rorquals of [24].
Other inputs:rw = 1025 kg/m3, dt = 0.01 s,hgapemax = 50u, kam = 0.2, kopen/kclose = 1.49, CDopen = 0.5, CDclose = 0.5, CDbody = 0.05, Xjd = 1.00,C= 1.2 (same as fin whales), Vw(0) = 0 m/s,x= 1.0,Q= 1.6 (0#t#0.66 topen),Q= 0.0 (0.66 topen,t#tengulf). hsync is computed from Fsync/Xjd = (hgapemax/C) sinhgapemax Ljaw/(L0 - Ljaw) (Potvin et al [27]).
and in the course of lunge-feeding (EMR; Figure 9). Unlike the metabolic expenditures of engulfment, RAAMR decreases slightly with body size from about 2.7 to 1.7 W kg21
(see also Tables 7 and 8). Thus, RAAMR is consistent with the general concept of a lower cost of transport [43], although we note that RAAMR is somewhat larger than AMR (equation 2) by factors of 1.1 to 1.6. As calculated and applied to averaged sized fin and blue whales, RAAMR is greater than BMR by factors of 4.8 and 3.6 respectively.
In contrast, the estimation of the EMR increases with body size as demonstrated by previous studies [24]. But these simulations show for the first time that metabolic output is highest during the mouth opening stage when the cavity wall forces are at their peak (Figure 5). Overall, such intensity ranges from 3 to 7 W kg21, where the largest expenditures are incurred at the largest body sizes. This is a reflection of the positive allometry of the skull which enhances buccal cavity volume (relative to body size) and results in larger mass-specific engulfed and deflected water masses [23].
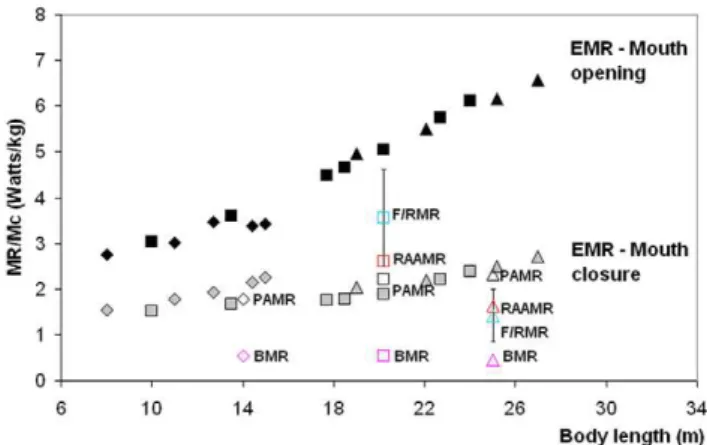
Figure 9 also compares the metabolic rates involved in each phase of a lunge, namely, prey-approach (PAMR), mouth opening and closure (EMR) and filter/recovery (F/RMR). Although PAMR and EMR are calculated directly in terms of the forces involved (see Eqs. 1, 2, 4), F/RMR is estimated only indirectly, i.e., via PAMR, EMR and RAAMR (Equation 3), and from the
average metabolic output (DEO2/tmaxdive) that could be obtained
from a ‘‘maximum duration’’ foraging dive in which all of the stored oxygen would (theoretically) be used to achieve a maximum number (fmaxlunge) of lunges:
DEO2 tmaxdive
~fmaxlunge
:t pa
tmaxdive
:PAMRzfmaxlunge
:t engulf
tmaxdive
:EMR
zfmaxlunge
:tfilter
tmaxdive
:F=RMRz
tdescentztascentztsearch
tmaxdive
:RAAMR
ð5Þ
Parameterstpa,tengulfandtfiltercorrespond to the duration of the
prey-approach, engulfment, filter/recovery stages respectively, andtascent,tdecent,tsearchandtmaxdiveto the times needed for descending
and ascending to and from foraging depth, searching for the krill patch in between lunges (during a same dive), and for performing the longest dive possible with the O2stores at hand (O2stored in
the lungs, muscle and blood). With the exception oftengulf, most of
these parameters are obtained from tag data and listed at the Table 5.Foraging durations from tag data.
Humpback (14.0 m) Fin (20.2m) Blue (25.0m) Data source
Prey-approach time (s) 8 12 18 J.A. Goldbogen; unpublished tag data
Engulfment time (s) 4.2 5.8 6.2 This paper and refs. [24,34,35]
Filter/recovery time (s) 13 (3) 28 (4) 55 (10) Ref. [24]
Lunge duration (s) 41 53 98 Refs. [24,34,35]
Search time for prey in between lunges (s) 15.8 7.2 18.8 Data of the fourth row minus the sum of the first three rows
Maximum foraging dive duration (s) 11.3 (1.5) 9.3 (3.1) 11.6 (1.8) Ref. [24]
Maximum number of lunges in a dive 12.3 (2.6) 6.5 (1.8) 4.3 (1.1) Ref. [24]
Combined descent and ascent times (s), to depths approx 200 m (50 m)
180 186 246 Refs. [24,34,35]
The uncertainties are indicated in parentheses. doi:10.1371/journal.pone.0044854.t005
Figure 4. Theory meets experiment.Simulated speed of a 20.2 m fin whale (continuous line), as compared with data from digital tags [35] (triangles). The dashed line corresponds to the simulated speed of the engulfed mass. Note theequivelocityconstraint operating during mouth closure (i.e., att.2.85 s).
doi:10.1371/journal.pone.0044854.g004
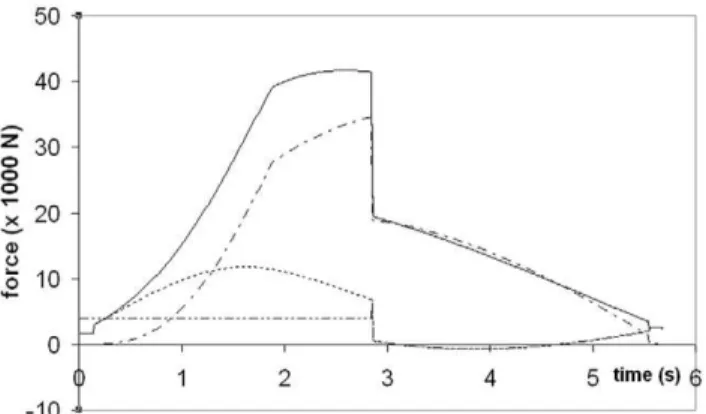
Figure 5. Simulated forces acting on a 20.2 m fin whale.
Temporal variations of total drag (FSD + FED; continuous line),
engulfment drag (FED; dash-dotted), shape drag (FSD; dotted) and
combination of fluking thrust and weight-adjusted buoyancy (Fthrust+
Fext; dash-doubly-dotted). Mouth closure begins at the 2.85 s mark and
is characterized by shape drag cancellingFthrust+Fextper equation 24.
representative average body length of each species in Table 5. The physiological data pertinent to the computation of DEO2 are
supplied in Table 9. This estimate of the F/RMR is similar to a TADL calculation [24,28,29] except thattmaxdive is not predicted
but rather used as an input to yield a metabolic rate. This is a rather speculative estimate given that several input parameters are still poorly known. Nevertheless, the results suggest that the metabolic requirements of engulfment (mouth opening specifically) significantly exceeds those of the other stages of a lunge by 100% or more. Moreover, both PAMR and F/RMR still represent ‘‘active’’ metabolic outputs (in contrast to ‘‘basal’’), as they turn out to be similar to those of RAAMR. This shouldn’t be too surprising even for the filter/recovery phase, as the significant oxygen deficits incurred during mouth opening stage are likely to require high recovery metabolism.
Discussion
Body size is one of the most important determinants of energetic efficiency and locomotor performance [64–70]. Because locomo-tion and prey capture are integrated in rorquals, as they are in many vertebrate taxa [71], both elements are subject to mechanical scaling effects. Here we integrated morphological and kinematic data into a novel hydro-mechanical model, derived from first principles and from a unified theory of predator-prey
dynamics [26], to estimate the forces required for lunge feeding whales. The model output enabled us to quantify the energetics of feeding across an extensive size range of juvenile and adult rorquals. In general, the energy and power output required to lunge feed increases disproportionally with increasing body size, a phenomenon that results from a complex interaction between lunge speed, unsteady hydrodynamics and the allometric scaling of the engulfment apparatus [23]. Because feeding is such a major component of baleen whale life history, these predictions have major consequences for rorqual foraging ecology, ontogeny, and evolution.
The Metabolic Cost of Engulfment
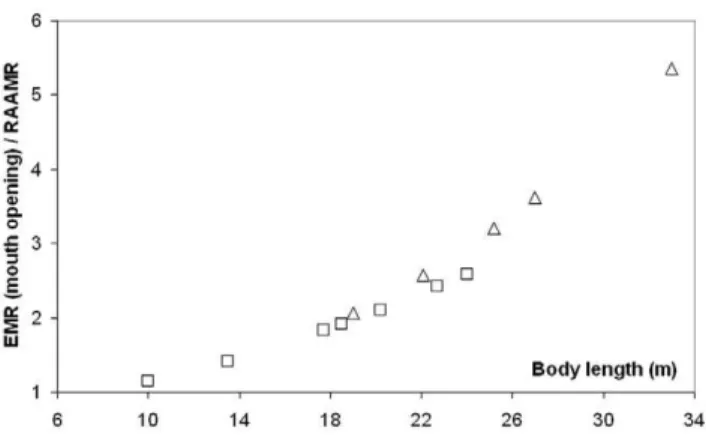
The results of Figure 9 show how significantly more strenuous engulfment is during mouth opening, in comparison with BMR and non-feeding transport. This is emphasized further in figure 10, with a direct comparison with RAAMR at all body sizes in fin and blue whales. Unlike engulfment metabolic expenditures, RAAMR (mass-specific) decreases slightly with body size (Figure 8; see also Tables 7 and 8). This is similar to the Active Metabolic Rate (AMR) of other marine mammals which is approximately three times their Basal Metabolic Rate [41,72–74]. But the ratio of EMR to RAAMR, much like all other ratios that relate engulfment costs to all other energetic expenditures, increase with body size for all three species up to about 3.7 RAAMR (Figure 10). Most noteworthy is the convergence of EMR and RAAMR at small body sizes, and the conclusion that the metabolic expenditures during engulfment become quite close to those of non-feeding swimming at such sizes. At large body sizes on the other hand, and including the sizes of the non-extant blue whale (33 m), the much greater costs of engulfment become evident.
Engulfment metabolism relative to other standard metrics of power is shown in Figure 11, with a comparison of EMR with the BMR and maximal metabolic rate (MMR) of terrestrial mammals of the same mass (MMR data from [75]; and BMR(terr) = 4.0 Mc0.75(in watts)). Marine mammals are different from terrestrial
mammals, of course, with their heightened resting metabolic rate on the one hand [41], and their well-known physiological adaptations for overall BMR reduction during diving on the other (for example, bradycardia and regional vasoconstriction) [31]. But the data available on mitochondrial volume densities [76] and aerobic scope [77] on seals and dolphins already point to a similar aerobic metabolic performance for powering locomotor muscu-lature (even during breath-hold), which after all, is the main function of metabolism during strenuous exercise [68]. Thus the physiological demands of lunge-feeding rival those of athletic [75], or more appropriately ‘‘highly active’’, terrestrial mammals during maximal effort. What is also interesting is the finding that the relative level of power required by engulfment increases significantly with body size, from that similar to trained human athletes at the smaller sizes (MMR,20 BMR), to the maximum performance of dogs and horses at the larger sizes (MMR,30 BMR). Although interesting, this comparison actually under-estimates the actual maximum metabolic output that may be required, as EMR represents an averaged metabolic rate, i.e., over the duration of mouth opening. A more informative datum is the ‘‘instantaneous EMR’’ (or EMR*) computed from averaging power output over the significantly shorter time interval of 0.1s, to become time-dependent as shown in Figure 12 (Note: EMR* also neglects theX-andY-terms using in equation 1). EMR* indeed yields significantly higher maximum values, i.e., EMR*|max/
BMR(terr) = 5.8 and 18.2, 12.6 and 39.8, and 24.3 and 48.2, at the smallest and largest sizes in humpback, fin and (extant) blue whales respectively. Instant EMR thus changes the effort picture of
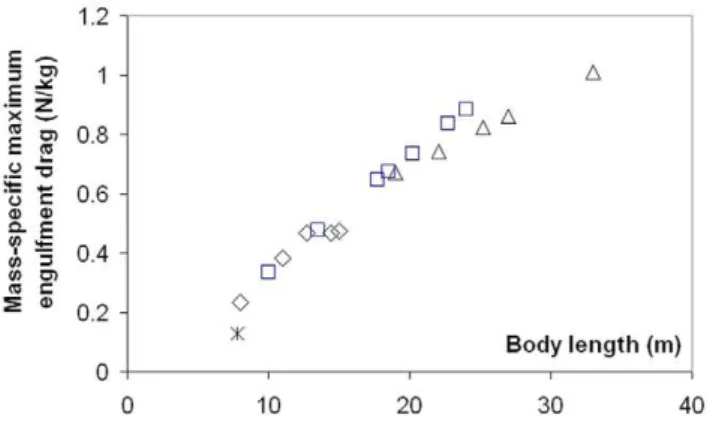
Figure 6. Maximum engulfment drag (mass-specific). Largest value attained during mouth opening, by humpback (diamonds), fin (squares), blue (triangles) and minke whales (starburst).
doi:10.1371/journal.pone.0044854.g006
Figure 7. The time scales of engulfment drag.Engulfment time (tengulf; empty symbols) and VGB push time scale (t; filled symbols) for
humpback (diamonds), fin (squares), blue (triangles) and minke whales (starburst and times).
Figure 11 somewhat, suggesting the largest extant Rorquals as engulfing prey and water at performance levels rivaling those of the pronghorn antelope. Interestingly, the predicted metabolic performance required from the non-extant 33 m blue whale far exceeds that of the pronghorn antelope at EMR*|max/
BMR(terr) = 78.6.
Maximum aerobic capacityVV O_ 2 maxj is assessed with a compar-ison of instant metabolic rate with theMaximum Metabolic Rate(i.e.,
MMR = 39.4 Mc0.87(in watts [75])), as listed in Table 8 and shown
in Figure 12. The figure shows the metabolic demands of engulfment in relation to MMR, which is a direct measure of the maximum aerobic capacity VV O_ 2 maxj of an air-breathing terrestrial mammals [68], or in other words, of the limitation of oxidative metabolism of muscle cells to supply energy without recourse to anaerobic glycolysis [68]. Exceeding MMR as shown reveals the magnitude of the oxygen deficit that accumulates during the most demanding phase of engulfment. But oxygen deficits also accumulate from the start, i.e., at small effort level, given the short time scales of engulfment, and also for fueling the anaerobic metabolic reactions that are needed to power the forward push of the engulfed mass by the fast twitch muscle fibers embedded in the VGB (such fibers represent approximately 50% of the VGB muscle fibers [R.E. Shadwick, unpublished data]). Accordingly, overall oxygen deficits may be small and recovered during the latter part of the effort, as during typicallight submaximal exercise[31]; or greater, i.e., as duringheavy submaximalexercise, and mostly repaid during longer post-effort recovery (i.e., during filtering or after a dive); or significantly greater (supramaximal exercise), where severe muscle fatigue induced by stored glycogen depletion and inorganic phosphates accumulation can only be recovered during extended rest periods. Again, the comparison suggests that engulfment is disproportionally costly for larger body sizes. At the upper extreme of body mass in the (extant) range of 25 to 27 m, the rates of energy expenditure are most demanding, i.e., reaching MMR-levels over several seconds.
Scaling of Lunge Feeding Power Output: Consequences and Implications
Our analyses show again that the energetic cost of engulfment is positively allometric whereby larger rorquals must expend relatively more energy to lunge feed [23,24,27]. But the results show for the first time that it is the rate of energy delivery (i.e., the power), rather than the total energy required for lunge feeding, that may be the limiting factor on lunge performance. This is underscored on the one hand by the TADL computed from our simulated energies (and physiology data of [24]), hinting at maximum dive times in the range of 9 to 12 minutes at all body sizes, including that of the non-extant 33 m blue whale; and on the other, by the power requirements reaching levels of high muscle fatigue and long post-dive recovery. Such a heightened power requirement is a result of the positive allometry of the engulfment apparatus [23], where larger skull sizes (in relation to body size) yield greater engulfment capacity and increased captured mass kinetic energy costs,as performed over (nearly) unchanging engulfment time scales brought about by the evasion strategies of the prey[27].
Increased fatigue and metabolic recovery may explain the reduction in lunge frequency seen across species [24], and presumably, among the largest individuals of each species. However, other factors such as krill patch dimensions may also be an important limiting factor, particularly if they are similar to, or smaller than predator size. But the noted increased post-dive breath numbers in humpback whales after dives encompassing the largest number of lunges [34] may provide supporting evidence for intensified power delivery rather than for food availability. Interestingly, such ability to deliver the required power may be adversely affected for emaciated whales returning to their feedings grounds after months of fasting, and as a result, experience lower lunge frequencies than at their normal body weight. This is an interesting topic for future simulations of course, but one that will be possible only when the morphology and body mass of these underweight and slimmer animals become known.
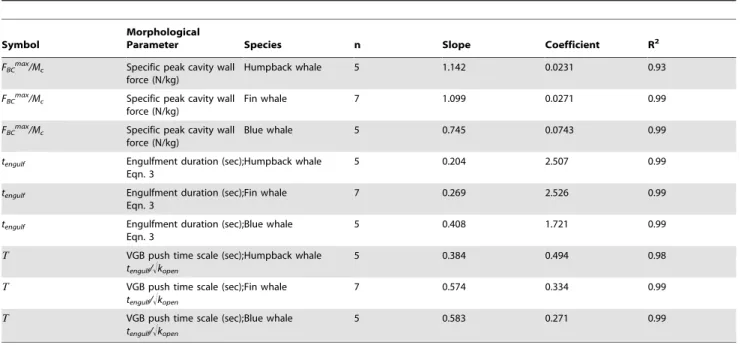
Limits on power delivery predictably has a negative impact on filtering capacity over an entire dive [24], and therefore feeding efficiency [25], but such power demands of engulfment may also Table 6.Scaling of the buccal cavity wall force and engulfment times with respect to body length (Lbody).
Symbol
Morphological
Parameter Species n Slope Coefficient R2
FBCmax/Mc Specific peak cavity wall
force (N/kg)
Humpback whale 5 1.142 0.0231 0.93
FBCmax/Mc Specific peak cavity wall
force (N/kg)
Fin whale 7 1.099 0.0271 0.99
FBCmax/Mc Specific peak cavity wall
force (N/kg)
Blue whale 5 0.745 0.0743 0.99
tengulf Engulfment duration (sec); Eqn. 3
Humpback whale 5 0.204 2.507 0.99
tengulf Engulfment duration (sec);
Eqn. 3
Fin whale 7 0.269 2.526 0.99
tengulf Engulfment duration (sec); Eqn. 3
Blue whale 5 0.408 1.721 0.99
T VGB push time scale (sec);
tengulf/!kopen
Humpback whale 5 0.384 0.494 0.98
T VGB push time scale (sec);
tengulf/!kopen
Fin whale 7 0.574 0.334 0.99
T VGB push time scale (sec);
tengulf/!kopen
Blue whale 5 0.583 0.271 0.99
set a hard physiological limit on maximum body size in rorquals. We tested this hypothesis by simulating lunge feeding in a hypothetical 33 m blue whale, and the results indicate that its engulfment power expenditures exceed those of MMR by over 80%, with a peak instant EMR of about 78.6 BMR(terr). In other words, blue whales at this scale that would be able to generate the needed power for engulfment would do so at a cost of requiring extensive rest and recovery even after a single lunge, to obviously limit residence time in high density prey patches at depth. In this way, and as argued for dinosaurs [78] and blue whales [23], limits in body size may not only be imposed by a balance between resource availability and energy expenditures, but also by the metabolic power output required for feeding (see also this argument applied to non-feeding transport in [52]). Nevertheless, either circumstance (power vs. energy limitation) predictably constrains maximum body size in this lineage of baleen whales. However, it is unknown what limits size in other cetacean lineages, as well as other lineages of other aquatic tetrapods that also exhibited gigantism in the past [67]. Clearly more research is needed to explore what factors limit body size in different taxa not only from an energetics perspective, but also with respect to other life history constraints.
Our analyses, including those of the minke whale (a fish- as well as a krill-feeder), also have implications for the lowest body size classes of rorquals, which suggest relatively low power require-ments for lunge feeding. This has a significant impact on the ontogeny of rorquals since weaned juveniles reap the advantages of efficiency in a low-cost feeding strategy that will facilitate rapid growth. Such a characteristic, which is exemplified by the large range in intraspecific body size of extant rorqual species, likely played a major role in the evolution of gigantism in
balaenopter-ids. Lower energetic costs associated with engulfment at smaller body sizes may also have implications for how lunge feeding evolved in smaller ancestral baleen whales. Fossil evidence between the late Oligocene and late Miocene indicate that extinct rorquals reached maximum body sizes no larger than extant minke whales (i.e. 10 m long) [79]. These data, together with our minke results (Figure 11), suggest that lunge feeding evolved within a body size range where the cost of engulfment does not appear to be significantly higher than non-feeding swimming (Interestingly, the minke modeling suggests that such costs may be even smaller). We posit that the evolution of baleen in cetaceans [80] at small body size classes [79] generated a mode of feeding that exhibited high energetic efficiency where vast amounts of prey could be captured at a relatively low cost [25]. Such an ecological role further led to more specialized types of microphagy, and therefore to several mysticete lineages that each exhibited distinct filter feeding modes, that satisfied particular niches related to differences in prey type. The ability to gulp discrete volumes of prey-laden water likely facilitated the exploitation of more agile zooplankton (i.e. krill, squid, etc.), in contrast to slow moving copepod prey for which continuous ram feeding may be more efficient [5], and therefore promoted the evolution of extremely large rorqual species fueled by the existence of super-aggregations of krill [81]. Future research should further explore the feeding energetics of the smallest baleen whale species, both extinct and extant, to
Figure 8. Mass-specific Rorqual Average Active Metabolic Rate (RAAMR), calculated for fin (squares) and blue whales (trian-gles).
doi:10.1371/journal.pone.0044854.g008 Figure 9. Mass-specific Metabolic Rates (MR) across scale.Ratios calculated for humpback (diamonds), fin (squares) and blue whales (triangles). Engulfment Metabolic Rate (EMR) during mouth opening – black symbols, and during mouth closing – gray symbols. Metabolic rates for prey-approach (PAMR), basal (BMR), filter/recovery (F/RMR) and Rorqual Average Active (RAAMR) – open symbols as indicated. doi:10.1371/journal.pone.0044854.g009
Table 7.Scaling of the metabolic power (EMR or RAMMR) expended during engulfment (mouth opening only) and non-feeding swimming, with respect to body length (Lbody).
Symbol Mass-specific power ratio (W/kg) Species n Slope Coefficient R2
EMR|mouth open/Mc Specific expended power - mouth openHumpback whale 5 0.370 1.277 0.88
EMR|mouth open/Mc Specific expended power - mouth openFin whale 7 0.803 0.458 0.98
EMR|mouth open/Mc Specific expended power - mouth openBlue whale 5 0.794 0.476 0.99
RAMMR/Mc Specific expended power - non-feeding travel
Fin whale 8 20.130 3.558 0.99
RAMMR/Mc Specific expended power - non-feeding
travel
Blue whale 5 20.809 26.23 0.99
examine how different feeding modes may have evolved and to what extent it promoted extreme body size.
Conclusions
This paper has shown that the physical requirements of lunge-feeding towards krill, particularly with regards to the rate of energy delivery during engulfment, may present an obstacle to ever increasing body size. This would follow from the allometry of the skull, along with the approach speeds being dictated by the evasion strategies of the prey. But this obstacle may, of course, be altogether avoided if lunges can be performed differently, for example by reducing the maximum gape angle, or by passively engulfing while lunging vertically and/or cooperatively, as already performed by some rorqual species lunging at the surface. Furthermore, limits to body size are also connected to prey type and availability. Large body size obviously limits maneuverability and has most likely forced the blue whale, the largest of the Rorquals, into obligate krill-feeding and into exploiting a resource that has so far been abundant enough to even support these giants in the very large numbers of pre-whaling days. But ultimately, and given that most Rorquals prey on both krill and fish, the linkages between food resources, motion energetics, and body size will not be completely resolved until further modeling is carried out on lunge-feeding towards fish. In general, lunging on fish will demand significantly higher prey approach speeds and accelerations by the predator. In most rorqual species such extra effort will be mitigated by the use of smaller gape angles (as with minke whales), as well as by other maneuvering and dynamic adaptations such as vertical lunging without active VGB muscle action. Although vertical lunging at higher speeds and with smaller gapes can already be simulated with the modeling techniques discussed here, passive engulfment is bound to change the physics and hydrodynamics of the modeled whale-ocean system, and as a result, yield an alternate simulation tool for the study of lunge feeding.
Modeling Details
Body and fluid dynamics constraints from synchronized engulfment. Synchronized Engulfment introduces several
con-straints on overall engulfed mass motion as well as on specific dynamic variables. The first concerns the eccentric contraction of the VGB musculature, which must impart forward motion to the engulfed mass (as areflux) withoutpremature drainingof the cavity [26]. Here premature cavity draining occurs whenever the engulfed water leaves the mouth aperture prior to complete mouth closure. Moreover, the BLF implements an assumption of
premature filling avoidance, or in other words, of preventing complete cavity filling post-TMJ prior to maximum gape, and complete cavity filling ant-TMJ prior to mouth closure. These two constraints are implemented by the use of cavity wall force pushing the engulfed mass with the ‘‘right’’ amount: If the whale exerts a force that is too high, the result is a more rapid reflux, slower whale motions and thus a slower cavity inflation rate or even a negative inflation rate (or draining). Conversely, if the force is too small the reflux is minimized, but the whale speed remains high and the ventral pouch fills too quickly. Note that an extreme of the latter includes ‘‘passive’’ or ‘‘compliant’’ engulfment [19], where the influx of water is met with little resistance other than the passive mechanical (i.e., elastic) properties of the VGB. In this case, and given the compliant nature of the VGB over most of its allowed strain range [19], little force is exerted on the engulfed mass during most of the engulfment process.
Because the oropharyngeal cavity (post-TMJ) does not sig-nificantly fill during mouth closure, the model invokes a third SE-motivated constraint, namely that of the engulfed mass post-TMJ moving at the instantaneous speed of the whale. This so-called
equivelocityconstraint is new to the BLF and is further extended to the water captured anterior to the TMJ, as motivated by the water being ‘‘scooped’’ by the rotating mandibles during mouth closure rather than ‘‘bagged-in’’ and pushed forward as during the mouth-opening stage. Most importantly, equivelocity implies the absence of significant surging of engulfed water moments before complete closure, a state confirmed by the film record. Equivelocity, and its consequent equiacceleration, means that the interaction between whale and water represents a perfectly inelastic collision, and leads to a useful derivation of an engulfment hydrodynamic force that would otherwise be very difficult to determine (i.e., Fww in
Figure 2). Furthermore, equivelocity provides an additional constraint on drag and thrust and as such helps reduce the Table 8.Scaling with respect to body length (Lbody)of the expended metabolic power ratios during engulfment (EMR; mouth opening only), as compared with AMR, RAAMR and MMR.
Symbol Power ratio Species n Slope Coefficient R2
EMR|mouth open/AMR Specific expended power (mouth open ) over AMR
Humpback whale 5 1.120 0.104 0.99
EMR|mouth open/AMR Specific expended power (mouth open ) over AMR
Fin whale 7 1.148 0.035 0.99
EMR|mouth open/AMR Specific expended power (mouth
open ) over AMR
Blue whale 5 1.785 0.014 0.99
EMR|mouth open/RAAMR Specific expended power (mouth open ) over RAAMR
Fin whale 7 0.933 0.128 0.98
EMR|mouth open/RAAMR Specific expended power (mouth
open ) over RAAMR
Blue whale 5 1.730 0.012 0.99
EMR|mouth open/MMR Specific expended power (mouth open ) over MMR
Humpback whale 5 0.760 0.0461 0.97
EMR|mouth open/MMR Specific expended power (mouth open ) over MMR
Fin whale 7 1.160 0.0161 0.99
EMR|mouth open/MMR Specific expended power (mouth
open ) over MMR
Blue whale 5 1.369 0.0085 0.99
Table 9.Values used in the calculation of the Filter/Recovery Metabolic rate (F/RMR; equation 5).
Parameter Symbol Unit Computational Blue Fin Humpback Reference
(1) Morphology
Body length Lbody m 25 20 14 [39]
Body mass Mc kg 92,671 52,584 35,692 [39]
Body volume Uc m3 86.4 45.9 31.5
Body surface area Abody m2 SA = 0.08Mc0.65 131.5 87.1 68.2 [14]
Fluke total surface area (m2) A
fluke m2 9.19 6.26 10.43 [14] [24] (2) Oxygen stores
O2stores (Lungs)
Total lunge capacity TLC l 0.1 X Mc0.96 5865 3404 2347 Kooyman, 1989
Diving lunge volume DLV l 0.75 X TLC 4399 2553 1760 Goforth, 1986
Total O2in lungs Olung l 0.15 X DLV 660 383 264 Kooyman, 1989
O2stores (muscle)
Muscle mass Mm %Mc 39.4 45.6 30.6 [39]
Muscle mass Mm kg 36,512 23,978 10,922
Myoglobin Mb g 34 g kg21 1,241,421 815,262 371,340 Noren & Williams, 2000
O2combining capacity gO 1 g21Mb 0.0013 0.0013 0.0013 Kooyman, 1989
Total O2in muscle Omuscle l 1614 1060 483
O2stores (Blood)
Blood volume BV l 0.127 l kg-1 11,769 6,678 4,533 Ridgway et al., 1984
Arterial volume AV l 0.33BV 3,884 2,204 1,496 Lenfant et al., 1970
Venous volume VV l 0.67BV 7,885 4,474 3,037 Lenfant et al., 1970
Arterial haemoglobin AHB g 209 g l21 811,723 460,593 312,633 Ridgway et al., 1984
Venous haemoglobin VHB g 209 g l21 1,648,043 935,144 634,740 Ridgway et al., 1984
O2combining capacity gO 1 g21Mb 0.0013 0.0013 0.0013
arterial blood O2 ABO l 98% saturation 1034 587 398 Kooyman, 1989
venous blood O2 VBO l 75% saturation 1656 940 638 Kooyman, 1989
Total O2in blood Oblood l ABO+VBO 2690 1527 1036
Total Body O2stores Obody l Olung+Omuscle+Oblood 4964 2969 1783
Liters/min burned at BMR rate l O2/min Obody/4.0Mc0.74 2.98 2.98 2.98 [24]
doi:10.1371/journal.pone.0044854.t009
Figure 10. Mouth opening EMR as compared to RAAMR.Ratios calculated for fin (squares) and blue whales (triangles). The 33m blue whale is non-extant.
doi:10.1371/journal.pone.0044854.g010
Figure 11. Mouth opening EMR as compared to the Basal Metabolic Rate of terrestrial mammals. Ratios calculated for humpback (diamonds), fin (squares), blue (triangles) and minke whales (starburst). Note that the 33 m blue whale is non-extant.
uncertainties that have plagued the modeling of previous studies [25–27]. The equivelocity of whale and engulfed fluid motions during mouth closure, as well as the acceleration of the reflux
during mouth-opening, are clearly visible in Figure 4. (Note that there is no reflux in passive engulfment [19,26]).
Algorithmic flow of the BLF. The hydrodynamic model is an iterative scheme aimed at computing the forces applied to, and speeds sustained by both whale and engulfed mass. As shown in the flow chart of Figure 3, each iteration involves a calculation of the gape angle, mouth surface area (projected longitudinally) and mass so-far engulfed, which are then used in the computation of all the forces acting on the whale’s body and engulfed mass. The upgrades of this BLF version include the use of engulfed mass rates that are specific to the mouth opening and closing stages – an important ingredient for ensuring physical realism at the needed time scale of metabolic output; other new features implement a formulation of shape drag aimed at approximating the effects of wake re-contact on the whale’s body during mouth closure, and the use of the equivelocity constraint to derive the ‘‘ocean-to-engulfed mass’’ drag Fww, a force that is entirely dynamical in
nature.
Mouth opening rates and engulfment duration. The complete gape angle cycle of engulfment, from opening to closure, lasts several seconds, with the mandibles opening to a maximum gape (hgape
max
) of about 78–80uwith the humpback, fin and blue whales [17,18], and of about 50u with the minke whale [JAG unpublished data]. Evidence from the film record suggests rates of mouth opening and closure calculated as [27]:
hgape(t)open
~
hsync:Vc(0) sinhgapemax:
XjdLjaw !
:t mouth opening;tƒtopen
ð6Þ
hgape(t)jclose~hgape(topen){
hsync:Vc(0)
sin hgapemax
:
XjdLjaw !
:
t{topen
mouth closing
ð Þ
ð7Þ
withhgapeandtcorresponding to the gape angle (Figure 1) and time
respectively. HereLjaw, Xjd, hsync, topenandVc(0)are the length of the
mandibles, jaw disarticulation factor, synchronization factor, duration of the mouth-opening stage and whale’s speed just prior to mouth opening, respectively (Figure 1).
The body dimensions used in these formulae (and everywhere else in the BLF) are shown in Tables 1, 2, 3, 4 and characterize the size classes typical of adults in all three Rorqual species [24]. These are the results of reduced major axis regressions [54] of morphometric studies [39,55–62]. The initial whale speedsVc(0)
at these average body sizes were obtained from tag data [24]. The duration of mouth opening (topen) follows from the requirement of
the (near) maximal extension of the ventral pouch post-TMJ by the time of maximum gape [27]. On the other hand, mouth closure duration is assumed as being the same as mouth opening, as motivated from video footage [22]. When integrated with Equations 6 and 7, this observation yields the means of calculating
Figure 12. Comparing instant mouth opening EMR* with MMR.EMR* corresponds to equation 1 with the energies integrated over time slices of 0.1 s durations, but without the X- and Y-terms.
doi:10.1371/journal.pone.0044854.g012