www.biogeosciences.net/9/4411/2012/ doi:10.5194/bg-9-4411-2012
© Author(s) 2012. CC Attribution 3.0 License.
Biogeosciences
A novel source of atmospheric H
2
: abiotic degradation of organic
material
H. Lee1, T. Rahn2, and H. L. Throop3
1Climate and Global Dynamics Division, National Center for Atmospheric Research, Boulder, CO 80307, USA 2Earth and Environmental Sciences Division, Los Alamos National Laboratory, Los Alamos, NM 87545, USA 3Department of Biology, New Mexico State University, Las Cruces, NM 88003, USA
Correspondence to:H. Lee ([email protected])
Received: 5 June 2012 – Published in Biogeosciences Discuss.: 18 July 2012
Revised: 25 October 2012 – Accepted: 29 October 2012 – Published: 12 November 2012
Abstract.Molecular hydrogen (H2)plays an important role in atmospheric chemistry by competing for reactions with the hydroxyl radical (OH) and contributing to the production of H2O in the stratosphere, indirectly influencing stratospheric ozone concentrations. The dominant pathway for loss of H2 from the atmosphere is via microbially-mediated soil uptake, although the magnitude of this loss is still regarded as highly uncertain. Recent studies have shown that abiotic processes such as photochemically mediated degradation (photodegra-dation) of organic material result in direct emissions of car-bon (C) and nitrogen (N)-based trace gases as well as H2. This H2 production has important implications on source-sink dynamics of H2 at the soil-atmosphere interface and thus it is important to quantify its variability over a range of plant types and materials. Here, we show laboratory ob-servations of H2production and its temperature dependence during abiotic degradation of four plant litter types as well as pure cellulose and high lignin content woody material. A greater amount of H2was produced in the absence of solar ra-diation than from photodegradation alone, verifying that low temperature thermal degradation of plant litter is a source of H2. In addition, we measured a significant release of H2both in the presence and absence of O2. Our results suggest that abiotic release of H2 during organic matter degradation is ubiquitous in arid ecosystems and may also occur in other terrestrial ecosystems. We propose that because these pro-cesses occur at the soil-atmosphere interface, they provide a previously unrecognized proximal source of H2for microbial uptake and confound interpretation of direct measurements of atmospheric uptake that are important for constraining the global H2budget.
1 Introduction
Atmospheric H2is one of the most abundant reduced gases in the atmosphere, with a seasonally varying dynamic equi-librium of approximately 530 ppb. The known sources of at-mospheric H2are photochemical oxidation of methane and non-methane hydrocarbons (40 ± 16 Tg yr−1), biomass burn-ing (16 ± 5 Tg yr−1), fossil fuel burning (15 ± 10 Tg yr−1), N fixation (3 ± 1 Tg yr−1), and ocean degassing (3 ± 2 Tg yr−1)
(Novelli et al., 1999). Once emitted to the atmosphere, H2 is either oxidized by OH (19 ± 5 Tg yr−1) or consumed through microbially-mediated soil uptake (56 ± 41 Tg yr−1), thus maintaining a seasonally dependant dynamic equilib-rium in the troposphere (Novelli et al., 1999). H2is not sidered a direct greenhouse gas species. However, it is con-sidered an indirect greenhouse gas because its OHmediated oxidation reaction reduces the amount of OHavailable for reaction with CH4 and oxidation of H2 in the stratosphere produces H2O. Among the known source-sink dynamics at the soil-atmosphere interface, the dominant pathway for loss of H2from the atmosphere is via microbially-mediated soil uptake (Novelli et al., 1999; Ehhalt and Rohrer, 2009) al-though the magnitude of this loss is still regarded as highly uncertain (Constant et al., 2009; Ehhalt and Rohrer, 2009).
other gases has also been documented, including CO (Lee et al., 2012; Schade et al., 1999; Tarr et al., 1995; Derendorp et al., 2011c), CH4 (Lee et al., 2012; Vigano et al., 2008; Bruhn et al., 2009; Keppler et al., 2006), CH3Cl (Derendorp et al., 2011b, 2012; Hamilton et al., 2003), C2–C5 hydrocar-bons (Derendorp et al., 2011a, b), and H2(Derendorp et al., 2011c). In addition, several studies have reported small but significant C, N, and H- based trace gas release from organic matter in the absence of solar radiation (Conrad and Seiler, 1985; Lee et al., 2012; McCalley and Sparks, 2009; Tarr et al., 1995; Vigano et al., 2008; Derendorp et al., 2011c), with strong positive correlations between the rate of gas release and temperature. These studies suggest that abiotic degrada-tion of organic matter may occur not only from photodegra-dation, but also from thermal degradation processes at rela-tively low temperatures (<100◦C) that are well below the ignition point.
The mechanisms driving abiotic trace gas production from organic matter are still poorly understood. Proposed mech-anisms include photochemical oxidation of organic com-pounds (Armstrong et al., 1966; Miller and Zepp, 1995; Valentine and Zepp, 1993) and direct cleavage of chemical groups by radiative energy absorption (Keppler et al., 2008; Schade et al., 1999; Tarr et al., 1995; Vigano et al., 2008). Among these, CH4release via direct cleavage of methoxyl groups abundant in pectin and lignin from live and dead plant material was recently documented (Keppler et al., 2008; Vigano et al., 2008). Based on these observations, CO and CO2release during abiotic degradation of plant material have been proposed to result from direct cleavage of carbonyl and carboxyl groups, respectively (Lee et al., 2012; Tarr et al., 1995). Some support for this methoxyl groups as a source of H2 is found in a recent wood burning study (R¨ockmann et al., 2010), where, relative to water, the isotopic compo-sition of bulk biomass was slightly depleted while it was strongly depleted in both methoxyl groups and H2. This iso-topic fractionation indicates that a small portion of H2may have originated from methoxyl groups. Given the nature of the chemical groups and bonds composing plant tissue, we speculated that H2would be produced during abiotic degra-dation of plant litter [e.g., 2CnHm+nO2+hν→ 2nCO+ mH2: as a byproduct (mH2) of partial oxidation (nO2) of methyl groups (2CnHm)under radiation energy (hν) absorp-tion]. Such thermal and photo production of H2has recently been documented using a single plant species ( Sequoiaden-dron giganteum) (Derendorp et al., 2011c).
In our study, we quantified the steady state production rate of H2 from different plant materials in a factorial ma-nipulation of solar radiation (+rad: solar radiation present, −rad: solar radiation absent) and temperature (15 to 55◦C).
We used four plant litter types that varied in chemical and structural composition to investigate the range of abiotic H2 release from plant derived organic material: two grass species (C3Indian ricegrass,Oryzopsis hymenoidesand C4 little bluestem grass, Schizachyrium scoparium), leaves of
two woody species common in the desert in the southwest USA (velvet mesquite,Prosopis velutinaand pi˜non pine, Pi-nus edulis), and proxies for pure cellulose (cellulosic filter paper, 92 % pure cellulose) and high lignin woody material (thin sheets of basswood,Tilia sp.). For the plant material with the highest H2production rate (basswood), we extended measurements to 80◦C. We also assessed the role of atmo-spheric O2on H2release (+O2: aerobic conditions and−O2:
anaerobic conditions) with the high lignin woody material. We hypothesized that (1) there would be detectable abi-otic production of H2and the production rates would be pos-itively correlated with temperature as potential energy and oxidative potential increase with temperature, (2) the rate of H2production would be close to zero in the absence of O2if abiotic production of H2 is via partial oxidation of methyl groups, and (3) abiotic production of H2 from plant litter would vary among plant materials due to species- and tissue-specific differences in chemical composition (e.g., the pres-ence and abundance of methyl groups).
In this study, we define H2 produced in the absence of solar radiation asthermal degradation(temperatures below 100◦C). The H2produced in the presence of solar radiation was considered total abiotic degradation, thereby, we define
photodegradationas the difference in H2production between total abiotic and thermal degradation. It is important to note that both thermal degradation and photodegradation could be thermally enhanced (i.e., H2production increasing with tem-perature).
2 Materials and methods
of solar radiation exposure rather than mass (e.g., exposing multiple layers of filter paper did not influence the rate of gas production during photodegradation; data not shown).
We did not pre-treat the litter materials to eliminate mi-crobial activity, but experiments took place under conditions where materials were completely dry and were exposed to intense solar radiation, thus minimizing the possibility of microbial activity (Johnson, 2003). Pre-treating of the ma-terial to completely negate the possibility of any biologi-cal activity was not feasible due to the potential for chemi-cal alteration during certain sterilization treatments (e.g., au-toclaving). Chemical sterilization was also ruled out since these technics may add compounds that are vulnerable to breakdown under heat and/or UV radiation, thus confound-ing our H2production measurements. Consequently, we did not completely rule out the possibility of some microbial ac-tivity, although the abiotic conditions suggest that it would be either non-existent or extremely low.
The plant materials were exposed to a factorial manipu-lation of solar radiation (+rad and−rad) and temperatures
(15, 25, 35, 45, and 55◦C) to quantify the rates and patterns of H2 release during abiotic degradation of plant material. We used basswood sheets, which exhibited the highest rate of H2production in the presence of O2, to quantify the rate of H2 production during abiotic degradation of plant mate-rial at a higher temperature (80◦C) and to quantify the rates and patterns of H2production in the presence and absence of O2in combination with solar radiation (+rad and−rad) and
temperature (15, 35, and 55◦C).
The plant litter incubation experiments were conducted in a custom built quartz chamber (Blue Flame Technologies, McKinney, TX) that was transparent to over 85 % of the ra-diation generated from the solar rara-diation simulator across all wavebands. Solar radiation was simulated with a 300 W xenon lamp and lamp housing equipped with an atmo-spheric attenuation filter (Oriel Instruments, Newport Corp., Irvine, CA). The xenon lamp emitted a wavelength range of 0–2400 nm, but the atmospheric attenuation filter eliminated the shorter and longer wavelengths (<290 and>1600 nm), thus representing the range of radiation wavelengths reaching the surface of Earth. The intensity of radiation relative to nat-ural sunlight varied with wavelength; UV-B (50 µW cm−2)
was generated at a similar intensity as the solar radiation, but UV-A was much lower (1 mW cm−2)than natural solar ra-diation (e.g., measured UV rara-diation intensity of cloud-free solar noon during early August in Los Alamos, NM, USA was approximately 55 µW cm−2 for UV-B and 5 mW cm−2 for UV-A). Ozone production and accumulation in the cham-ber from the xenon lamp was likely minimal, as the atmo-spheric attenuation filter eliminated UV-C (100–280 nm) and the residence time of gases in the chamber was on the order of 10 s.
The area of solar radiation exposure was defined by a Viton-core O-ring (53.5 cm2 and 10.5 ml), which was clamped between the top and bottom halves of the quartz
chamber, making an airtight seal. The outflow of the cham-ber was attached to a CO-H2 analyzer (Peak Performer 1 RCP, Peak Laboratories LLC, Mountain View, CA, USA). A controlled flow of headspace gas (zero air or N2 at 50– 70 ml min−1)flowed through the chamber and to the analyt-ical system. The zero air we used contains little or no H2, so we cannot rule out the possibility of H2outgassing from the substrate in the zero air. However, emissions did not di-minish through time as would be expected from outgassing. Instrument calibration was performed with a suite of natural air standards and mixtures (NOAA ESRL and Scott Marrin, Riverside, CA, USA) that were routinely tested for internal consistency in order to establish stability in H2 concentra-tions. Data were corrected for instrument non-linearity and a reference gas was analyzed every 35 min during the course of the automated analytical sequence. Instrument precision was ± 5 % or better at H2concentrations<100 ppb and ± 2 % or better at concentrations>100 ppb. The detection limit for observed H2production was ± 0.01 nmol m−2hr−1.
The chamber temperature was controlled using a water bath integrated into the bottom of the chamber and connected to a chiller/heater (ThermoCube 200/300/400, Solid State Cooling Systems, Wappingers Falls, NY, USA). The cham-ber temperature was continuously monitored with a ther-mocouple (error range ± 0.5◦C) and radiation influences on chamber temperature (approximately 2◦C) were controlled with the water bath. A hotplate was used to assist the tem-perature increase to 80◦C. The exposed litter material was exchanged after one full set of temperature and radiation manipulations (temperature increase from 15 to 55◦C and
±rad), although reusing the material did not change the rate of gas production (one set of measurements was approxi-mately equivalent to one afternoon of exposure of solar ra-diation).
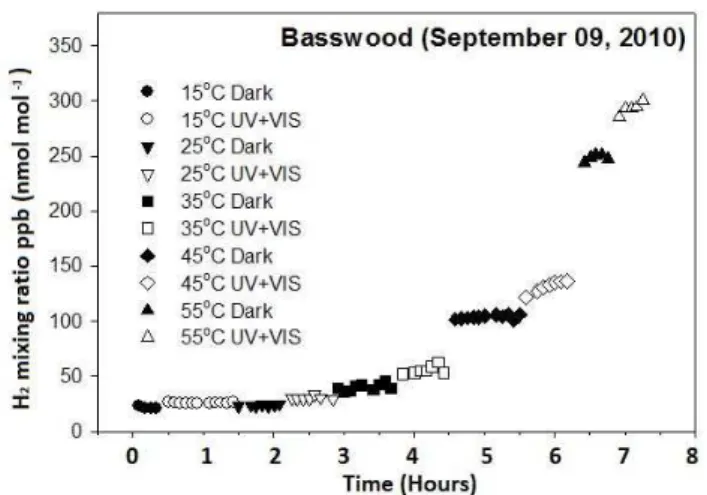
Fig. 1.Example of an analytical sequence exhibiting increasing H2concentrations with increasing temperature and light conditions
(dark and UV+visible light). The automated GC system ran on a five minute sequence with analysis of a reference gas every 35 min. Open symbols indicate stabilizing period and filled symbols indi-cate period used for averaging. Note the nearly instantaneous re-sponse of the plant material, in this case of Basswood, to changes in temperature.
estimate the steady state H2production rate. Each measure-ment set was replicated three times for each litter type.
To quantify the rate of H2 production during anaero-bic thermal degradation and photodegradation of basswood sheets, we followed the same basic procedure used for mea-surements in the presence of O2with ultra high purity N2 substituted for zero air. Measurements were taken at 15, 35, and 55◦C.
The H2 production rates during thermal degradation and photodegradation of plant litter were normalized in two ways: per area (nmol H2 m−2s−1) and per mass (nmol H2kg−1s−1): however, we suggest that H2production rate by thermal degradation is most appropriate on a mass basis because temperature would affect litter biomass as a whole. In contrast, photodegradation is most appropriately reported per unit area, as the UV radiation effects would only apply to the area of litter exposed to UV.
Activation energy of H2production during thermal degra-dation and photodegradegra-dation of litter under temperature manipulation was calculated using the Arrhenius equation (Eq. 1):
k=Aexp(−Ea/RT ) (1) where k is the reaction rate coefficient, A is the pre-exponential factor,Eais the activation energy,R is the gas constant, andT is the temperature. We also estimatedQ10of the reaction according to Eq. (2) to better understand temper-ature sensitivity of the reaction.
Q10=(Pn/Pn−1)exp(10/(Tn−Tn−1)) (2)
wherePnis H2production rate at timenandTnis chamber temperature at timen. Statistical analyzes including repeated measures analysis with mixed effects and regression analyzes were conducted usingR2.11.1 (R Development Core Team). The differences in H2production rate within the plant litter types were analyzed using repeated measures analysis.
3 Results
Thermal degradation of plant litter typically led to a higher H2production rate (range=0.00069 to 2.17 nmol m−2s−1
across all materials and temperatures) than did photodegra-dation alone (Fig. 2 and Supplement 1; range=0.0036 to
1.01 nmol m−2s−1). This difference was particularly pro-nounced at temperatures higher than 45◦C (Table 2). Aver-aged across all materials, the molar ratio of thermal degrada-tion to photodegradadegrada-tion rose from 0.52 to 4.07 as temper-ature increased from 25 to 55◦C, implying that production of H2is more sensitive to changes in temperature than solar radiation alone. When temperature was raised to 80◦C for the high lignin proxy (basswood), total H2 production rate reached 7.01 nmol m−2s−1 (4.58 nmol m−2s−1 from ther-mal degradation and 2.43 nmol m−2s−1from photodegrada-tion).
We identified measurable H2 production during abiotic degradation of plant litter with behavior typical of reactions following the temperature-dependent Arrhenius equation. The reactive energy (Ea)for H2production during thermal degradation of plant litter ranged from 60 to 146 kJ mol−1 and those of photodegradation ranged from 40 to 88 kJ mol−1 among the 6 different litter types (Table 1). TheQ10 values for all materials during thermal degradation and photodegra-dation exhibited normal values ranging from 2 to 3 (David-son and Janssens, 2006) with a few notable exceptions (Ta-ble 1). Both C3grass and mesquite litter exhibited highQ10 values during thermal degradation (5.7 and 7.1, respectively). Even with the elimination of a potential outlier in the C3 grass data at 25◦C,Q10remained high at 3.7. Both the cel-lulose proxy filter paper and C4 grass exhibited lowQ10 of 1.3 and 1.1 during photodegradation over the full tempera-ture range and again when potential outliers were excluded at 55◦C,Q10remained low at 1.6 and 1.1, respectively.
When the H2production rates were normalized by mass, the general temperature sensitivity patterns were similar with the exception of an increased relative rate of H2production for filter paper, the cellulose proxy (cf., Fig. 2a and b to c and d, Supplement). On a per-mass basis, the rate of H2 produc-tion during thermal degradaproduc-tion of plant litter ranged from 0.0055 to 1.77 nmol kg−1s−1across all materials within the temperature range of 15 to 55◦C. The H2 production rate during photodegradation of plant litter ranged from 0.029 to 1.03 nmol kg−1s−1.
Table 1.The activation energy (Ea: kJ mol−1)and theQ10values of H2production during thermal degradation and photodegradation of
litter for the six plant litter types calculated by Arrhenius equation over the 15 to 80◦C temperature range forEaand 25 to 55◦C temperature
range forQ10.
Process Type Filter paper Mesquite C3grass C4grass Pi˜non Basswood
Thermaldegradation Ea 69.19 125.62 60.47 146.21 81.21 81.98
Q10 2.33 5.70 7.07 2.44 2.69 4.09
Photodegradation Ea 48.03 85.42 39.70 88.20 70.74 71.06
Q10 1.29 2.23 1.93 1.07 2.09 2.31
Table 2.Mean (standard error: SE) molar ratios between H2production rate during thermal degradation and photodegradation of six plant
litter types (n=3). Only the lignin proxy (wood sheets of basswood) was used for the 80◦C exposure.
Molar ratios of H2production rate (thermal degradation/photodegradation)
T (◦C) Filter paper Mesquite C3grass C4grass Pi˜non Basswood
25 35 45 55 80
1.11 (0.78) 0.87 (0.09) 1.16 (0.23) 2.91 (0.63) –
0.18 (0.00) 0.21 (0.16) 0.68 (0.06) 4.45 (3.40) –
0.65 (0.37) 2.44 (1.02) 2.06 (0.46) 8.81 (6.38) –
0.13 (0.10) 0.78 (0.15) 1.85 (0.18) 3.20 (0.28) –
051 (0.03) 1.54 (0.05) 1.97 (0.10) 2.09 (0.59) –
0.57 (0.15) 1.01 (0.12) 1.94 (0.45) 2.96 (0.74) 3.62 (0.63)
sheets exhibited the highest H2production rates, followed by pi˜non pine needles. The remaining four materials (filter pa-per, mesquite, C3grass, and C4grass) showed H2production rates that were much lower than those of basswood or pi˜non needles (F1,79=18.22,P <0.0001) and were not observed to be statistically different from each other (F1,49=1.57,
P =0.22). The H2production rates for basswood and pi˜non pine needles diverged from that of the other materials with increasing temperatures (Fig. 1).
H2 production was observed under anaerobic conditions, ranging from 0.060 to 1.05 nmol m−2s−1for basswood sheet within the temperature range of 15 to 55◦C. This production was on the order of half that produced under aerobic con-ditions at any given temperature and radiation combination (Fig. 3).
4 Discussion
Previous work on trace gas production during thermal degra-dation and photodegradegra-dation of plant litter showed that var-ious C- and N- based trace gases are released during abiotic degradation of litter (Brandt et al., 2007; Conrad and Seiler, 1985; Schade et al., 1999; Vigano et al., 2008). A recent study suggested that this may be attributed to direct break-down of various chemical compounds and chemical groups within the organic material (Lee et al., 2012) by absorbing the activation energy from the heat or solar radiation. In addition to various C-based gas species, measurable H2 re-lease was previously reported fromS. giganteum, but thermal degradation was reported only at temperatures above 45◦C
and photodegradation was reported only in anaerobic condi-tions (Derendorp et al., 2011c). In this study, we identified and quantified the rate of H2 release during abiotic degra-dation of various plant litter types and showed that the rate of H2 production increases exponentially with temperature (Fig. 2, Tables 1 and 3). Additionally, we identified release of H2from dry litter under intense UV radiation, high chamber temperatures (Fig. 2), and in both the presence and absence of O2 (Fig. 3) and that the temporal response to changing temperature is essentially instantaneous (Fig. 1) suggesting that the mechanism involved in the release of H2is abiotic.
Fig. 2.The rate of H2production from abiotic degradation of plant litter across a range of temperatures. Abiotic degradation is divided into(a)and(c)thermal degradation (H2production in the absence of solar radiation minus blank) and(b)and(d)photodegradation (H2
production in the presence of solar radiation minus thermal degradation). Six plant litter types were used. Means and standard error (n=3) are depicted.
Fig. 3.The rate of H2production during thermal degradation (dark colors; measured in the absence of solar radiation) and photodegradation
(light colors; H2production in the presence of solar radiation minus thermal degradation) of high lignin proxy basswood sheet in the(a) absence of O2and(b)presence of O2.
total abiotic H2production. It is unclear at this time why the experimental results differ, but it is possible that there is a difference in plant species response betweenS. giganteum
and the basswood studied here or that there is a fundamental difference in experimental setup that is not readily obvious. Regardless of this difference, our results suggest that mul-tiple mechanisms drive the abiotic release of H2 from plant litter. We speculated in previous experiments with C-based trace gases that both photochemical oxidation (via reaction
of reactivity (Davidson and Janssens, 2006). Similarly, the higher rate of H2 production in the presence of O2may be due to partial photo-oxidation of organic compounds. Taken together, our results suggest that the plant litter pool is a pre-viously unrecognized source of atmospheric H2.
Our findings have substantial implications with respect to the most important loss process for atmospheric H2. For in-stance, a previous field observation of soil H2uptake from different soil layers showed that the rate of H2 uptake in-creased when the surface litter and organic matter layers were removed (Smith-Downey et al., 2008). The original interptation of this observation was that litter and organic matter re-movals eliminated a diffusive barrier and increased access to atmospheric H2for soil microbes. Interpretation of these data in light of our results, however, would suggest that the litter removal eliminated a proximal source of H2that subsurface microbes had previously been consuming. We suggest that in this previous study, the observed uptake of H2, occurred even though H2was likely produced within the chambered system, but consumption was simply greater than production.
The range of H2 production rates during thermal degra-dation of plant litter in vitro observed in our study (0.02– 33.62 ng H2 gdw−1 h−1 within a 15–80◦C temperature range across the six different materials) corresponds well with the single species from which H2 release was previ-ously reported (Derendorp et al., 2011c; approximately 0–60 ng gdw−1h−1within a 20–80◦C temperature range). While Deredorp et al. (2011c) reported measurable rates of H2from
S. giganteumonly over 45◦C, for most litter types we de-tected measureable H2 release beginning at 35◦C. In con-trast to previously published findings, we observed substan-tial release of H2during photodegradation of litter both with and without O2, whereas Derendorp et al. (2011c) only ob-served photo-induced H2release in anaerobic conditions. We expect that if H2release is due to direct breakdown of chem-ical groups within the organic material, H2release should be observed in both cases of thermal and photodegradation pro-cess unless the H2produced in Derendorp et al. (2011c) was somehow oxidized during the measurement.
Our observations of abiotic H2 release suggest that this may be a substantial flux relative to the documented range of soil uptake of H2 (0.2–12.0 nmol m−2s−1; Conrad and Seiler, 1985; Gerst and Quay, 2001; King, 2003; Rahn et al., 2002; Smith-Downey et al., 2008; Yonemura et al., 2000). A detailed estimate of the global abiotic H2 production would require up-scaling our results to account for global patterns of litter chemistry and pools, surface temperatures, and solar radiation reaching the soil surface. Geographically widespread arid and semi-arid lands comprise over 40 % of the global land surface (Bailey, 1996); these systems likely produce measureable amounts of H2due to the typically high surface temperatures, high radiative loads, and in many cases large amount of standing dead and surface litter. Although the majority of this H2is likely lost immediately to soil mi-crobiota due to proximity to the most important atmospheric
H2sink, in the case of standing dead biomass, H2produced might indeed yield H2directly to the atmosphere. Given dif-ferences in reported H2 flux response to O2 between our study and that of Derendorp et al. (2011c), we suggest fu-ture research assessing the role of O2on abiotic release of H2and the correlation between UV intensity and the rate of H2 release from various organic materials. In addition, fu-ture field work measuring H2flux from litter isolated from soil substrates will be required to verify and quantify field flux rates.
In summary, we quantified direct abiotic production of H2from plant litter resulting from both thermal- and photo-induced processes and have shown that these processes ex-hibit classic temperature dependence evidenced by approx-imate doubling of gas production rate per every 10◦C (Ta-ble 1). These results indicate that abiotic degradation of plant material is a ubiquitous source of H2, especially un-der arid conditions. Because these processes occur at the soil-atmosphere interface, they provide a previously unrec-ognized proximal source of H2for microbial uptake and con-found interpretation of direct, chamber based, measurements of atmospheric uptake that are important for constraining the global H2budget. An exploration of the varying UV in-tensity effects would be an important future step for under-standing H2 release through photodegradation. In addition, the importance of abiotic processes in the overall budget of land-atmospheric boundary layer H2is yet to be determined. Given projected increases in atmospheric temperatures and drought in some parts of the world (IPCC, 2007; Overpeck and Udall, 2010), and detailed investigation from field and large scale observations is warranted to further extrapolate the effects of abiotic processes on a global scale.
Supplementary material related to this article is available online at: http://www.biogeosciences.net/9/ 4411/2012/bg-9-4411-2012-supplement.pdf.
Acknowledgements. This research was funded by a LANL-NMSU Memorandum of Understanding grant (HLT and TR), the LANL Institutes, and NSF DEB 0815808 to New Mexico State University (HLT).
Edited by: G. Wohlfahrt
References
Armstrong, F. A. J., Williams, P. M., and Strickland, J. D. H.: Photo-oxidation of organic matter in sea water by ultviolet ra-diation analytical and other applications, Nature, 211, 481–483, doi:10.1038/211481a0, 1966.
Bailey, R.: Ecosystem Geography, Springer-Verlag Inc., New York, 204 pp., 1996.
Brandt, L. A., King, J. Y., and Milchunas, D. G.: Effects of ultravio-let radiation on litter decomposition depend on precipitation and litter chemistry in a shortgrass steppe ecosystem, Glob. Change Biol., 13, 2193–2205, doi:10.1111/j.1365-2486.2007.01428.x, 2007.
Brandt, L. A., Bohnet, C., and King, J. Y.: Photochemically induced carbon dioxide production as a mechanism for carbon loss from plant litter in arid ecosystems, J. Geophys. Res.-Biogeosci., 114, G02004, doi:10.1029/2008JG000772, 2009.
Bruhn, D., Mikkelsen, T. N., Obro, J., Willats, W. G. T., and Ambus, P.: Effects of temperature, ultraviolet radiation and pectin methyl esterase on aerobic methane release from plant material, Plant Biol., 11, 43–48, doi:10.1111/j.1438-8677.2009.00202.x, 2009. Conrad, R. and Seiler, W.: Influence of temperature, moisture, and
organic carbon on the flux of H2and CO between soil and atmo-sphere - Field studies in subtropical regions, J. Geophys. Res.-Atmos., 90, 5699–5709, 1985.
Constant, P., Poissant, L., and Villemur, R.: Tropospheric H2 budget and the response of its soil uptake under the
changing environment, Sci. Total Environ., 407, 1809–1823, doi:10.1016/j.scitotenv.2008.10.064, 2009.
Davidson, E. A. and Janssens, I. A.: Temperature sensitivity of soil carbon decomposition and feedbacks to climate change, Nature, 440, 165–173, doi:10.1038/nature04514, 2006.
Derendorp, L., Holzinger, R., and Rockmann, T.: UV-induced emis-sions of C2-C5hydrocarbons from leaf litter, Environ. Chem., 8,
602–611, doi:10.1071/en11024, 2011a.
Derendorp, L., Holzinger, R., Wishkerman, A., Keppler, F., and Rockmann, T.: Methyl chloride and C-2-C-5 hydro-carbon emissions from dry leaf litter and their depen-dence on temperature, Atmos. Environ., 45, 3112–3119, doi:10.1016/j.atmosenv.2011.03.016, 2011b.
Derendorp, L., Quist, J. B., Holzinger, R., and Rockmann, T.: Emissions of H2 and CO from leaf litter of
Se-quoiadendron giganteum, and their dependence on UV ra-diation and temperature, Atmos. Environ., 45, 7520–7524, doi:10.1016/j.atmosenv.2011.09.044, 2011c.
Derendorp, L., Wishkerman, A., Keppler, F., McRoberts, C., Holzinger, R., and Rockmann, T.: Methyl chloride emis-sions from halophyte leaf litter: Dependence on temper-ature and chloride content, Chemosphere, 87, 483–489, doi:10.1016/j.chemosphere.2011.12.035, 2012.
Ehhalt, D. H. and Rohrer, F.: The tropospheric cycle of H2:
a critical review, Tellus B, 61, 500–535, doi:10.1111/j.1600-0889.2009.00416.x, 2009.
Gerst, S. and Quay, P.: Deuterium component of the global molec-ular hydrogen cycle, J. Geophys. Res.-Atmos., 106, 5021–5031, 2001.
Hamilton, J. T. G., McRoberts, W. C., Keppler, F., Kalin, R. M., and Harper, D. B.: Chloride methylation by plant pectin: An ef-ficient environmentally significant process, Science, 301, 206– 209, doi:10.1126/science.1085036, 2003.
IPCC: Climate Change 2007: The Physical Science Basis. Contribu-tion of Working Group I to the Fourth Assessment Report of the Intergovernmental Panel on Climate Change, Cambridge Univer-sity Press, New York, 2007.
Johnson, D.: Response of terrestrial microorganisms to ultraviolet-B radiation in ecosystems, Res. Microbiol., 154, 315–320, doi:10.1016/s0923-2508(03)00078-0, 2003.
Keppler, F., Hamilton, J. T. G., Brass, M., and Rockmann, T.: Methane emissions from terrestrial plants under aerobic condi-tions, Nature, 439, 187–191, doi:10.1038/nature04420, 2006. Keppler, F., Hamilton, J. T. G., McRoberts, W. C., Vigano, I., Brass,
M., and Rockmann, T.: Methoxyl groups of plant pectin as a precursor of atmospheric methane: evidence from deuterium la-belling studies, New Phytol., 178, 808–814, doi:10.1111/j.1469-8137.2008.02411.x, 2008.
King, G. M.: Contributions of atmospheric CO and hydro-gen uptake to microbial dynamics on recent Hawaiian vol-canic deposits, Appl. Environ. Microbiol., 69, 4067–4075, doi:10.1128/aem.69.7.4067-4075.2003, 2003.
Lee, H., Rahn, T., and Throop, H. L.: An accounting of C-based trace gas production from abiotic plant litter degradation, Glob. Change Biol., 18, 1185–1195, 2012.
McCalley, C. K. and Sparks, J. P.: Abiotic gas formation drives nitrogen loss from a desert ecosystem, Science, 326, 837–840, doi:10.1126/science.1178984, 2009.
Miller, W. L. and Zepp, R. G.: Photochemical production of dis-solved inorganic carbon from terrestrial organic matter – Signifi-cance to the ocean organic carbon cycle, Geophys. Res. Lett., 22, 417–420, doi:10.1029/94gl03344, 1995.
Novelli, P. C., Lang, P. M., Masarie, K. A., Hurst, D. F., Myers, R., and Elkins, J. W.: Molecular hydrogen in the troposphere: Global distribution and budget, J. Geophys. Res.-Atmos., 104, 30427–30444, 1999.
Overpeck, J. and Udall, B.: Dry times ahead, Science, 328, 1642– 1643, doi:10.1126/science.1186591, 2010.
Rahn, T., Eiler, J. M., Kitchen, N., Fessenden, J. E., and Rander-son, J. T.: Concentration andδD of molecular hydrogen in boreal forests: Ecosystem-scale systematics of atmospheric H2,
Geo-phys. Res. Lett., 29, 1888, doi:10.1029/2002gl015118, 2002. R¨ockmann, T., G´omez ´Alvarez, C. X., Walter, S., van der Veen, C.,
Wollny, A. G., Gunthe, S. S., Helas, G., P¨oschl, U., Keppler, F., Greule, M., and Brand, W. A.: Isotopic composition of H2from
wood burning: Dependency on combustion efficiency, moisture content, andδD of local precipitation, J. Geophys. Res.-Atmos., 115, D17308, doi:10.1029/2009JD013188, 2010.
Rutledge, S., Campbell, D. I., Baldocchi, D., and Schipper, L. A.: Photodegradation leads to increased carbon dioxide losses from terrestrial organic matter, Glob. Change Biol., 16, 3065–3074, doi:10.1111/j.1365-2486.2009.02149.x, 2010.
Schade, G. W., Hofmann, R. M., and Crutzen, P. J.: CO emissions from degrading plant matter (I). Measurements, Tellus B, 51, 889–908, 1999.
Schonknecht, G., Brown, J. E., and Verchot-Lubicz, J.: Plas-modesmata transport of GFP alone or fused to potato virus X TGBp1 is diffusion driven, Protoplasma, 232, 143–152, doi:10.1007/s00709-008-0293-z, 2008.
Smith-Downey, N. V., Randerson, J. T., and Eiler, J. M.: Molecu-lar hydrogen uptake by soils in forest, desert, and marsh ecosys-tems in California, J. Geophys. Res.-Biogeosci., 113, G03037, doi:10.1029/2008JG000701, 2008.
Valentine, R. L. and Zepp, R. G.: Formation of carbon monox-ide from the photodegradation of terrestrial dissolved organic carbon in natural waters, Environ. Sci. Technol., 27, 409–412, doi:10.1021/es00039a023, 1993.
Vigano, I., van Weelden, H., Holzinger, R., Keppler, F., McLeod, A., and R¨ockmann, T.: Effect of UV radiation and temperature on the emission of methane from plant biomass and structural compo-nents, Biogeosciences, 5, 937–947, doi:10.5194/bg-5-937-2008, 2008.