Submitted8 January 2015 Accepted 7 January 2016 Published1 February 2016
Corresponding author Johanna L.K. Wren, [email protected]
Academic editor María Ángeles Esteban
Additional Information and Declarations can be found on page 15
DOI10.7717/peerj.1636
Copyright
2016 Wren and Kobayashi
Distributed under
Creative Commons CC-BY 4.0
OPEN ACCESS
Exploration of the ‘‘larval pool’’:
development and ground-truthing of
a larval transport model off leeward
Hawai‘i
Johanna L.K. Wren1and Donald R. Kobayashi2
1Department of Oceanography, School of Ocean and Earth Science and Technology (SOEST), University of Hawai‘i at M¯anoa, Honolulu Hawai‘i, United States
2NOAA Fisheries, Pacific Islands Fisheries Science Center, Honolulu Hawai‘i, United States
ABSTRACT
Most adult reef fish show site fidelity thus dispersal is limited to the mobile larval stage of the fish, and effective management of such species requires an understanding of the patterns of larval dispersal. In this study, we assess larval reef fish distributions in the waters west of the Big Island of Hawai‘i using bothin situand model data. Catches from Cobb midwater trawls off west Hawai‘i show that reef fish larvae are most numerous in offshore waters deeper than 3,000 m and consist largely of pre-settlement Pomacanthids, Acanthurids and Chaetodontids. Utilizing a Lagrangian larval dispersal model, we were able to replicate the observed shore fish distributions from the trawl data and we identified the 100 m depth strata as the most likely depth of occupancy. Additionally, our model showed that for larval shore fish with a pelagic larval duration longer than 40 days there was no significant change in settlement success in our model. By creating a general additive model (GAM) incorporating lunar phase and angle we were able to explain 67.5% of the variance between modeled andin situAcanthurid abundances. We took steps towards creating a predictive larval distribution model that will greatly aid in understanding the spatiotemporal nature of the larval pool in west Hawai‘i, and the dispersal of larvae throughout the Hawaiian archipelago.
SubjectsAquaculture, Fisheries and Fish Science, Conservation Biology, Ecology, Ecosystem Science, Marine Biology
Keywords Connectivity, Larval dispersal, Larval pool, Recruitment, Settlement, Acanthurid, Hawaii
INTRODUCTION
Population connectivity, defined as the exchange of individuals among geographically separate sub-populations (Cowen et al., 2007;Fogarty & Botsford, 2007;Pineda, Hare & Sponaugle, 2007;Cowen & Sponaugle, 2009) is widely recognized as important in effective marine conservation (e.g.,Jones, Srinivasan & Almany, 2007;Toonen et al., 2011;Treml et al., 2012). Because traditional maximum sustainable yield fisheries management has consistently failed (Sharp, 1995;Hilborn, 2011), there is a general movement towards Ecosystem Based Management (EBM) to replace single-species management approaches (Slocombe, 1993;Browman et al., 2004;Pikitch et al., 2004;Kappel, Martone & Duffy, 2006;
McLeod & Leslie, 2009). A common approach in EBM is to establish networks of marine protected areas (MPAs) to protect breeding populations which can then ‘‘spill-over’’ into surrounding areas to enhance stocks in areas of heavy human exploitation (Gerber et al., 2005;Halpern, Lester & Kellner, 2009;Lester et al., 2013). Management efforts focus on regulating the adult fish, but an effective management for healthy ecosystems and sustainable fisheries requires understanding of not only adult habitats and spawning areas, but also larval dispersal and population connectivity (Gaines et al., 2010;Toonen et al., 2011).
The majority of marine organisms show a bi-phasic life style with a free-living, dispersive larval stage, that can last hours to weeks, and a more sessile or sedentary adult form (Thorson, 1950;Thresher & Brothers, 1985;Strathmann, 1993;Raff, 2008;Marshall et al., 2012). Although fish are mobile animals, most adult reef fish show strong site fidelity (Meyer et al., 2000;Meyer, Papastamatiou & Clark, 2010;Wetherbee et al., 2004), thus dispersal is primarily limited to the egg and larval stages when the pelagic propagules can be transported across wide geographic areas depending upon the oceanographic regime. The importance of the larval life stage of marine fish and invertebrates in understanding population dynamics has long been recognized (Thorson, 1950;Knight-Jones, 1953;
Scheltema, 1971) yet little is still known about dispersal of marine larvae, and factors affecting dispersal and near shore retention (Levin, 2006;Hellberg, 2009;Cowen & Sponaugle, 2009). However, an important driver of horizontal dispersal is the vertical strata occupied by these early life-history stages (Olivar & Sabate, 1997;Muhling & Beckley, 2007) since abiotic and biotic gradient vary greater on the vertical scale than the horizontal scale.
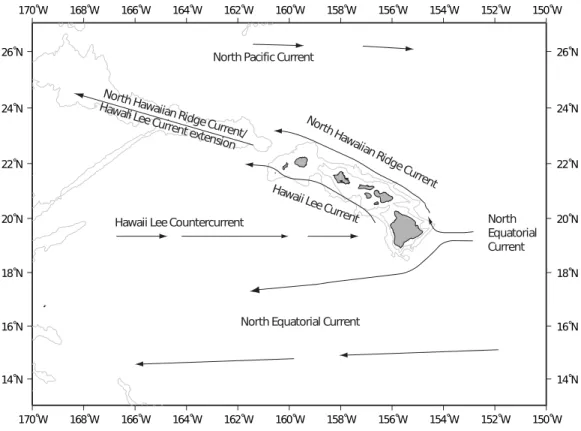
The Hawaiian Archipelago is located in the central north Pacific gyre and ocean circulation patterns are primarily driven by prevailing easterly trade winds (Lumpkin, 1998). The main surface flow along the island chain is from east to west: from the Main Hawaiian Islands (MHI) to the North Western Hawaiian Islands (NWHI) and westward into the Central and Western Pacific (Fig. 1). The Hawaiian Lee Counter Current that flows along the southern perimeter of the islands is the main mode of surface flow towards the Hawaiian Island chain from the west to the east (Chavanne et al., 2002;Qiu & Durland, 2002). Cyclonic (cold core) and anti-cyclonic (warm core) wind-generated mesoscale eddies are consistently formed in the lee of the Hawaiian Islands (Patzert, 1969;
Lumpkin, 1998;Jia et al., 2011). Cold core eddies travel northeast along the southern perimeter of the island chain, transporting water from the Island of Hawai‘i, henceforth referred to as Big Island, along the MHI chain (Seki et al., 2001). Warm core eddies are spun up off the Big Island and travel southwest, transporting water away from the island chain (Bidigare et al., 2003). These eddies have the potential to boost primary production as well as aid with water dispersal or retention within the islands themselves (Seki, Lumpkin & Flament, 2002).
Figure 1 Main surface currents around Hawaii.Main surface currents around the Main Hawaiian Islands (afterLumpkin, 1998).
the larvae from being swept away from appropriate settlement habitat (Lobel & Robinson, 1983;Lobel, 1989;Lobel, 2011). The majority of spawning in Hawaiian reef fishes takes place during spring and summer (February through June), although most reef fish are believed to have low levels of spawning year round (Watson & Leis, 1974;Lobel, 1989;
Bushnell, Claisse & Laidley, 2010). Reef fish spawning season in Hawai‘i coincides with ‘‘eddy season’’ (Lobel & Robinson, 1983;Lobel, 1989;Lobel, 2011); that is, the time of year when eddies are more prevalent (Flament et al., 1996).Donahue et al. (2015)showed that timing of spawning and the subsequent timing with the presence of near shore eddies is more important than the location of spawning for larval settlement success in the lane snapper (Lutjanus synagris) off Cuba. In Hawai‘i, the temporal and spatial dynamics of eddy entrainment of propagules is not well understood, and while mesoscale eddies are shown to have an effect on larval dispersal elsewhere (Baums, Paris & Chérubin, 2006;
Harrison, Siegel & Mitarai, 2013), the effects of mesoscale eddies in larval transport and settlement in Hawai‘i has proven contradictory (Vaz et al., 2013), ranging from shown correlations between time of spawning and eddy activity (Lobel, 1989) to no observed effect on recruitment (Fox et al., 2012). Spawning has also been linked with lunar cycles, and many reef fishes in Hawai‘i are shown to spawn on or near full moon (Walsh, 1987;
Bushnell, Claisse & Laidley, 2010).
Studies on larval reef fish distributions suggest that larval abundances of insular marine fish that spawn pelagic eggs are more numerous off shore than near shore (seeLeis &
Miller, 1976, J Wren & D Kobayashi, pers. obs., 2011). Many of the most common reef fish species in Hawai‘i fall into this category, and larvae of Pomacentrids, Chaetodontids and Acanthurdis are very rare in inshore plankton tows, but numerous in deeper, offshore tows (Leis & Miller, 1976) although this does depend on the stages of the larvae sampled by the gear. Studying later stage larvaein situis generally intractable, because most shorefish larvae are not easily captured/identified/enumerated, are found in low densities, and are spread over large geographical areas (Clarke, 1991). One approach that could yield insights into the vertical and horizontal distributions of these elusive early life-history stages is using computer simulation coupled with field sampling (Botsford et al., 2009;
Leis, Herwerden & Patterson, 2011;Leis et al., 2013;Sponaugle et al., 2012;Kough, Paris & Butler, 2013;Wood et al., 2014).
Given the common spawning season and the presence of mesoscale eddies in the lee of the Hawaiian Islands, we wanted to test the hypothesis that there is a common ‘‘larval pool’’ in the lee of Big Island (Sale, 1978). This was accomplished with field sampling and through numerical modeling. We use two different biophysical modeling approaches to investigate larval distributions. The first approach uses a computer simulation to hindcast likely sites of propagule origin from midwater trawl samples and employs statistical tools to indicate the most likely vertical strata of propagule occupancy. This information will improve understanding of horizontal and vertical movements as well as be useful for targeted sampling of these elusive early life history stages. The second approach uses computer simulation to forecast field samples, in essence generating a virtual ‘‘larval pool,’’ and uses a similar comparative approach to identify the most likely vertical strata of propagule occupancy using observed and predicted patterns of relative larval abundance.
METHODS
Field sampling
Midwater trawl samples collected during the SE1104 research cruise aboard the NOAA shipOscar Elton SetteJuly 1-July 14, 2011 were used in this analysis. Two replicate 2-hour dual-warp Cobb midwater trawls (seeBaltz et al., 2002for gear specifications) were conducted nightly, at ca. 2100 and 0100 h, at a speed of 3 knots at 11 stations off the west coast of the Big Island (Fig. 2). Maximum trawl depth targeted the shallow scattering layer, and was determined nightly from EK60 active acoustics identification of the lower boundary of the shallow scattering layer, which ranged between 150–250 m. Each trawl sampled three depth strata evenly (stepped oblique) divided between 50 m and the deepest bounds of the scattering layer. Tow time for each depth interval was 20 min following net equilibration at the deepest depth, for a minimum duration of 1h at depth and a total trawl time of approximately 2h. The trawl is constructed of graded nylon mesh (6′, 3′′, and a 1.5′′liner terminated with a 1 mm Nitex plankton net) and has a mouth area
of approximately 690 m2at the most forward position of the coarsest mesh.
Figure 2 Location of trawl sites off Big Island of Hawai‘i.Location of Cobb trawl stations off the Kona coast of Hawai‘i Island used in this stud and visited by the SE1104 cruise.
zooplankton and miscellaneous zooplankton. From the non-Myctophid fish category, shore fish larvae were removed and preserved in 95% EtOH. Fish larvae from seven familial or similar groups, Chaetodontidae; Acanthuridae; Pomacanthidae; Labridae and Cirrhitidae; Muraenidae; Aulostomidae and Fistulariidae; and Mullidae, were measured and counted. These groupings were chosen because they are relatively easy to distinguish visually and their members are almost exclusively shore fish (Mundy, 2005;Randall, 2007). Identification to species level was not possible in the scope of this study due to time constraints and difficulty/impossibility of identification without genetic analysis (B Mundy, pers. comm., 2011) for many larval fish (e.g., Acanthurids, Pomacanthids). It is important to note that we used trawl catch data for the family of Acanthurids, not specifically forZebrasoma flavescens.
Dispersal modeling
Larval dispersal simulations were performed using a two dimensional, Lagrangian advec-tion diffusion model (Polovina, Kleiber & Kobayashi, 1999;DeMartini, Wren & Kobayashi, 2013). In the model, larvae are moved at each timestep by advective displacement caused by water flow combined with a random displacement caused by diffusion. Current velocities used by the model consist of daily snapshots of u (east) and v (north) velocities obtained from a regional implementation of the HYbrid Coordinate Ocean Model (HYCOM) for the Main Hawaiian Islands (MHI) (HYCOM described in the following
section). We used an eddy diffusivity of 250 m2/s, which is derived from drifters in the
MHI (Y Jia, pers. comm., 2012, Rivera et al., 2011). Spawning habitat was defined in the model as a suite of 302 sites uniformly located every 5 km around the perimeter of each of the emergent MHI. The dispersal model is conventionally run forward in time, but is capable of running in reverse (backwards in time) for hindcasting purposes, facilitated by using off-line storage arrays of the daily currents.
Ocean circulation data
The HYbrid Coordinate Ocean Model (HYCOM), a data-assimilative ocean circulation model developed by the multi-institution HYCOM Consortium, was the source of the modeled ocean circulation flow fields used in this study. Forcing and assimilation for HYCOM are accomplished using the Navy Operational Global Atmospheric Prediction System (NOGAPS) winds to drive the dynamics, and the Navy Coupled Ocean Data Assimilation (NCODA) system to incorporate external measurements of satellite
altimetry, sea surface temperature, andin-situvertical profiles of temperature and salinity. The NOGAPS and NCODA data can vary in temporal resolution from hours to weeks as well as be snapshot inputs from vessels, moorings, or profiling buoys; however, the standard temporal resolution of the HYCOM output data is daily, which is what was used in this study (Jia et al., 2011). The daily HYCOM data is a regional implementation of the University of Miami global model using K-Profile Parameterization for characterizing the mixed layer, and is made available at the Asia-Pacific Data-Research Center (APDRC) at the International Pacific Research Center (IPRC), School of Ocean and Earth Science and Technology (SOEST), University of Hawai‘i (point of contact Dr. Yanli Jia). Daily HYCOM data covering the temporal domain of the calendar year 2011 and the spatial domain of 166◦W to 150◦W longitude and 16◦N to 26◦N latitude were downloaded as
NetCDF files using the APDRC/IPRC website as a data conduit.
HYCOM is vertically structured with 32 layers ranging in thickness from 5–500 m, with thinner layers in the upper portions of the water column and an average layer width of 10 m in the upper 40 m of the water column. For this exercise, several different vertical strata and averages of vertical strata of the HYCOM data were used: surface waters representing the upper 5 m only, 50 m depth only, 100 m depth only, 0–50 m average, and 0–100 m average. Extraction and averaging was undertaken using R language subroutines (R Core Team, 2012). The horizontal structure of the HYCOM is a variable width resolution averaging∼0.04 degree over both longitude and latitude. For ease of use, the daily variable resolution output was regridded to a daily uniform 0.04 degree coordinate system in latitude and longitude for the study domain using the mapping software Generic Mapping tools (GMT) subroutines namedblockmeanandsurface (Wessel & Smith, 1991).
Hindcast simulation
depth strata of occupancy for larval shore fish caught at the 11 trawl sites by comparing the five different depth scenarios (depths=the upper 5 m, 50 m depth, 100 m depth, 0–50 m average, and 0–100 m average) and by using a plausible range of pelagic larval durations (PLDs=15, 30, 45, 60, and 75 days). The averaged depth strata were used in
an effort to emulate diel vertical migration (DVM) over 50 m and 100 m vertical horizons, realizing that this is only an approximation of what DVM would cause. For each trawl sample and PLD/depth combination, 1,000 simulated hindcast trajectories were generated for analysis. When a particle was within 5 km of the 302 pre-defined spawning sites on day 1 it was defined as originating from that spawning area.
Forecast simulation
In the forecast simulation the dispersal model was run in conventional forward mode. This approach was intended to simulate a generic ‘‘larval pool’’ for shorefish (sensuSale, 1978), and specifically for the yellow tang,Zebrasoma flavescens. We used the HYCOM current vectors from the 100 m depth layer, based on results from our hindcast simulation (see results section) and the PLD was parameterized after the yellow tang and set to 54 days (Claisse, McTee & Parrish, 2009;Christie et al., 2010). Size at settlement for Z. flavescensis estimated at 30–55 mm total length (Claisse, McTee & Parrish, 2009). Virtual larvae were released daily from the spawning habitat during 2011. For each of the 302 release sites and for each day, 1,000 simulated forecast trajectories were generated for analysis. Pelagic abundance of older larvae (defined as ages≥50% of PLD) was tabulated into daily 0.1◦×0.1◦bins for the trawl survey dates, and actual larval catch of
Acanthurids was compared to simulated larval abundance at that point in time and space. There are to our knowledge no published growth rates for larval yellow tang, thus the age of the Acanthurids used to parameterize our model are estimates. Based on the size at settlement (∼30 mm) and a 55 day PLD, we felt comfortable comparing trawl catch with data modeled using a 54 day PLD and estimating the larval pool using 50% of the PLD.
Statistical methods
A generalized additive model (GAM) was constructed in R using the mgcv package (Wood, 2011), and used to characterize effects from vertical layering and PLD on the predicted origin. Operationally this was accomplished by using the GAM to predict hindcast settlement success. Smoother functions for the significant terms were plotted and examined. Degrees of freedom for the smoothing splines were scrutinized and inten-tionally kept as low as possible (1–2 inflection points) to minimize issues of overfitting the data.
GAM was also used to characterize the relationships between actual larval catch and simulated larval abundance. We usedin situAcanthurid abundances from trawl catches and compared them to modeled abundances from the forecast simulation parameterized afterZebrasoma flavescens. A key linkage between larval abundance and larval catch involves efficiency of the sampling gear (e.g.,Clarke, 1983), thus the GAM was parameterized with variables that have been known to impact visual avoidance such as moon phase and moon angle. Additionally, moon phase is known to affect biomass
and abundance of mesophotic boundary layer communities in the study region (Drazen, Forest & Domokos, 2011). Moon data was obtained from the open source astronomical package named PyEphem written in the programming language Python. Moon phase and moon angle were calculated for the individual trawls based on their position, date, and time of day/night. Because both the moon phase (amount of illumination) and moon angle (important scalar of the amount of illumination) could be independently or jointly important we entered them as a bivariate smoothing term in the GAM function. Thek term for the smoothers were set tok=5 for simulated larval abundance andk=6 for the
moon phase and moon angle smoothing term (to keep inflection points at a reasonable level), and a Poisson distribution was assumed for the GAM. While there are likely many other variables that could relate to the efficiency of the sampling gear, these were thought to be the most important because tow speed and weather conditions were relatively constant over the course of these surveys.
RESULTS
Field sampling
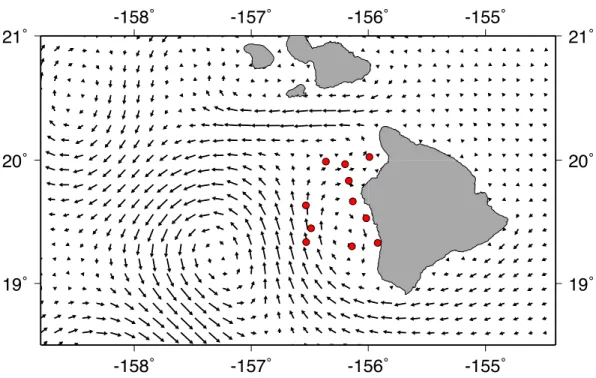
A strong cyclonic eddie was present off the west shore of Big Island during field sampling. Additionally, there was a weaker, anti-cyclonic eddie near shore, moving water southward along the coast south of Kailua-Kona. Mean circulation on the Kohala shelf was north-eastward until the ‘Alenuih¯ah¯a channel (between Maui and Big Island) pushed surface waters westward (Fig. 3). Most of our stations were located in the smaller anti-cyclonic eddy near the Kona coast. Trawling took place between a new moon on June 30, 2011 and a full moon on July 14, 2011.
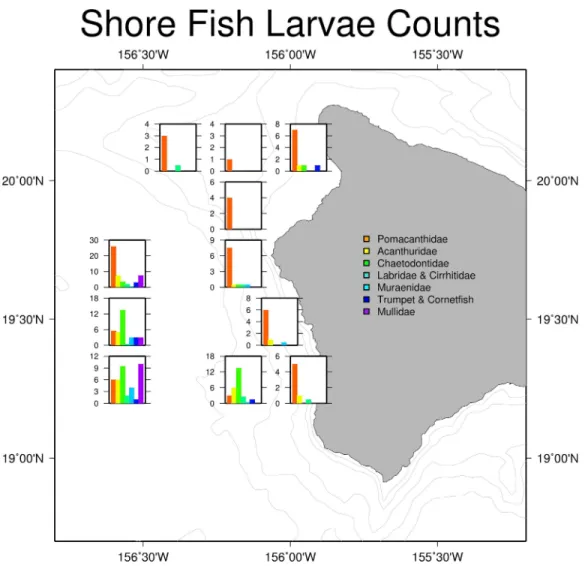
Larval shore fish counts were highest in stations further offshore (Fig. 4), consistent with the observations of Leis & Miller (1976)andLeis (1982). Offshore stations had the greatest diversity of shore fish, with individuals from all seven familial groups present (Table 1). Acanthurids were present at 8 of the 11 stations and mirrored total shorefish abundance patterns in the trawl catch (Fig. 4). Variability between replicates was low relative to variability between stations. The average length of the collected Acanthurids was 26.1 mm pre-caudal length (PCL); near their size at recruitment (Claisse et al., 2009).
Hindcasting simulation
A GAM was constructed to identify effects from vertical layering and PLD on the predicted origin by using these variables in a model predicting hindcast settlement success. PLD is highly significant (p<0.001) for dispersal in the model. The PLD function shows that shorter PLD’s coincide with higher hindcast settlement success, and that after 40 days there is little change in the probability of originating from a suitable adult habitat (Fig. 5A). After 40 days of dispersal, the effect PLD has on dispersal ability remains stable, indicating that fish with PLDs longer than 40 days have the same potential for dispersal based on PLD alone. Thus, a 45 day PLD can be representative for longer PLDs, which has implications for future dispersal modeling as well as predicting dispersal ability based on PLD alone.
Table 1 Trawl data from SE1104 cruise July 2011.Summarizing larval shore fish counts from seven familial groups, as well as latitude, longitude and moon phase for all stations visited during SE1104 cruise from July1 to July 14th, 2011. Trawl 6 and 8 has no data on larval shore fish abundance because the cod end of the trawl was compro-mised by cookie cutter sharks (Isistius brasiliensis) and trawl catch lost.
Trawl number
Station number
Longitude Latitude Moon phase
Moon angle
Pomacanthidae Acanthuridae Chaetodontidae Labridae & Cirrhitidae
Muraenidae Fistulariidae Mullidae
1 1 203.50 19.65 4.5 36.8 24 5 2 3 1 2 15
2 1 203.47 19.63 5.4 58.2 28 10 5 1 0 4 0
3 2 203.87 19.67 10.4 25.0 14 1 1 1 1 0 0
4 2 203.87 19.67 11.9 52.9 1 0 0 0 0 0 0
5 3 203.80 19.98 18.4 12.7 2 0 0 0 0 0 0
7 4 204.03 20.01 28.0 0.7 7 1 1 0 0 1 0
9 5 203.85 19.30 38.9 0.0 1 7 5 0 0 1 0
10 5 203.86 19.30 40.8 24.8 5 5 22 5 1 2 0
11 6 203.49 19.35 50.4 0.0 5 4 4 4 2 2 17
12 6 203.47 19.34 52.3 13.6 7 8 15 0 6 0 3
13 7 203.54 19.50 61.8 0.0 3 6 12 1 4 4 6
14 7 203.51 19.45 63.6 2.5 8 4 15 0 2 2 0
15 8 204.17 19.33 72.9 0.0 4 2 0 1 0 0 0
16 8 204.08 19.33 74.2 0.0 6 0 0 0 0 0 0
17 9 203.98 19.53 82.0 0.0 4 0 0 0 1 0 0
18 9 203.98 19.53 83.4 0.0 8 2 0 0 0 0 0
19 10 203.81 19.86 89.8 0.0 1 0 0 0 0 0 0
20 10 203.83 19.83 90.9 0.0 7 0 0 0 0 0 0
21 11 203.64 19.99 95.5 0.0 1 0 0 1 0 0 0
22 11 203.64 19.99 96.2 0.0 5 0 0 0 0 0 0
W
ren
and
K
oba
y
ashi
(2016),
P
eerJ
,
DOI
10.7717/peerj.1636
Figure 3 Current vectors during field sampling.Mean HYCOM currents between July 2 and July13, 2011, for Big Island of Hawai‘i. Red circles show trawl sites during field sampling.
(p<0.001) followed by the 50 m depth layer (p<0.05) (Fig. 5B). There is no statistically significant difference between the effect of the surface strata or the two averaged (0–50 m and 0–100 m) strata on origin sites according to the GAM, indicating that the surface layer is disproportionally influencing the averaged depth scenarios.
Forecasting simulation
The forecast simulations showed that actual larval catch was significantly related to simulated larval abundance (p<0.05) with the moon phase and moon angle surface
(p<0.001) explaining 67.5% of the deviance (Fig. 6). The relationship between the larval catch and simulated larval abundance was positive and the moon variables were incorporated with lower larval catch associated with higher moon angle (moon higher in the sky) and higher moon phase (brighter moon). There was indication of an intermediate moon phase corresponding to higher larval catch visualized by the hump on the surface in
Fig. 6.
DISCUSSION
Figure 4 Larval shore fish trawl catch at each site.Summary of larval shorefish catch from Cobb trawl samples used in this study. Bar graphs show average counts of larval shore fish for each station caught during the SE1104 cruise. The graphs are placed in the location of the trawl.
shore, lending further evidence of the presence of a common larval pool in the water off Kona (Sale, 1978).
There is ample evidence that larval fish undergo both ontogenic and diel vertical migration and that incorporating these behaviors into a biophysical model can increase the predictive power of the model (Drake, Edwards & Barth, 2011;Drake et al., 2013;Sponaugle et al., 2012;Sundelöf & Jonsson, 2012;Robins et al., 2013;Bidegain et al., 2013). However, little is known about the behavior of larval Acanthurids in general and Z. flavescensin particular. There are published swimming speeds for Acanthurids in the field and they illustrate a highly variable behavior and swimming speeds of late stage larvae (Sancho, Ma & Lobel, 1997;Leis & Carson-Ewart, 2000). Our model is parameterized for larvae approximately half way through their larval period (compared with in sitularvae that range between 10 and 30 mm in standard length). With such variable size and range of developmental stages, we could not venture a guess as to the swimming speed of the larvae,
Figure 5 Effect of PLD and depth on modeled larval success.Generalized additive model output show-ing relationships between modeled settlement success and (A) pelagic larval duration (PLD) and (B) depth strata used in biophysical model. Higher values denote higher modeled settlement success. Gray areas shows±two standard errors.
Figure 6 Relationship between larval catch and modeled abundance, and effect of moon on that catch.
Generalized additive model output showing relationship between trawled larval abundance of Acanthurids and (A) simulated larval Acanthurid abundance and (B) a moon phase and moon angle surface. The linear predictor is the observed and modeled abundance from figure (A). Higher values denote higher values of modeled larval catch and gray area in (A) shows±two standard errors.
be a physical oceanography-driven aggregation area for lobster larvae that could play an important role in the management of the lobster stock.
The presence of a mesoscale eddie during field sampling may have helped retain larvae near the trawl sites, driving the pattern of observed as well as modeled larval distributions. It has long been hypothesized that the eddies that form along the Kona coast are responsible for retaining larvae nearshore (Sale, 1970;Leis & Miller, 1976;Lobel, 1989;Lobel, 2011;Vaz et al., 2013), thus increasing he chance of settlement success and self-recruitment. Eddies form off Kona mainly during summer when the trade winds are stronger, which coincides with the major spawning season of most Hawaiian reef fish (Walsh, 1987;Bushnell, Claisse & Laidley, 2010). The eddies develop 10–15 days after a strong wind event and last for 55–70 days (Patzert, 1969;Lobel & Robinson, 1986). The majority of eddies move northwest at approximately 6 cm/s, which may aid in transporting larvae away from the Big Island and along the south perimeter of the Main Hawaiian Island chain (Patzert, 1969;Vaz et al., 2013). However, some eddies remain stationary in the lee of Big Island, and have been observed to remain in that location for 70 days (Lobel & Robinson, 1986), making it possible for larvae spawned on reefs along the leeward coast of the Big Island to be entrained in eddies and remain near the coast for the duration of their pelagic larval stage.
The larger ‘off shore’ eddie present during our field sampling (Fig. 3) spun up on or near June 1, 2011 and was present throughout sampling, whereas the smaller eddie located close to shore during field sampling spun up on or near July 3, 2011 and lasted the duration of field sampling. Considering thatZ. flavescensspawns at full moon (Bushnell, Claisse & Laidley, 2010) and the PLD is estimated at 55 days (Claisse, McTee & Parrish, 2009;Christie et al., 2010), it is likely that larvae we caught during trawling were spawned near the full moon on either May 17 or June 16, 2011 and possibly entrained in the eddie shortly thereafter. Genetic analysis of the Acanthurid larvae can be done to verify the origin location of the larvae against published genetic connectivity data (Eble, Toonen & Bowen, 2009;Christie et al., 2010).
The hindcast simulation showed that larvae can reach the full extent of the Main Hawaiian Islands (MHI) in 40–45 days, which is important for future dispersal modeling studies. Connectivity patterns in the MHI will not change significantly if PLD is increased past 45 days, thus connectivity studies using a 45 day PLD can be representative of fish species with a longer PLD in Hawai‘i. The results from the hindcasting simulation suggest that the larvae should primarily occupy the 100 m depth layer if settlement success is the primary driver. Little is known about larval shore fish depth distributions around the Hawaiian Islands, however Acanthurid larvae have been found as deep as 575 m in the Caribbean, with the highest concentrations at or slightly above the chlorophyll a maximum (Oxenford, Fanning & Cowen, 2008) which in the study was at 100 m.
Boehlert & Mundy (1996)reported that Acanthurids are found in the upper 80 m in waters off O‘ahu (mean mixed layer depth at Station ALOHA north of O‘ahu (22◦45′N,
158◦ 00′W) is 60.1 m (http://hahana.soest.hawaii.edu/hot/hot-dogs/mldepth.html)).
The chlorophyll maximum at Station ALOHA is located near 110 m depth and the salinity maximum near 100 m (http://hahana.soest.hawaii.edu/hot/methods/chl.html;
http://hahana.soest.hawaii.edu/hot/methods/salinity.html), making our hypothesis derived from model results that larvae should occupy the 100 m depth layer plausible.
By identifying both physical and biological features, such as preferred depth strata and the effect of PLD on dispersal ability, we can better understand and evaluate population dynamics in fish or invertebrate populations. Essential Fish Habitat (EFH) mapping is used in determining areas of high importance for a variety of commercially important fish species, but little to no consideration is taken to the larval stage of the fishes (D Kobayashi, pers. comm., 2012; Warner, Swearer & Caselle, 2000). Additionally, creating an archipelago-wide larval hotspot map will aid in identifying important larval fish habitat and this study lays the groundwork for that effort. The approach of generating a baseline population of organisms and applying a simulated capture process to allow comparison with actual catch data is similar to approaches used in stock assessment methodologies. The methodological approach called stock synthesis (Methot, 1990) is an example of such an inverse type approach (Murray-Smith, 2000). This approach is of value for identifying complex yet important drivers of the system under study when an observed value is the synergistic result of layered and interacting processes. In such instances, the parameters cannot be simply incorporated in conventional linear approaches modeling observed values against a suite of predictor variables. The insights into the capture process presented here might be useful for future inverse modeling of insular fish stocks and their recruitment dynamics.
As more detailed abundance, behavior and growth data become available for
Zebrasoma flavescence, the modeling approach can be better tuned to model both patterns of connectivity and the spatiotemporal nature of the ‘‘larval pool.’’ Future trawl surveys can test the hypothesis of the 100 m depth occupancy, as well as target areas that are predicted to have high larval abundance if specimen acquisition is prioritized. Similarly, such areas of high larval abundance can potentially be protected from deleterious effects in an effort to preserve essential fish habitat and areas of particular concern, ideas that have received national attention in both the public and scientific communities (Warner, Swearer & Caselle, 2000;Kough, Paris & Butler, 2013). If species are recruitment-limited and/or the propagules are localized and vulnerable in time and space, pelagic areas might be warranted for management scrutiny.
ACKNOWLEDGEMENTS
The authors would like to thank RJ Toonen for advice and support, B Mundy for invaluable help with larval fish identifications, Y Jia for HYCOM data, and the reviewers whose comments greatly improved this manuscript. We also thank the crew of NOAA Research Vessel Oscar Elton Sette and J Denton, A Shimada, N Shoji, M Seki, M Duncan, L Richards and E Howell for help with trawling and sorting.
ADDITIONAL INFORMATION AND DECLARATIONS
Funding
Funds for JLKW were provided by the Kona Integrated Ecosystem Assessment Program of NOAA Fisheries, Pacific Islands Fisheries Science Center, with additional support provided by the HIMB-NWHI partnership (MOA-2009-039/7932), NSF (OCE 12-60169) and SeaGrant (NA14OAR4170071). This is SOEST contribution number 9562. The funders had no role in study design, data collection and analysis, decision to publish, or preparation of the manuscript.
Grant Disclosures
The following grant information was disclosed by the authors: Kona Integrated Ecosystem Assessment Program of NOAA Fisheries. Pacific Islands Fisheries Science Center.
HIMB-NWHI: MOA-2009-039/7932. NSF: OCE 12-60169.
SeaGrant: NA14OAR4170071.
Competing Interests
Donald R. Kobayashi is an employee of NOAA Fisheries, Pacific Islands Fisheries Science Center.
Author Contributions
• Johanna L. K. Wren conceived and designed the experiments, performed the experiments, analyzed the data, contributed reagents/materials/analysis tools, wrote the paper, prepared figures and/or tables, reviewed drafts of the paper.
• Donald R. Kobayashi conceived and designed the experiments, performed the experiments, analyzed the data, contributed reagents/materials/analysis tools, wrote the paper, reviewed drafts of the paper.
Data Availability
The following information was supplied regarding data availability: Raw data is available in theSupplemental Information.
Supplemental Information
Supplemental information for this article can be found online athttp://dx.doi.org/10.7717/ peerj.1636#supplemental-information.
REFERENCES
Baltz K, Field J, Ralston S, Sakuma K. 2002.Operations manual—juvenile rockfish
recruitment survey trawling protocols. La Jolla: Southwest Fisheries Science Center, NOAA Fisheries. 21 pp.
Baums IB, Paris CB, Chérubin LM. 2006.A bio-oceanographic filter to larval
dis-persal in a reef-building coral.Limnology and Oceanography51:1969–1981
DOI 10.4319/lo.2006.51.5.1969.
Bidegain G, Bárcena JF, García A, Juanes JA. 2013.LARVAHS: predicting clam larval
dispersal and recruitment using habitat suitability-based particle tracking model. Ecological Modelling 268:78–92DOI 10.1016/j.ecolmodel.2013.07.020.
Bidigare RR, Benitez-Nelson C, Leonard CL, Quay PD, Parsons ML, Foley DG,
Seki MP. 2003.Influence of a cyclonic eddy on microheterotroph biomass
and carbon export in the lee of Hawaii.Geophysical Research Letters30:1318
DOI 10.1029/2002GL016393.
Boehlert GW, Mundy BC. 1996. Ichthyoplankton vertical distributions near Oahu,
Hawai‘i, 1985–1986: data report. In:NOAA Technical Memoir, NMFS-SWSC-235. Washington, D.C.: NOAA. 1–148.
Botsford LW, Brumbaugh DR, Grimes C, Kellner JB, Largier J, O’Farrell MR, Ralston
S, Soulanille E, Wespestad V. 2009.Connectivity, sustainability, and yield: bridging
the gap between conventional fisheries management and marine protected areas. Reviews in Fish Biology and Fisheries19:69–95DOI 10.1007/s11160-008-9092-z.
Browman HI, Stergiou KI, Browman CHI, Cury PM, Hilborn R, Jennings S, Lotze HK,
Mace PM, Murawski S, Pauly D, Sissenwine M, Zeller D. 2004.Perspectives on
ecosystem-based approaches to the management of marine resources.Marine Ecology Progress Series274:269–303DOI 10.3354/meps274269.
Bushnell ME, Claisse JT, Laidley CW. 2010.Lunar and seasonal patterns in fecundity
of an indeterminate, multiple-spawning surgeonfish, the yellow tangZebrasoma flavescens.Journal of Fish Biology76:1343–61DOI 10.1111/j.1095-8649.2010.02569.x.
Chavanne C, Flament P, Lumpkin R, Dousset B, Bentamy A. 2002.Scatterometer
observations of wind variations induced by oceanic islands: implications for wind-driven ocean circulation.Canadian Journal of Remote Sensing28:466–474
DOI 10.5589/m02-047.
Christie MR, Tissot BN, Albins MA, Beets JP, Jia Y, Ortiz DM, Thompson SE, Hixon
MA. 2010.Larval connectivity in an effective network of marine protected areas.
PLoS ONE5:e15715DOI 10.1371/journal.pone.0015715.
Claisse JT, Kienzle M, Bushnell ME, Shafer DJ, Parrish JD. 2009.Habitat-and
sex-specific life history patterns of yellow tangZebrasoma flavescensin Hawaii, USA. Marine Ecology Progress Series389:245–255DOI 10.3354/meps08114.
Claisse JT, McTee SA, Parrish JD. 2009.Effects of age, size, and density on natural
Clarke TA. 1991.Larvae of nearshore fishes in oceanic waters near Oahu, Hawaii. Wash-ington, D.C.: US Department of Commerce, National Oceanic and Atmoospheric Administration, National Marine Fisheries Service.
Clarke TA. 1983.Comparison of abundance estimates of small fishes by three towed nets
and preliminary results of the use of small purse seines as sampling devices.Biological Oceanography 2(2–4):311–340DOI 10.1080/01965581.1983.10749464.
Cowen RK, Gawarkiewicz G, Pineda J, Thorrold SR, Werner FE. 2007.
Popu-lation connectivity in marine systems an overview.Oceanography20:14–21
DOI 10.5670/oceanog.2007.26.
Cowen RK, Sponaugle S. 2009.Larval dispersal and marine population connectivity.
Annual Review of Marine Science1:443–466
DOI 10.1146/annurev.marine.010908.163757.
DeMartini EE, Wren JLK, Kobayashi DR. 2013.Persistent spatial patterns of recruitment
in a guild of Hawaiian coral reef fishes.Marine Ecology Progress485:165–179
DOI 10.3354/meps10306.
Donahue MJ, Karnauskas M, Toews C, Paris CB. 2015.Location isn’t everything: timing
of spawning aggregations optimizes larval replenishment.PLoS ONE10:e0130694
DOI 10.1371/journal.pone.0130694.
Drake PT, Edwards CA, Barth JA. 2011.Dispersion and connectivity estimates along the
US west coast from a realistic numerical model.Journal of Marine Research69:1–37
DOI 10.1357/002224011798147615.
Drake PT, Edwards CA, Morgan SG, Dever EP. 2013.Influence of larval
be-havior on transport and population connectivity in a realistic simulation of the California Current System.Journal of Marine Research71:317–350
DOI 10.1357/002224013808877099.
Drazen JC, Forest LGDe, Domokos R. 2011.Micronekton abundance and biomass
in Hawaiian waters as influenced by seamounts, eddies, and the moon.Deep Sea Research Part I: Oceanographic Research Papers58:557–566
DOI 10.1016/j.dsr.2011.03.002.
Eble JA, Toonen RJ, Bowen BW. 2009.Endemism and dispersal: comparative
phylo-geography of three surgeonfishes across the Hawaiian Archipelago.Marine Biology
156:689–698DOI 10.1007/s00227-008-1119-4.
Flament P, Kennan S, Lumpkin R, Sawyer M, Stroup ED. 1996. Ocean atlas of Hawai‘i:
regional processes. Manoa: University of Hawai’i.Available athttp:// oos.soest.hawaii. edu/ pacioos/ outreach/ oceanatlas.
Fogarty MJ, Botsford LW. 2007.Population connectivity.Oceanography20:112
DOI 10.5670/oceanog.2007.34.
Fox HE, Haisfield KM, Brown MS, Stevenson TC, Tissot BN, Walsh WJ, Williams
ID. 2012.Influences of oceanographic and meteorological features on reef
fish recruitment in Hawai‘i.Marine Ecology Progress Series463:259–272
DOI 10.3354/meps09838.
Friedlander A, Kobayashi D, Bowen B, Meyers C, Papastamatiou Y, DeMartini E,
Parrish F, Treml E, Currin C, Hilting A, Weiss J. 2009. Connectivity and integrated
ecosystem studies. A Marine Biogeographic Assessment of the Northwestern Hawai-ian Islands. Washington, D.C.: NOAA. 291–330.Available athttp:// coastalscience. noaa.gov/ datasets/ e98/ docs/ nwhi-2009.pdf.
Gaines SD, White C, Carr MH, Palumbi SR. 2010.Designing marine reserve
net-works for both conservation and fisheries management.Proceedings of the Na-tional Academy of Sciences of the United States of America107:18286–18293
DOI 10.1073/pnas.0906473107.
Gerber LR, Beger M, McCarthy MA, Possingham HP. 2005.A theory for optimal
monitoring of marine reserves.Ecology Letters8:829–837
DOI 10.1111/j.1461-0248.2005.00784.x.
Halpern BS, Lester SE, Kellner JB. 2009.Spillover from marine reserves and the
replenishment of fished stocks.Environmental Conservation36:268–276
DOI 10.1017/S0376892910000032.
Harrison CS, Siegel DA, Mitarai S. 2013.Filamentation and eddy-eddy interactions in
marine larval accumulation and transport.Marine Ecology Progress Series472:27–44
DOI 10.3354/meps10061.
Hellberg ME. 2009.Gene flow and isolation among populations of marine animals.
Annual Review of Ecology, Evolution, and Systematics40:291–310
DOI 10.1146/annurev.ecolsys.110308.120223.
Hilborn R. 2011.Future directions in ecosystem based fisheries management: a personal
perspective.Fisheries Research108:235–239DOI 10.1016/j.fishres.2010.12.030.
Jia Y, Calil PHR, Chassignet EP, Metzger EJ, Potemra JT, Richards KJ, Wallcraft a J.
2011.Generation of mesoscale eddies in the lee of the Hawaiian Islands.Journal of
Geophysical Research116:C11009DOI 10.1029/2011JC007305.
Jones GP, Srinivasan M, Almany GR. 2007.Population connectivity and conservation of
marine biodiversity.Oceanography20:100–111.
Kappel CV, Martone RG, Duffy JE. 2006. Earth Encycl. In: Cleveland CJ, ed.
Ecosystem-based management. Washington, D.C.: Environmental Information Coalition, National Council for Science and the Environment, 1–4.
Knight-Jones EW. 1953.Laboratory experiments on gregariousness during setting in
Balanus balanoides and other barnacles.Journal of Experimental Biology 30:584–598.
Kough AS, Paris CB, Butler IV MJ. 2013.Larval connectivity and the international
man-agement of fisheries.PLoS ONE8(6): e64970DOI 10.1371/journal.pone.0064970.
Leis JM. 1982.Nearshore distributional gradients of larval fish (15 taxa) and planktonic
crustaceans (6 taxa) in hawaii.Marine Biology 72:89–97DOI 10.1007/BF00393952.
Leis JM, Carson-Ewart BM. 2000.Behaviour of pelagic larvae of four coral-reef fish
species in the ocean and an atoll lagoon.Coral Reefs19:247–257.
Leis JM, Caselle JE, Bradbury IR, Kristiansen T, Llopiz JK, Michael J, Connor MIO, Paris CB, Shanks AL, Sogard SM, Swearer SE, Vetter RD, Warner RR,
Miller MJ, Treml EA. 2013.Does fish larval dispersal differ between high and
low latitudes?Proceedings of the Royal Society B-Biological Science280: 20130327
Leis JM, Herwerden L Van, Patterson HM. 2011.Estimating connectivity in marine fish populations: what works best?Oceanography and Marine Biology49:193–234.
Leis JM, Miller JM. 1976.Offshore distributional patterns of Hawaiian fish larvae.Marine
Biology36:359–367DOI 10.1007/BF00389198.
Lester SE, Costello C, Halpern BS, Gaines SD, White C, Barth JA. 2013.Evaluating
tradeoffs among ecosystem services to inform marine spatial planning.Marine Policy
38:80–89DOI 10.1016/j.marpol.2012.05.022.
Levin LA. 2006.Recent progress in understanding larval dispersal: new directions and
digressions.Integrative and Comparative Biology46:282–297 DOI 10.1093/icb/icj024.
Lobel PS. 1989.Ocean current variability and the spawning season of Hawaiian reef
fishes.Environmental Biology of Fishes24:161–171 DOI 10.1007/BF00001221.
Lobel PS. 2011.Transport of reef lizardfish larvae by an ocean eddy in Hawaiian waters.
Dynamics of Atmospheres and Oceans52:119–130 DOI 10.1016/j.dynatmoce.2011.01.001.
Lobel PS, Robinson AR. 1983. Reef fishes at sea: ocean currents and the advection of
larvae. In:The ecology of deep and shallow coral reefs, NOAA symposium series for underwater research, vol. 1, no. 1. Washington, D.C.: NOAA. 29–38.Available at http:// www.aoml.noaa.gov/ general/ lib/ CREWS/ Cleo/ St.%20Croix/ salt_river25.pdf.
Lobel PS, Robinson AR. 1986.Transport and entrapment of fish larvae by ocean
mesoscale eddies and currents in Hawaiian waters.Deep Sea Research Part A. Oceanographic Research Papers33:483–500 DOI 10.1016/0198-0149(86)90127-5.
Lumpkin CF. 1998.Eddies and currents of the Hawaiian Islands. Doctoral dissertation,
University of Hawaii, Honolulu, Hawaii.
Marshall DJ, Krug PJ, Kupriyanova EK, Byrne M, Emlet RB. 2012.The biogeography
of marine invertebrate life histories.Annual Review of Ecology, Evolution, and Systematics43:97DOI 10.1146/annurev-ecolsys-102710-145004.
McLeod KL, Leslie HM. 2009.McLeod KL, Leslie HM, eds.Ecosystem-based management
for the oceans. Washington, D.C.: Island Press.
Methot RD. 1990.Synthesis model: an adaptable framework for analysis of diverse
stock assessment data. Symposium on application of stock assessment techniques to Gadoids.International North Pacific Fisheries Commission Bulletin50:259–277.
Meyer CG, Holland KN, Wetherbee BM, Lowe CG. 2000.Movement patterns, habitat
utilization, home range size and site fidelity of whitesaddle goatfish, Parupeneus porphyreus, in a marine reserve.Environmental Biology of Fishes59:235–242
DOI 10.1023/A:1007664813814.
Meyer CG, Papastamatiou YP, Clark TB. 2010.Differential movement patterns and site
fidelity among trophic groups of reef fishes in a Hawaiian marine protected area. Marine Biology 157:1499–1511DOI 10.1007/s00227-010-1424-6.
Muhling BA, Beckley LE. 2007.Seasonal variation in horizontal and vertical structure
of larval fish assemblages off south-western Australia, with implications for larval transport.Journal of Plankton Research29:967–983DOI 10.1093/plankt/fbm072.
Mundy BC. 2005.Checklist of the fishes of the Hawaiian Archipelago. Honolulu: Bishop
Museum Press.
Murray-Smith DJ. 2000.The inverse simulation approach: a focused review of meth-ods and applications.Mathematics and Computers in Simulation53:239–247
DOI 10.1016/S0378-4754(00)00210-X.
Olivar MP, Sabate A. 1997.Vertical distribution of fish larvae in the north-west
Mediter-ranean Sea in spring.Marine Biology 129:289–300DOI 10.1007/s002270050169.
Oxenford HA, Fanning P, Cowen RK. 2008. Spatial distribution of surgeonfish
(Acan-thuridae) pelagic larvae in the eastern Caribbean. In: Grober-Dunsmore R, Keller BD, eds.Caribbean connectivity: implications for marine protected area management. NOAA Marine Sanctuaries Conservation Series ONMS-08-07. Washington, D.C.: NOAA, 42–51.
Patzert WC. 1969.Eddies in Hawaiian waters. Tech. Rep. HIG-69-8, Hawaii Institute of
Geophysics. University of Hawaii, Honolulu.
Pikitch EK, Santora C, Babcock EA, Bakun A, Bonfil R, Conover DO, Dayton P,
Doukakis P, Fluharty D, Heneman B, Houde ED, Link J, Livingston PA, Mangel M,
McAllister MK, Pope J, Sainsbury KJ. 2004.Ecosystem-based fishery management.
Science305:346–347DOI 10.1126/science.1098222.
Pineda JS, Hare JA, Sponaugle S. 2007.Larval transport and dispersal in the coastal
ocean and consequences for population connectivity.Oceanography 20:22–39
DOI 10.5670/oceanog.2007.27.
Polovina JJ, Kleiber P, Kobayashi DR. 1999.Application of TOPEX-POSEIDON
satellite altimetry to simulate transport dynamics of larvae of spiny lobster, Panulirus marginatus, in the Northwestern Hawaiian Islands, 1993–1996.Fishery Bulletin
97:132–143.
Qiu B, Durland TS. 2002.Interaction between an island and the ventilated thermocline:
implications for the Hawaiian Lee Countercurrent.Journal of Physical Oceanography
32:3408–3426DOI 10.1175/1520-0485(2002)032<3408:IBAIAT>2.0.CO;2.
Raff RA. 2008.Origins of the other metazoan body plans: the evolution of larval forms.
Philosophical Transactions of the Royal Society B: Biological Sciences363:1473–1479
DOI 10.1098/rstb.2007.2237.
Randall JE. 2007.Reef and shore fishes of the Hawaiian Islands. Honolulu: Sea Grant
College Program, University of Hawaii press.
R Core Team. 2012.R: a language and environment for statistical computing. R
Foun-dation for Statistical Computing, Vienna, Austria.Available athttps:// www.R-project.org/.
Rivera MAJ, Andrews KR, Kobayashi DR, Wren JLK, Kelley CD, Roderick GK,
Toonen RJ. 2011.Genetic analyses and simulations of larval dispersal reveal
distinct populations and directional connectivity across the range of the hawaiian grouper (Epinephelus quernus).Journal of Marine Biology 2011: Article ID 765353
DOI 10.1155/2011/765353.
Robins PE, Neill SP, Giménez L, Jenkins SR, Malham SK. 2013.Physical and biological
Sale PF. 1978.Coexistence of coral reef fishes—a lottery for living space.Environmental Biology of Fishes3:85–102DOI 10.1007/BF00006310.
Sale PF. 1970.Distribution of larval Acanthuridae off Hawaii.Copeia1970:765–766
DOI 10.2307/1442323.
Sancho G, Ma D, Lobel PS. 1997.Behavioral observations of an upcurrent reef
colo-nization event by larval surgeonfish Ctenochaetus strigosus (Acanthuridae).Marine Ecology Progress Series153:311–315DOI 10.3354/meps153311.
Scheltema RS. 1971.Larval dispersal as a means of genetic exchange between
geography-cally separated populations of shallow-water benthic marine gastropods.Biological Bulletin140:284–322DOI 10.2307/1540075.
Seki MP, Lumpkin R, Flament P. 2002.Hawaii cyclonic eddies and blue marlin catches:
the case study of the 1995 Hawaiian International Billfish Tournament.Journal of Oceanography 58:739–745DOI 10.1023/A:1022854609312.
Seki MP, Polovina JJ, Brainard RE, Bidigare RR, Leonard CL, Foley DG. 2001.
Biologi-cal enhancement at cyclonic eddies tracked with GOES thermal imagery in Hawaiian waters.Geophysical Research Letters28:1583–1586DOI 10.1029/2000GL012439.
Sharp GD. 1995.It’s about time: new beginnings and old good ideas in fisheries science.
Fisheries Oceanography 4:324–341DOI 10.1111/j.1365-2419.1995.tb00077.x.
Slocombe DS. 1993.Implementing ecosystem-based management.Bioscience
43(9):612–622DOI 10.2307/1312148.
Sponaugle S, Paris CB, Walter KD, Kourafalou V, D’Alessandro E. 2012.Observed and
modeled larval settlement of a reef fish to the Florida Keys.Marine Ecology Progress Series453:201–212DOI 10.3354/meps09641.
Strathmann RR. 1993.Hypotheses on the Origins of Marine Larvae.Annual Review of
Ecology and Systematics24:89–117DOI 10.1146/annurev.es.24.110193.000513.
Sundelöf A, Jonsson PR. 2012.Larval dispersal and vertical migration behaviour—
a simulation study for short dispersal times.Marine Ecology33:183–193
DOI 10.1111/j.1439-0485.2011.00485.x.
Thorson G. 1950.Reproductive and larval ecology of marine bottom invertebrates.
Biological Reviews25:1–45.
Thresher RE, Brothers EB. 1985.Reproductive ecology and biogeography of
Indo-West pacific angelfishes (Pisces: Pomacanthidae).Evolution39(4):878–887
DOI 10.2307/2408687.
Toonen RJ, Andrews KR, Baums IB, Bird CE, Concepcion GT, Daly-Engel TS, Eble JA, Faucci A, Gaither MR, Iacchei M, Puritz JB, Schultz JK, Skillings DJ, Timmers
MA, Bowen BW. 2011.Defining boundaries for ecosystem-based management: a
multispecies case study of marine connectivity across the Hawaiian Archipelago. Journal of Marine Biology2011:1–13.
Treml EA, Roberts JJ, Chao Y, Halpin PN, Possingham HP, Riginos C. 2012.
Repro-ductive output and duration of the pelagic larval stage determine seascape-wide connectivity of marine populations.Integrative and Comparative Biology52:525–537
DOI 10.1093/icb/ics101.
Vaz AC, Richards KJ, Jia Y, Paris CB. 2013.Mesoscale flow variability and its impact on connectivity for the island of Hawai‘i.Geophysical Research Letters40:332–337
DOI 10.1029/2012GL054519.
Walsh WJ. 1987.Patterns of recruitment and spawning in Hawaiian reef fishes.
Environ-mental Biology of Fishes18:257–276DOI 10.1007/BF00004879.
Warner RR, Swearer SE, Caselle JE. 2000.Larval accumulation and retention:
impli-cations for the design of marine reserves and essential habitat.Bulletin of Marine Science66:821–830.
Watson W, Leis JM. 1974.Ichthyoplankton of kaneohe bay, Hawaii: a one-year study of
fish eggs and larve. Technical Report TR-75-O1. Sea Grant Program, University of Hawaii, Honolulu.
Wessel P, Smith WHF. 1991.Free software helps map and display data.Eos, Transactions
American Geophysical Union72:445–446 DOI 10.1029/90EO00319.
Wetherbee BM, Holland KN, Meyer CG, Lowe CG. 2004.Use of a marine reserve in
Kaneohe Bay, Hawaii by the Giant trevally, Caranx ignobilis.Fisheries Research
67:253–263DOI 10.1016/j.fishres.2003.11.004.
Wood SN. 2011.Fast stable restricted maximum likelihood and marginal likelihood
estimation of semiparametric generalized linear models.Journal of the Royal Statistical Society: Series B (Statistical Methodology)73:3–36
DOI 10.1111/j.1467-9868.2010.00749.x.
Wood S, Paris CB, Ridgwell A, Hendy EJ. 2014.Modelling dispersal and connectivity
of broadcast spawning corals at the global scale.Global Ecology and Biogeography