www.atmos-chem-phys.net/16/9745/2016/ doi:10.5194/acp-16-9745-2016
© Author(s) 2016. CC Attribution 3.0 License.
A model study of the pollution effects of the first 3 months of the
Holuhraun volcanic fissure: comparison with observations
and air pollution effects
Birthe Marie Steensen1, Michael Schulz1, Nicolas Theys2, and Hilde Fagerli1
1Division for climate modelling and air pollution, Norwegian Meteorological Institute, Postbox 43 Blindern, 0313 Oslo,
Norway
2Atmospheric composition, Belgian Institute for Space Aeronomy, Ringlaan-3-Avenue Circulaire, 1180 Brussels, Belgium
Correspondence to:Birthe Marie Steensen (birthems@met.no)
Received: 9 November 2015 – Published in Atmos. Chem. Phys. Discuss.: 25 January 2016 Revised: 13 June 2016 – Accepted: 9 July 2016 – Published: 3 August 2016
Abstract.The volcanic fissure at Holuhraun, Iceland started at the end of August 2014 and continued for 6 months to the end of February 2015, with an extensive lava flow onto the Holuhraun plain. This event was associated with large SO2 emissions, amounting up to approximately 4.5 times
the daily anthropogenic SO2 emitted from the 28 European
Union countries, Norway, Switzerland and Iceland. In this paper we present results from EMEP/MSC-W model simu-lations to which we added 750 kg s−1SO2 emissions at the
Holuhraun plain from September to November (SON), test-ing three different emission heights. The three simulated SO2 concentrations, weighted with the OMI (Ozone
Mon-itoring Instrument) satellite averaging kernel, are found to be within 30 % of the satellite-observed SO2column burden.
Constraining the SO2column burden with the satellite data
while using the kernel along with the three simulated height distributions of SO2, we estimate that the median of the daily
burdens may have been between 13 and 40 kt in the North At-lantic area under investigation. We suggest this to be the un-certainty in the satellite-derived burdens of SO2, mainly due
to the unknown vertical distribution of SO2. Surface
obser-vations in Europe outside Iceland showed concentration in-creases up to > 500 µg m−3SO2from volcanic plumes
pass-ing. Three well identified episodes, where the plume crossed several countries, are compared in detail to surface measure-ments. For all events, the general timing of the observed con-centration peaks compared quite well to the model results. The overall changes to the European SO2budget due to the
volcanic fissure are estimated. Three-monthly wet deposition
(SON) of SOxin the 28 European Union countries, Norway
and Switzerland is found to be more than 30 % higher in the model simulation with Holuhraun emissions compared to a model simulation with no Holuhraun emissions. The largest increases, apart from extreme values on Iceland, are found on the coast of northern Norway, a region with frequent precip-itation during westerly winds. Over a 3-month average (dur-ing SON 2014) over Europe, SO2and PM2.5surface
concen-trations, due to the volcanic emissions, increased by only ten and 6 % respectively. Although the percent increase of PM2.5
concentration is highest over Scandinavia and Scotland, an increase in PM exceedance days is found over Ireland and the already polluted Benelux region (up to 3 additional days), where any small increase in particulate matter concentration leads to an increase in exceedance days.
1 Introduction
at-mosphere (Sigmundsson et al., 2015). Thordarson and Hart-ley (2015) estimated SO2 emissions from the magma at
Holuhraun to range between 30 and 120 kt d−1over the first
3 months of the eruption, with a maximum during the first 2 weeks of September. Schmidt et al. (2015) also found that among several model simulations with different emis-sion fluxes, the model simulations with the largest emisemis-sion (120 ktd−1)compared best with satellite observations at the
beginning of September. In comparison, Kuenen et al. (2014) estimated the daily anthropogenic emission from the 28 Eu-ropean Union countries for 2009 to be 13.9 ktd−1, while
the 2013 estimate is 9.8 ktd−1 (EMEP, 2015). The eruption
ended in February 2015 and during the 6 months of eruption a total of approximately 11 (±5) Tg SO2may have been
re-leased (Gíslason et al., 2015), and the total lava field from the fissure measured 85 km2in area with a lava volume estimated
to amount to 1.4 km3(vedur.is). It is of interest to investigate
the impact of these volcanic emissions on SO2levels in
Eu-rope in 2014. In the last decades, measures have been taken to reduce SO2emissions, triggered by the Convention on
Long-range Transboundary Air Pollution (LRTAP), in Europe. Sig-nificant reductions of 75 % in emission between 1980 and 2010 are confirmed by observations (Tørseth et al., 2012). The impact of volcanic eruptions with SO2 emissions can
thus perturb the European atmospheric sulfur budget to a larger extent than before and potentially lead to new acidi-fication of lakes and soils if the eruption lasts over a long time period.
For comparison, the big 1783 Icelandic Laki eruption lasted 8 months and released a total amount of estimated 120 Tg of SO2. The resulting sulfuric acid caused a haze
ob-served in many countries in the Northern Hemisphere and increased mortality in northern Europe (Grattan et al., 2003; Thordarson and Self, 2003; Schmidt et al., 2011). The fissure at Holuhraun was much weaker than the Laki fissure, both in terms of amount of SO2released and probably also the height
of the eruptive column. Thordarson and Self (1993) esti-mated that the Laki erupted at emission heights up to 15 km, while the observations of the Holuhraun eruptive cloud saw the plume rising up to 5 km (vedur.is). Ground-level concen-trations exceeded the Icelandic hourly average health limit of 350 µgm−3over large parts of Iceland (Gíslason et al., 2015).
The World Health Organization (WHO) has a 10 min limit of 500 µgm−3 and a 24 h limit of 20 µgm−3. High hourly
mean surface concentrations of SO2 were measured in
Ire-land (524.2 µgm−3), then also in Austria (247.0 µgm−3)and
Finland (180 µgm−3)(Schmidt et al., 2015; Ialongo et al.,
2015).
A climate impact of high SO2emissions may be suspected,
such as a cooling of climate due to an increase in aerosol bur-dens. Gettelman et al. (2015), using a global climate model, found a small increase in cloud albedo due to the Holuhraun emissions resulting in a −0.21 Wm−2 difference in
radia-tive flux at the top of the atmosphere. If the event had hap-pened earlier in the summer, a larger radiative effect could be
expected (−7.4 Wm−2). Understanding the atmospheric
sul-fur budget associated to such events is thus of great interest also for climate science. Unlike the two previous big erup-tions in Iceland, Eyjafjallajökull in 2010 and Grímsvötn in 2011, this eruption did not emit significant amounts of ash. However, uncertainties in volcanic source estimates, time-varying emissions from a volcano type of point source and dependence of transport on initial injection height are simi-lar problems for SO2and ash plumes. For eruptions in which
both ash and SO2 are emitted, SO2 can act as a proxy for
ash (Thomas and Prata et al., 2011; Sears et al., 2013), how-ever separation will occur because of density differences and different eruption heights (Moxnes et al., 2014). Proven ca-pability of modelling the transport of a volcanic plume can be useful for judging future eruption scenarios where SO2or
ash can cause a problem.
The Holuhraun eruption is worth being analysed for sev-eral gas and aerosol transport and transformation processes, this study will mainly focus on simulated air quality effects and the perturbed sulfur budget due to the volcanic SO2
emis-sions during the first 3 months of the eruption. Several sta-tions in Europe reported high concentrasta-tions of SO2during
this time and case studies are chosen to evaluate simulated plume development over Europe. The transport is modelled with the EMEP MSC-W chemical transport model, one of the important models used for air quality policy support in Europe over the last 30 years (Simpson et al., 2012). The first 2 months of the eruption are well covered by satellite observations. Both station and satellite data are compared to model results to understand the amplitude and magnitude of the sulfur budget perturbation. The effect of the injection height on the model results is studied by sensitivity simula-tions. Finally the perturbed European sulfur budget is docu-mented and discussed to investigate the impact of increased SO2emission from a Icelandic volcano on European
pollu-tion levels.
2 Methods
2.1 Model description
The model simulations of the transport of the SO2Holuhraun
emissions are created with the 3-D Eulerian chemical trans-port model developed at the Meteorological Synthesizing Centre – West (MSC–W) for the European Monitoring and Evaluation Programme (EMEP). The EMEP MSC-W model is described in Simpson et al. (2012). SO2is oxidized to
The simulations use the EMEP-MACC (Monitoring At-mospheric Composition and Climate) model configuration. The horizontal resolution of the model simulations is 0.25◦
(longitude)×0.125◦ (latitude). There are 20 vertical layers up to about 100 hPa, with the lowest layer around 90 m thick. The model is driven by meteorology from the European Cen-tre of Medium-Range Weather Forecasts (ECMWF) in the MACC model domain (30◦W to 45◦E and 30 to 76◦N).
Iceland is in the upper north-western corner of the domain, which implies losses of sulfur from the regional budget terms in sustained southerly and easterly flow regimes. The me-teorology fields used have been accumulated in the course of running the MACC regional model ensemble forecast of chemical weather over Europe (http://macc-raq-op.meteo. fr), of which the EMEP MSC-W model is a part. For our hindcast-type simulations here, only the fields from the first day of each forecast are used. The meteorology is avail-able with a 3 h interval. All model simulations are run from September through to November 2014.
Emission from the Holuhraun fissure is set to a constant 750 kgs−1SO2(65 ktd−1)for the entire simulation from the
total 2.0±0.6 Tg SO2 emitted in September estimated in
Schmidt et al. (2015). For all model runs the anthropogenic emissions are standard for our EMEP MACC model con-figuration. Table 1 shows an overview of the four different model runs that are used in this study. The column height ob-served both at ground and airborne instruments, varied dur-ing the eruption (Schmidt et al., 2015), the mean height was however around 3 km over the period. For the best guess, base case simulation, called bas_hol, volcanic emissions at Holuhraun are distributed equally from the ground up to a 3 km emission column height. To test the sensitivity towards emission height, two additional model simulations are car-ried out. One simulation in which the volcanic emission is distributed from the ground up to 1 km called low_hol, and a simulation in which the volcanic emission is distributed be-tween 3 km and 5 km called high_hol. To derive the impact purely due to the emissions from Holuhraun, a simulation with no Holuhraun emissions is performed, called no_hol. Sensitivity runs with an almost doubled constant emission rate of 1400 kgs−1, and a time-varying emission term given
in Thordarson and Hartley (2015) were also studied. These resulted in an almost linear increase in concentrations and deposition and did not compare better to observations and will therefore not be presented here. The sensitivity to height of the emission appeared to be more important and is shown here in more detail.
Anthropogenic SO2emissions in the model are described
in Kuenen et al. (2014). There is a yearly total SO2emission
of 13.2 Tg a−1corresponding to 2009 conditions, the same
year that is used in the reference MACC model configura-tion. The difference to actual 2014 conditions is assumed to be unimportant here. The inventory includes 2.34 Tga−1SO2
in yearly ship emissions over the oceans. Over the continents the yearly emissions are 5.08 Tga−1SO2for the 28 EU
coun-tries and 5.53 Tga−1 SO2 for the non-EU countries in the
MACC domain (including Iceland) covered by the MACC domain.
2.2 Observations
The satellite data used in this study stem from the Ozone Monitoring Instrument (OMI) aboard NASA AURA (Lev-elt et al., 2006). The satellite was launched in July 2004 as part of the A-train earth-observing satellite configuration and follows a sun-synchronous polar orbit. The OMI mea-sures backscattered sunlight from the Earth’s atmosphere with a spectrometer covering UV and visible wavelength ranges. Measurements are therefore only available during the daytime. The background SO2 concentrations are often
too low to be observable, but increases in SO2 from
vol-canic eruptions can produce easily distinguishable absorp-tion effects (Brenot et al., 2014). Pixel size varies between 13 km×24 km at nadir and 13 km×128 km at the edge of the swath. OMI satellite data are affected by “row anomalies” due to a blockage affecting the nadir viewing part of the sen-sor, which affects particular viewing angles and reduces the data coverage. The zoom-mode of OMI reduces the coverage on some days. The coverage is also reduced by missing day-light, e.g. winter observations from high latitudes are absent. Therefore data from only the first 2 months from September until the end of October are used in this study.
The retrievals are described in Theys et al. (2015). The sensitivity of backscatter radiation to SO2molecules varies
with altitude (generally decreasing towards the ground level), therefore the algorithms use an assumed height distribution for estimating the integrated SO2column density. Since
of-ten little information is available at the time of eruption and the retrievals produce results daily (even for days with no eruption), an assumed a priori profile is used for the vertical SO2distribution. The satellite retrievals used here assume an
a priori profile with a plume thickness of 1 km that is centred at 7 km, similar to the method described in Yang et al. (2007). As found in Schmidt et al. (2015), this is too high for the Bárðarbunga eruption. Therefore, the retrieved SO2column
densities may be too low. To compare the vertical column density (VCD) from the model to the one from satellite re-trievals, the averaging kernel from the satellite has to be used. Each element of an averaging kernel vector defines the rela-tive weight of the true partial column value in a given layer to the retrieved vertical column (Rodgers, 2000). Cloud cover also changes the averaging kernel and a spatio-temporally changing kernel is part of the satellite data product (an aver-aging kernel is provided for each satellite pixel).
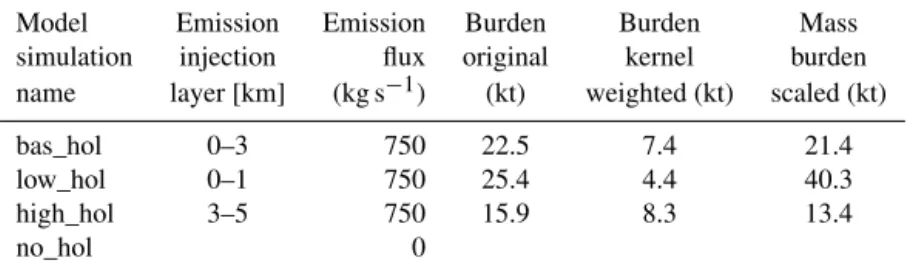
Table 1.Overview of model runs and the Holuhraun SO2emission height assumptions and flux; given are also medians of daily mass burdens
of SO2for September to October 2014 in the North Atlantic as described along with Figs. 2 and 3.; last column contains scaled mass burdens, assuming 7.0 kt of SO2burden derived from satellite data (see text in discussion).
Model Emission Emission Burden Burden Mass
simulation injection flux original kernel burden name layer [km] (kg s−1) (kt) weighted (kt) scaled (kt)
bas_hol 0–3 750 22.5 7.4 21.4
low_hol 0–1 750 25.4 4.4 40.3
high_hol 3–5 750 15.9 8.3 13.4
no_hol 0
Fig. 1). The Aura satellite makes five overpasses over the do-main during the daytime and swaths are partly overlapping in the northern regions. For the grid cells where the swaths over-lap, the satellite observations are averaged to produce daily average fields. There are also regions that are not covered by satellite observation that will not be taken into account in the model data post processing. To make comparable daily averages of the model data, the closest hour in the hourly model output are matched to the satellite swath time and only grid points that are covered by satellite are used. The profiles for the averaging kernel in the satellite product are given on 60 levels and the values from these levels are interpolated to model vertical levels. The newly adjusted model VCD is then calculated by multiplying the interpolated averaging kernel weights to the SO2concentration in each model layer,
inte-grating all layers with the height of each model layer. Because of noise in the satellite data small retrieved VCD values are highly uncertain. A threshold limit is sought to identify those regions that have a significant amount of SO2.
Standard deviation for the satellite data is calculated over an apparently SO2free North Atlantic region (size 10×15◦lat lon respectively) and is found to be around 0.13 DU. Effects of varying cloud cover are ignored. An instrument detection limit is 3 times the standard deviation of a blank, so we as-sume that with a threshold value set to 0.4 DU we exclude satellite data below the detection limit. Any grid point with a value above this threshold in the satellite data is used along with the corresponding model data. Daily mass burdens for the North Atlantic region are calculated by summing up all SO2VCD in the grid cells above the threshold. Finally we
convert Dobson units to mass burdens here and there in the paper to facilitate comparison to models and mass budgets. One Dobson unit is 2.69×10²⁰ molecules per square me-tre, which corresponds to a column burden of 28.62 mil-ligrams SO2per square metre (mgm−2).
Data of SO2 and PM2.5 surface concentrations are
col-lected by the European Environment Agency (EEA) through the European Environment Information and Observation Network (EIONET). We make use of two preliminary sub-sets of this data, one obtained from work within the MACC project to produce regular air quality forecasts and reanalysis
(only SO2)and a second one obtained from EEA, a so called
up-to-date (UTD) air quality database, state spring 2016. The two different subsets cover observation data from different countries, and have not been finally quality assured at the time of writing this paper. We use only station data, which contain hourly data. However, there are missing data and some stations have instruments with high detection limits, making it difficult to create a continuous measurement series with good statistics. Therefore, in this study only some out-standing episodes with high concentrations of SO2and
docu-mented transnational transport of a volcanic plume are anal-ysed. For the first 6-day period between 20 and 26 Septem-ber 2014, high concentrations of SO2 were measured over
Great Britain and countries further to the south. For the sec-ond 6-day period, a month later (20 to 26 October), the plume was also detected over Great Britain, but was transported fur-ther east towards Germany. For the last plume studied, lasting from 29 October to 4 November, the volcanic emission was transported eastward to the coast of Norway and countries to the south. Recent daily deposition data are taken from the EBAS database (ebas.nilu.no) for those stations for which the data are already available. Model data to represent the station values are picked from hourly data at model surface level in the grid cell where the station is located.
3 Results
3.1 Comparison to satellite data
Observations by satellite provide information about SO2
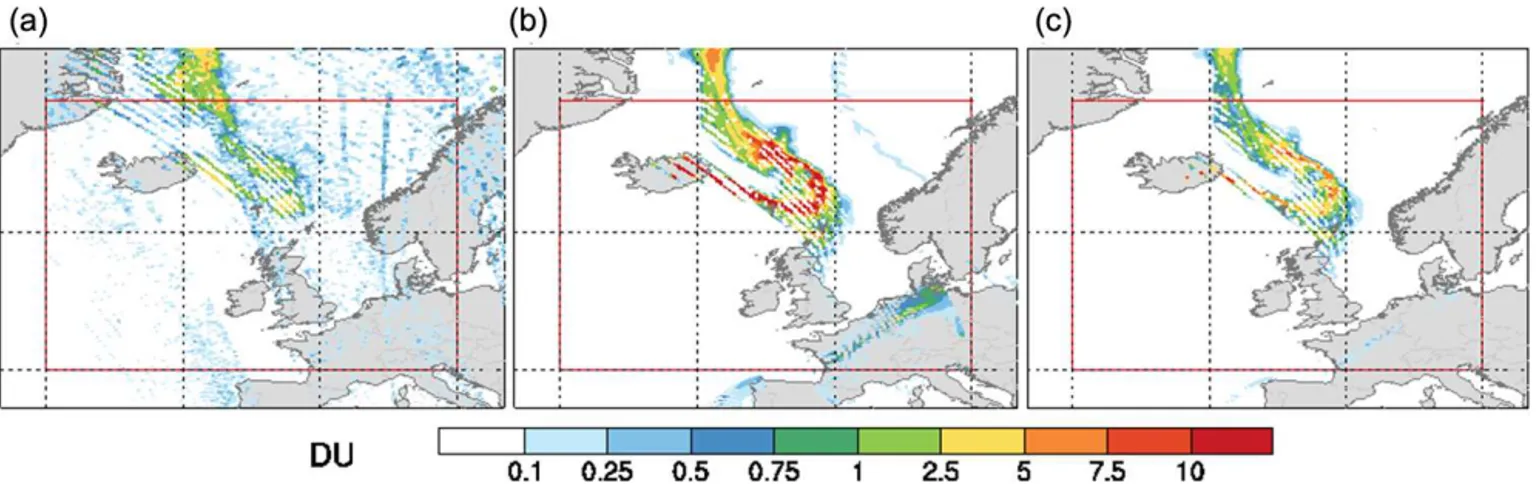
lo-cation and column density. Figure 1a shows as an example the VCD from the OMI satellite overpasses on 24 September 2014. Figure 1b and c show the modelled and the kernel-weighted VCD from the base simulation (bas_hol). The ob-served satellite SO2 cloud and the model-simulated SO2
cloud show similar shape and location. The kernel-weighted model column densities are smaller than the original model VCDs. More weight is given by the averaging kernel to model layers higher up, close to the reference height of 7 km, where there is less SO2in our case, with emissions and
re-Figure 1.SO2column density:(a)for the satellite swaths on 24 September 2014;(b)for corresponding, consistently colocated original model data in the base simulation bas_hol;(c)for these model data with the satellite averaging kernel applied. The red box indicates the area where the statistics of satellite and model data in Figs. 2 and 3 are acquired.
duced kernel-weighted column densities are closer to the col-umn densities observed by the satellite. There are, however, some spatial differences regarding where the maximum col-umn densities are located.
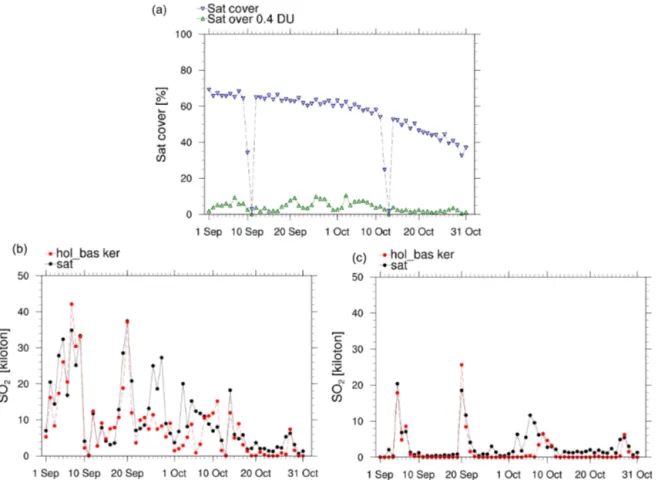
A quantitative comparison is attempted here by integrat-ing all satellite – and correspondintegrat-ing model data – above the North Atlantic, between Iceland and Europe, into daily mean column burdens. Figure 2 shows the time series from September to October of daily satellite coverage and daily mass burdens considered over the area where satellite VCD values exceed the 0.4 DU detection limit as explained above. The area covered by valid satellite observations at the be-ginning of the period is around 70 % of the domain used here (red boxes in Fig. 1). Towards the end of the period, the satel-lite coverage is only around 40 % because of the increasing solar zenith angle (a satellite zenith angle cut-off of 75◦ is
used for the satellite data). On some days, the satellite cover is even lower because of the OMI zoom mode. The percent-age of the satellite data that is above the detection limit is low over the entire 2-month period, only reaching around 10 % at the end of September and beginning of October.
On most days, the satellite daily mass burden is above the model value, ignoring the days when the OMI zoom mode is responsible for a small coverage. The average satellite-derived SO2mass burden assuming a 7 km reference
height is 11.2 kt, while the kernel-weighted model burden in bas_hol is 8.7 kt SO2. The highest values are found at the
be-ginning of the period, 42.1 kt SO2 on 7 September, for the
model, and 37.4 kt SO2, on 20 September for the satellite.
Taking into account the area in which the satellite-observed SO2is found above detection limit, the satellite average
col-umn loadings are calculated to reach 70 mgm−2for
Septem-ber. Furthermore, the peaks in the middle of October, visi-ble in Fig 2b, exhibit a satellite average column loading of 62 mgm−2.
The daily values of SO2mass burden are decreasing over
time, especially during October. There is also a positive bias of the model against the satellite at the end of October. At the same time the satellite coverage is decreasing along with an increasing solar zenith angle. To further investigate whether this is responsible for the general decrease in mass burdens and the increasing bias of the simulated vs. observed VCDs, a new aggregation domain further south is used. All the areas where satellite observations may be possible up to the end of October (61.25◦N) are used to calculate another set of daily
column burdens for satellite and model data (see Fig. 2c). Satellite coverage in this southerly domain is not decreasing over time, but it is also not covering Iceland, so the SO2from
Holuhraun first needs to be transported south before it can be detected. The plume is transported that far south 4 times over the 2-month period as the peaks in column burden val-ues in Fig. 2c show. In this southerly area the daily accumu-lated mass burdens are similar in September and in October, supporting the hypothesis that the apparent decrease in mass burden in Fig. 2b is due to reduced satellite coverage.
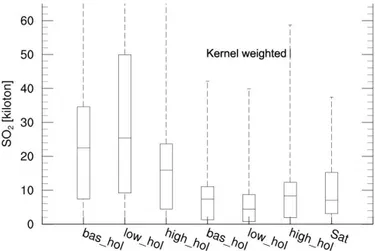
Percentile values from the distribution of the daily mass burden in September and October 2014 from all three model simulations, original and kernel weighted, are shown in Fig. 3. Note that the mass burdens are accumulated in the same area in the North Atlantic, where at least 0.4 DU SO2
was observed by OMI. Looking at the original model data, the model simulation with emissions in the lowest kilome-tre (low_hol) has the highest daily mass burden values (me-dian: 25.4 kt), followed by the best-guess simulation, bas_hol (median: 22.5 kt), while the run with the emission highest in the atmosphere (high_hol) exhibits the smallest mass burden (median: 15.9 kt). The higher values in the low_hol simu-lation can be explained by less wind and dispersion at low altitudes and thus a more concentrated SO2cloud than in the
Figure 2. (a)Time series of the daily reference area covered by valid satellite observations (blue triangles) in percent of the total area of the domain used for the statistics (30◦W to 15◦E and 45–70◦N, see Fig. 1). Green triangles show the reference area in percent where
satellite-derived SO2VCD is above 0.4 DU;(b)Time series of accumulated daily SO2mass burdens in reference area from satellite data (“sat”, black dots) and from model base run with averaging kernel applied (“hol_bas ker”, red dots;(c)Shows the same as(b)but over a smaller area just south of 61.15◦N.
The kernel-weighted model data represent what can be di-rectly compared to the satellite data. As shown in Fig. 3, and illustrated already in Fig. 1, the kernel-weighted model col-umn burden values are much smaller than the original ones, because the SO2plume was simulated to be far below 7 km
altitude. The impact of the kernel weighting is quite different for the three model simulations. After the averaging kernel has been applied to the model data, the high_hol model sim-ulation exhibits the highest daily burdens compared to the other two model simulations. The median for the bas_hol, low_hol and high_hol daily mass burden are 7.4, 4.4 and 8.4 kt respectively, while the satellite mass burden median value is 7.0 kt. High burdens retrieved from satellite data, and high kernel-weighted model burdens reflect that volcanic SO2is present at high concentrations and/or at high altitudes.
Analysis of the distribution of daily mass burdens allows for investigating how many days with very high burdens were present. Comparing the satellite data to the kernel-weighted model data, we find that the satellite’s 75th percentile is larger than any of the model simulation’s 75th percentiles. The satellite data contain some high daily burden values that
result in a higher average burden and a higher 75th percentile. From testing different emission heights in our three-model simulations, the best-guess bas_run has the most similar dis-tribution of daily burdens compared to the satellite data over the first 2 months.
3.2 Surface concentrations
SO2from the volcanic eruption on Holuhraun was measured
at several surface stations during the period. Three differ-ent episodes with clear peaks in observed concdiffer-entrations at stations around Europe are described in the following para-graphs. Exemplary comparisons are shown and additional comparisons at other stations are available in the Supple-ment.
A particular episode with very high surface concentra-tions of up to 500 µgm−3SO
2in Ireland at the beginning of
in-Figure 3.Distribution of daily SO2mass burden values in the area where satellite-derived SO2 exceeds 0.4 DU (# 61; values from
Fig. 2) as box-and-whisker plots; shown for the model simulations are original data (3 left boxes) and kernel-weighted data (3 follow-ing boxes) and the satellite data. The boxes shown represent the 25th percentile, the median, and the 75th percentile values, lower whiskers the minimum value and upper whiskers the maximum value.
deed might have been too small in the first days of September 2014.
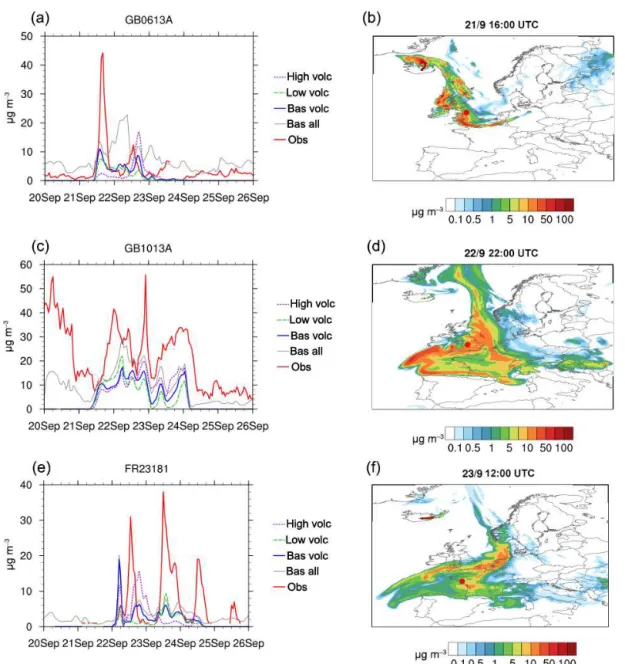
Figure 4 shows the hourly time series for two stations over Great Britain and France from 20 September to 26 Septem-ber. A maximum concentration of 44.3 µgm−3SO2was
mea-sured on 21 September 16 UTC at a station situated in Manchester (53.48◦N and 2.24◦W) near the west coast of
Britain. None of the three model simulations reach the ob-served maximum values. However, the simulated concentra-tion field shows areas south of the staconcentra-tion near Manchester, where the volcanic SO2concentrations are around 50 µgm−3.
Interestingly, the agreement of the model-derived volcanic SO2 time series is better in agreement with measurements
than the total simulated SO2concentration (grey curve),
in-dicating that the model may not resolve SO2transport from
nearby pollution sources and that the station for these days is rather representative of long-range transported volcanic SO2. Observed PM2.5concentrations at the station show that,
over the period, the highest concentration (52.1 µgm−3)–
probably anthropogenic – is measured at the start of the pe-riod, when the model did not simulate any volcanic sulfur contribution. The next day, the plume moved further south over France. The station is situated on the west coast of France in Saint-Nazaire (47.25◦N and 2.22◦W). The
mea-surements show three peaks over 3 days, with the highest one (38 µgm−3)measured on the 23 September at 12:00 UTC.
All three model simulations have peak concentrations which are earlier than the observed ones, and the concentrations from the model are lower than observed. The three simula-tions do, however, show increased concentrasimula-tions at the site due to the volcanic eruption over the 3 days. The map shows
that large parts of France had an increase in SO2surface
con-centrations during this time.
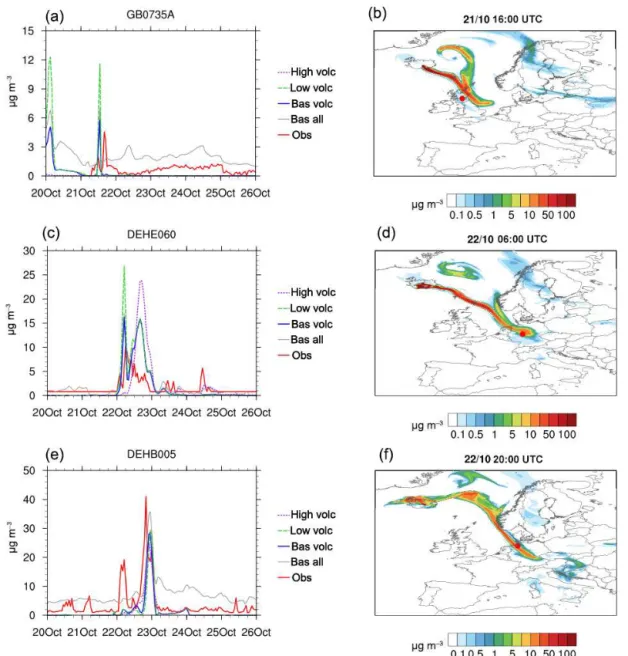
Figure 5 shows the time series for three stations over Scot-land and Germany a month later, from 20 to 26 October. The high_hol simulation shows low concentrations over the Scot-tish Grangemouth station (56.01◦N and 3.70◦W), but the
bas_hol and low_hol have a plume with high concentrations over the station on 20 October. There are no measurements at this time with which to compare the model values. The tim-ing of the second plume on 21 October for the two models is a few hours early and the modelled concentrations higher than observed (6.09 µgm−3), especially in the low_hol simulation.
The map shows a narrow plume from Iceland southwards to Scotland and the station lies on the edge of this plume. On 22 October, the volcanic SO2is measured at stations in
Germany. Figure 5d shows the plume reaching from Iceland into the North Sea, transported east and south compared to the situation from the day before. The two stations Keller-wald (51.15◦N and 9.03◦E) and Bremerhaven (53.56◦N and
8.57◦E) experience the plume differently. While for
Bremer-haven the observed peak (41.0 µgm−3)is short in duration,
the peak lasts for 1 day at Kellerwald with an observed max-imum of 10.2 µgm−3. The map shows that the plume is
nar-row for all three stations and the local spatial gradient is large.
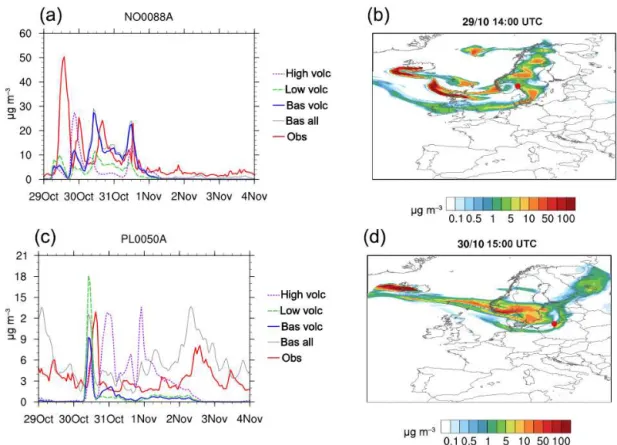
A third plume is illustrated in Fig. 6 over northern Eu-rope, occurring from the end of October to the beginning of November. Figure 6a shows the measured SO2
concentra-tions at a station in Oslo, Norway (59.92◦N and 10.76◦E).
There are four peaks measured from 29 to 31 October, with the highest one on 29 October (50.4 µgm−3). The models
runs show a contribution from Holuhraun SO2over the same
3 days, but do not reach the high measured concentrations and the first plume is especially underestimated. On Octo-ber 30, the plume is transported south-east to Poland. The Polish station in Sopot (54.43◦N and 18.58◦E) experiences
a short peak indicating that the model simulation happens a few hours earlier. The bas_hol simulation exhibits the most similar concentration evolution among the three model ex-periments.
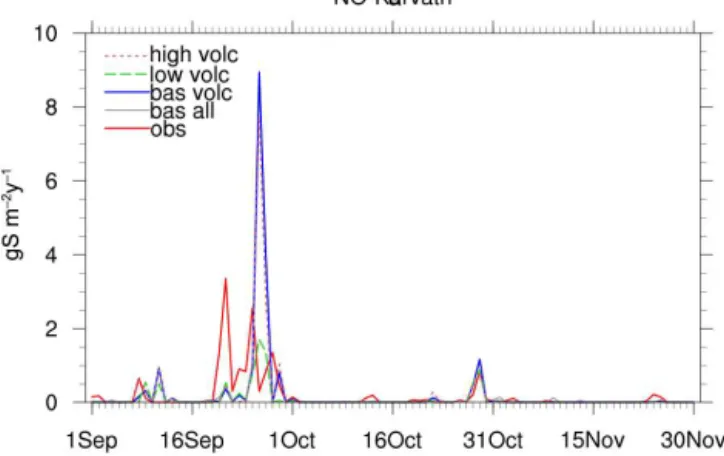
Figure 7 shows wet deposition for the whole 3-month pe-riod at the Kårvatn station (62.78◦N and 8.88◦E) in Norway.
There are high levels, both observed and modelled during the last part of September. The model exhibits a clear peak value on 27 September, while the observations record depo-sition spread out over several days. Summed over the whole period, the observed deposition amounts to 15.9 gSm−2yr−1
while the model simulated 20.0 gSm−2yr−1. Comparisons at
other stations in Norway show similar results (Supplement).
3.3 Effects of the eruption on European pollution The above results show that, despite the Holuhraun erup-tion releasing large amounts of SO2, the stations in Europe
Figure 4.Left panels: time series of surface concentrations from 20 to 26 September 2014 for two stations, GB0613A, Manchester, SO2
(top), PM2.5(middle) and FR23181, Saint-Nazaire, SO2(bottom). The red line shows the measured surface concentrations, the grey line represents the modelled surface concentration in bas_hol (“bas all”). By subtracting from the modelled surface concentrations in the three model runs (bas_hol, low_hol and high_hol) the no_hol simulation values, the concentration due to volcanic eruption is calculated and shown in the blue, green and pink lines respectively. Right panels: corresponding map of simulated surface concentration due to the volcanic eruption from bas_hol, corresponding to the blue line in the left panels, for the time of the maximum observed concentration. The red dot on the map marks the position of the station.
short peaks (Gíslason et al., 2015; Schmidt et al., 2015). The model makes it possible to investigate the general impact on European air quality by Holuhraun volcanic emissions. Ta-ble 2 summarizes characteristic SOx budget terms and
sur-face concentrations for the European continental land area in the countries mentioned in Table 2. Concentration and depo-sition over the oceans are not included. To isolate the effect of the Holuhraun eruption on Iceland itself, the deposition and concentrations over Iceland are given in brackets.
The table shows that the Holuhraun emission flux in the study period corresponds to over 4.5 times the anthropogenic emission from the 31 European countries considered here (not including ship emissions). The anthropogenic emissions from Iceland are only 18 kt, while the SO2emissions from
Iceland increase by more than 300 times.
Over the 3 months, there is 1.32 times more SOxwet
depen-Figure 5.The same as Fig. 4, but from 20 to 26 October 2014 for three different stations GB0735A Grangemouth in Scotland, DEHE060 Kellerwald and DEHB005 Bremerhaven in Germany, all SO2.
dent on the emission height. The simulation with the emis-sion highest in the atmosphere (high_hol) exhibits the high-est wet deposition in Europe. For dry deposition, a 10 % in-crease over Europe is found for all three model simulations with Holuhraun emissions. Close to the source, over Iceland, the deposition levels are very dependent on emission height, with dry deposition ranging from 8 to 409 kt.
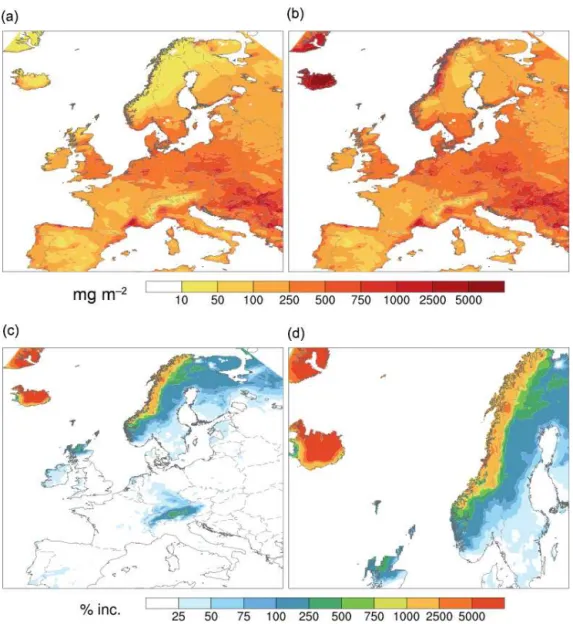
Figure 8 shows the total deposition over Europe for the standard MACC model simulation with no Holuhraun emis-sion (no_hol), the base model simulation (bas_hol) and the percent increase between these two model runs. Areas that experience the highest percent increase are also areas that have low levels in the model simulation with no emission at Holuhraun. Due to the Holuhraun emissions, Iceland has the
highest SOx deposition in Europe, and the coast of
north-ern Norway shows depositions on the same level as the more polluted eastern Europe. Even though the previous section indicated that the model has higher wet deposition levels in northern Norway than observed, it also showed that it is very likely that the observed increases in SOx deposition levels
are due to the Holuhraun emissions.
The averaged SO2 surface concentration over Europe is
arriv-Figure 6.The same as Fig. 4 but from 29 October to 4 November 2014 for NO0088A Oslo, Norway and PL0050A in Sopot Poland, both SO2.
Table 2.Emissions, depositions and concentrations for the 28 European Union member states, Norway and Switzerland for the 3 months September, October, November 2014; emissions and depositions are totalled over the 3 month period, concentrations are the mean over the period for the 31 countries. Numbers in brackets are the contribution from Iceland, for emission and deposition. For concentrations, the number represents the average over Iceland. See simulation names and set-up in Table 1.
Simulations: no_hol bas_hol low_hol high_hol bas_hol/no_hol
Emissions SO2 1257 1257 1257 1257 1
(kt) (18) (5980) (5980) (5980) (5.68)
SOxWet deposition 1043 1382 1285 1465 1.32
(kt) (11) (1122) (1491) (472) (2.37)
SOxDry deposition 481 529 524 526 1.10
(kilotons) (4) (151) (409) (8) (1.40)
Mean SO2surface conc. 1.39 1.58 1.56 1.56 1.13 (µg m−3) (0.59) (38.95) (105.91) (1.81) (66.17)
Mean PM2.5surface conc. 5.86 6.20 6.09 6.28 1.06
(µg m−3) (0.82) (2.50) (3.13) (1.12) (3.06)
ing at different times. Vertical mixing, on average, levels off initial differences in emission height for volcanic plumes ar-riving in Europe.
The small increases in PM2.5concentrations over Europe,
as shown in Table 2, are due to increased sulfate produc-tion from volcanic SO2. However, PM2.5 is a collection of
all aerosols under 2.5 µm, and the volcanic sulfate is chang-ing total aerosol mass therefore relatively little. The table shows that Iceland has a lower average concentration than
the rest of Europe for all four runs, even though Iceland is the source for the increase in aerosol pollution levels. The high_hol model simulation has a higher increase in PM2.5
concentration over Europe than the two other simulations. By contrast, the low_hol simulation finds the highest sulfate and SOx deposition on Iceland itself, and possibly over the
Figure 7.The same as Fig. 4, but September–November 2014 daily time series of SOxtotal deposition at the Kårvatn station in Norway.
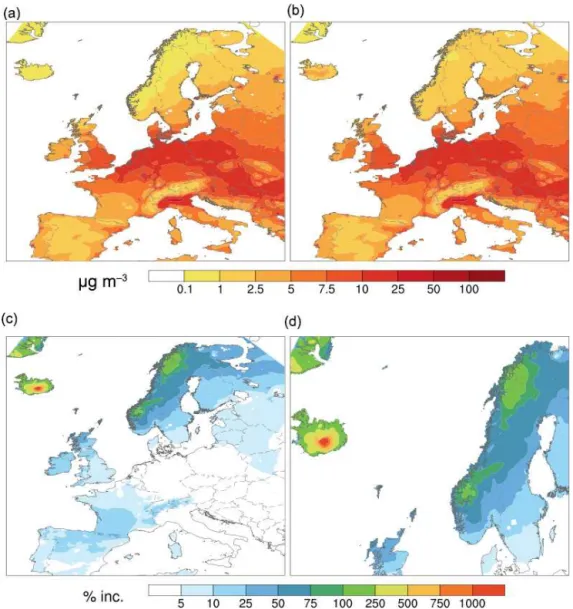
The distribution of PM2.5 from the no_hol and bas_hol
simulation, plotted in Fig. 9, shows the same polluted and clean areas as in Fig. 8, although the increase is lower. Over north-western Norway and northern Norway, the increase is over 100 %. Figure 9b shows that although the percentage increase is high, the PM2.5concentrations in these areas are
still among the least polluted in Europe. The high deposition levels in this region indicate that some of the PM2.5is
scav-enged out.
WHO recommends a 24 h average mean concentration level of 25 µgm−3for PM2.5not to be exceeded over 3 days in
a year (WHO, 2005). Figure 10a shows that over the Benelux region, northern Germany and northern Italy this limit value is exceeded by up to 10 days during the 3 months studied. As the previous plot showed, these are regions with high average PM2.5concentrations. Because the daily concentrations are
already high, any increase in days in the model bas_hol sim-ulation due to the Holuhraun emissions is also occurring in these regions, and the areas with the highest percent increase do not experience any days over the limit. The figure also shows that Northern Ireland experienced up to 2 exceedance days due to the volcanic eruption.
4 Discussion
The bias and variances between the model data and the satel-lite observations can be due to several factors. (a) The model emission flux may be under- or overestimated compared to the real emissions, model VCDs are therefore too low/too large compared to the observed ones. (b) The areas for which the column mass burdens have been computed depend on the VCD detection limit and the actual satellite data, so the re-trieved model burdens depend on the position of the identi-fied and observed SO2 cloud. If a simulated plume is
dis-placed into an area where the satellite does not show any valid signal or no signal above detection limit, then this part of the model plume is ignored and may lead to
underesti-mates by the model. (c) The presence of clouds can increase the uncertainty of the satellite retrieval. (d) The fluctuating real height of the SO2plume may introduce additional bias
between model and satellite VCDs. Schmidt et al. (2015) pre-sented IASI (Infrared Atmospheric Sounding Interferometer) plume heights for the Bárðarbunga SO2plume between 5.5
and 1.6 km derived from an area of 500 km around the vol-canic location, and a mean IASI centre of mass height be-tween 2.7 and 0.6 km.
Schmidt et al. (2015) presented a comparison between model, satellite and ground observations for September. Mass burdens from OMI were derived using observed plume heights from the IASI instrument on the MetOp satellite. Both satellite data sets were compared with the model NAME (Numerical Atmospheric-dispersion Modelling En-vironment), a Lagrangian model, which was run for Septem-ber, with sensitivity runs testing both emission height and emission flux. The model simulation with a plume height of 3 km and doubled emission flux (∼1400 kgs−1)matched
well with the OMI satellite data for the first days, while for the rest of September another simulation matched better, when emissions were similar to the constant emission term used in our study (∼700 kgs−1). Their study and ours show
that for the first days and at the end of September, the satel-lite data exhibit higher values than a model using an emission rate of 700–750 kgs−1SO2. Our Holuhraun emission term in
the three model simulations is constant throughout the sim-ulations both with respect to the respective three emission heights and emission flux (see Table 1). Maximum fluxes of 1300 kgs−1were reported by Barsotti (2014). Gíslason et
al. (2015) estimated a 2.5 times above-average emission term during the first 2.5 weeks of the eruption. Our assumption of a constant emission term is thus certainly a simplification.
However, here we suggest that overall understanding of the height of the plume is as important to achieve model agreement with the satellite data as emission intensity vari-ations. The emission height is also variable, dependent on initial volcanic eruption characteristics and meteorological conditions like wind speed and stratification (Oberhuber et al., 1998). Table 1 contains the original mass burdens and the kernel-weighted mass burdens as described in Sect. 3.1. It also contains a scaled burden estimate, assuming that each of the three simulations should be corrected for bias against the satellite-derived burden. This scaling assumes that in each model simulation the height distribution may be correct. The resulting mass burdens from the three simulations differ by 60 %, computed as standard deviation. This may be seen as an uncertainty estimate associated with our limited knowl-edge of the real height of emission and dispersion of the SO2
plume from Bárðarbunga.
Figure 8. (a)Simulated total deposition of SOx(wet and dry) over Europe from September to November 2014 for no_hol and(b)bas_hol
simulations;(c)percent increase in SOxdeposition due to the Holuhraun emissions;(d)shows the same as(c)but zoomed into Norway and
northern Europe.
Surface concentration comparisons presented in this study and in the Supplement show that the volcanic SO2was
ob-served as short singular peaks lasting a few hours or as a sequence of several peaks spread over a few days. Three episodes are picked where transnational transport is docu-mented. The biggest difference between simulated and mea-sured concentrations is found for the first of the three stud-ied plumes during 20 to 26 September in Manchester (sta-tion GB0613A), Great Britain and Saint-Naizaire (sta(sta-tion FR23181), France, with up to a factor of four differences. Both the measured and simulated concentrations during the September event were higher than the two later events, point-ing to a more efficient transport of SO2in this event. Higher
emission fluxes up to a factor of 2 are supported by the satel-lite comparison on some of the days at the end of September. Changes in emission flux for the EMEP/MSC-W have been
shown to have an almost linear change in concentrations (not shown here); even with doubled emissions during this event the model would still simulate surface concentrations well below those observed. Station data comparisons presented in Schmidt et al. (2015) for these days are similar, indicating that models have difficulties representing this period.
The discrepancies found between the model and observa-tions suggest that the volcanic SOxbudget terms and average
Figure 9.Shows the same as Fig. 8, but for average PM2.5concentration over the 3 months.
needed to better estimate the increase in SO2concentrations
due to the eruption at the stations in the 2014 volcanic erup-tion episode.
Transport from an Icelandic volcano to Europe is caused by northerly and north-westerly winds. For the first plume, from 20 to 26 September, when the model shows low con-centrations compared to the observations, there had been southerly winds for some time before strong northerly winds transported the SO2cloud southward over Great Britain and
France. Compared to the other two episodes, the SO2surface
concentration due to Holuhraun are higher over a larger area during this episode. The difficulty of the model in simulating the SO2transport correctly is connected to the uncertainty in
the emission term, the meteorology fields, the chemical reac-tions and deposition. Overall the comparison to observareac-tions shows, that our best-guess bas_hol model simulation matches best with the observed satellite column burdens, their time
evolution and for some stations with the magnitude and tim-ing of the observed surface concentration peaks.
The results in this study show that the sulfur deposition from September to November over northern Norway was at the same level as found in the most polluted regions in Europe. The emission ceiling’s aim, set by the Gothen-burg Protocol, was to reduce the SOx emissions by 63 %
in-Figure 10. (a)Number of days with exceedances of PM2.5in the period September through to November 2014, for the bas_hol model
simulation.(b)The increase in days of PM2.5exceedance from no_hol to bas_hol simulation, attributable to volcanic emissions.
creases are due to the Holuhraun volcanic eruption. North-ern Norway is more susceptible for volcanic impact because of its geographical position, in addition to high frequency of precipitation on the western coast of Norway. Comparing the mean deposition levels over the 3 months in 2014 over Norway to model simulations with emissions from previous years, they are double those from the early 1990s (EMEP, 2015). Southern Norway experienced a sulfur deposition de-crease of 40 % from 1980 to 1995 due to emission abatement in Europe (Berge et al., 1999). The highest contributors to high deposition levels over southern Norway were the UK and Germany (18 and 15 % respectively). Norway also ex-perienced a high percent increase in PM2.5 concentrations
in 2014. The PM2.5levels over Scandinavia are low, and a
small increase in the concentrations leads to high percent in-creases. The increase over land shows a similar pattern as the results found in Schmidt et al. (2011) for a hypotheti-cal Laki eruption. Even though the highest increase is over Scandinavia and Scotland, the concentrations are too low to exceed the 25 µg m−2limit. Already polluted regions like the
Benelux region experience more days with exceedances as well as Northern Ireland.
5 Conclusions
The increase in emitted SO2 to the atmosphere caused by
the volcanic eruption at Holuhraun was observed by satel-lite and detected at several stations over Europe (Schmidt et al., 2015; Gíslason et al., 2015). Model simulations with the
EMEP MSC-W model with emissions from Holuhraun over the period from September to November 2014 have been car-ried out to investigate the model capability to simulate such events, and also to study the impact of the increased emis-sions on concentrations and depositions over Europe.
The first 2 months of the model simulations are compared to satellite retrievals from OMI. The retrievals use an as-sumed plume height of 7 km. Averaging kernels from the satellite data are applied on the model data to compare the model data to the satellite. Because of the weighting, the satellite retrieved mass burden values are dependent on both vertical placement and amount of SO2. Two sensitivity model
simulations with different Holuhraun emission heights are compared to the satellite data together with the best-guess base simulation. After the kernel is applied, the results are more comparable to the satellite data. Constraining the SO2
column burden with the satellite data while using the kernel along with the three simulated height distributions of SO2,
we estimate that the median of the daily burdens may have been between 13 and 40 kt in the North Atlantic area under investigation.
a special transport pattern of SO2during the first event,
ob-served concentrations are higher here than during the later events, and the difference between models and observations is largest. PM2.5concentration during this first event is
com-parable to observations. Uncertainties in the model simu-lations increase by the length of transport, and some near misses of the narrow plumes can clearly explain differences between models and observation. To make a better assess-ment of model performance during the whole volcanic erup-tion, better quality checked station data are needed. Com-parison between the model and wet deposition observations over Norway show significant and high contributions from the eruption, although the model overpredicts values at the stations studied and other stations to be found in the Supple-ment.
Studying the changes in pollution levels over Europe, in-creased SOx wet deposition is most noticeable. In the
3-month base simulation there is 32 % more sulfate wet depo-sition found than in the model simulation with no Holuhraun emission, accounted for over the 28 European Union coun-tries, Norway and Switzerland. The regions that have the highest increase, apart from Iceland, are northern Scandi-navia and Scotland, regions that are among the least polluted in Europe. In particular, the coast of northern Norway, with a percent increase in total deposition of over 1000 %, shows levels equal to the most polluted regions in Europe Seen against the long-term record of observed levels of deposition since 1980 at the Tustervatn station in central Norway, the 2014 deposition values stand out and are only exceeded dur-ing the Grimsvötn eruption in 2011. We also find that high SOx wet deposition values measured at the Kårvatn station
in 2014 on the coast of western Norway are very likely due to the Holuhraun emissions.
The difference in SO2 concentrations over Europe
be-tween the no_hol and model simulations with Holuhraun emission is around 13 % and increases occur as short peaks in concentration levels from a few hours to some days. Due to the underestimation seen at stations during September, the uncertainty of this number is large and the simulated volcanic contribution is possibly too small. For PM2.5concentration,
the volcanic increase is 6 %, and the model shows better agreement with station observations. The biggest difference in percent increase is seen over Scandinavia and Scotland, however these regions are among the cleanest in Europe, also with the added sulfur caused by the Holuhraun emissions. The areas that show an increase in number of days with over 25 µgm−2 PM2.5 concentrations are those that are already
polluted. Even with high emissions from the volcanic fissure at Holuhraun, the increase in pollution levels over Europe was relatively small, with only transient episodes associated with high increases in SO2concentration.
The Supplement related to this article is available online at doi:10.5194/acp-16-9745-2016-supplement.
Acknowledgements. Most of the work done for this paper is funded by the Norwegian ash project financed by the Norwegian Ministry of Transport and Communications and AVINOR. Model and support is also appreciated through the Cooperative Programme for Monitoring and Evaluation of the Long-range Transmission of Air Pollutants in Europe (No: ECE/ENV/2001/003). The observations are made available through the EEA UTD database (http://www.eionet.europa.eu/aqportal) and the MACC project (MACC III project number 633080) obtained with the much appreciated help of Álvaro Valdebenito. Wenche Aas and Paul Eckhardt are thanked for provision of recent measurements of wet deposition measurements in northern Norway, included in the EBAS database. This work has also received support from the Research Council of Norway (Programme for Supercomputing) through CPU time granted at the super computers at NTNU in Trondheim.
Edited by: Y. Balkanski
Reviewed by: two anonymous referees
References
Barsotti, S.: 100 Days of Gas Release at Holuhraun, Vedur.is, http:// en.vedur.is/pollution-and-radiation/volcanic-gas/measurements/ (last access: 26 March 2015), 2014.
Berge, E., Bartnicki, J., Olendrzynski, K., and Tsyro, S.: Long-term trends in emissions and transboundary transport of acidifying air pollution in Europe, J. Environ. Manage., 57, 31–50, 1999. Brenot, H., Theys, N., Clarisse, L., van Geffen, J., van Gent, J.,
Van Roozendael, M., van der A, R., Hurtmans, D., Coheur, P.-F., Clerbaux, C., Valks, P., Hedelt, P., Prata, F., Rasson, O., Sievers, K., and Zehner, C.: Support to Aviation Control Service (SACS): an online service for near-real-time satellite monitoring of vol-canic plumes, Nat. Hazards Earth Syst. Sci., 14, 1099–1123, doi:10.5194/nhess-14-1099-2014, 2014.
EMEP MSC-W: Transboundary acidification, eutrophication and ground level ozone in Europe 2013, EMEP Status Report 1/2015, 2015.
Gettelman, A., Schmidt, A., and Kristjansson, J. E.: Icelandic vol-canic emissions and climate, Nat. Geosci, 8, 243–243, 2015. Gíslason, S. R., Stefánsdóttir, G., Pfeffer, M. A., Barsotti, S.,
Jóhannsson, T., Galeczka, I., Bali, E., Sigmarsson, O., Stefáns-son, A., Keller, N. S., SigurdsStefáns-son, Á., BergsStefáns-son, B., Galle, B., Jacobo, V. C., Arellano, S., Aiuppa, A., Jónasdóttir, E. B., Eiríks-dóttir, E. S., Jakobsson, S., Guðfinnsson, G. H., Halldórsson, S. A., Gunnarsson, H., Haddadi, B., Jónsdóttir, I., Thordarson, T., Riishuus, M., Högnadóttir, T., Dürig, T., Pedersen, G. B. M., Höskuldsson, Á., and Gudmundsson, M. T.: Environmental pres-sure from the 2014–15 eruption of Bárðarbunga volcano, Iceland, Geochem. Persp. Lett., 1, 84–93, 2015.
Grattan, J., Durand, M., and Taylor, S.: Illness and elevated Human Mortality in Europe Coincident with the Laki Fissure eruption. Vocanic Degassing: Geol. Soc, SP 213, The Geological Society of London, 410–414, 2003.
Ialongo, I., Hakkarainen, J., Kivi, R., Anttila, P., Krotkov, N. A., Yang, K., Li, C., Tukiainen, S., Hassinen, S., and Tamminen, J.: Comparison of operational satellite SO2products with
Holuhraun fissure eruption, Atmos. Meas. Tech., 8, 2279–2289, doi:10.5194/amt-8-2279-2015, 2015.
Levelt, P. F., van den Oord, G. H. J., Dobber, M. R., Mälkki, A., Visser, H., de Vries, J., Stammes, P., Lundell, J., and Saari H.: The Ozone Monitoring Instrument, IEEE T. Geosci. Remote, 44, 1093–1101, doi:10.1109/TGRS.2006.872333, 2006.
Kuenen, J. J. P., Visschedijk, A. J. H., Jozwicka, M., and Denier van der Gon, H. A. C.: TNO-MACC_II emission inventory; a multi-year (2003–2009) consistent high-resolution European emission inventory for air quality modelling, Atmos. Chem. Phys., 14, 10963–10976, doi:10.5194/acp-14-10963-2014, 2014.
Moxnes, E. D., Kristiansen, N. I., Stohl, A., Clarisse, L., Durant, A., Weber, K., and Vogel, A.: Separation of ash and sulphur diox-ide during the 2011 Grimsvötn eruption, J. Geophy. Res.-Atmos., 119, 7477–7501, 2014.
Oberhuber, J. M., Herzog, M., Graf, H., and Schwanke, K.: Volcanic plume simulation on large scales, J. Volcanol. Geoth. Res., 87, 29–53, 1998.
Rodgers, C. D.: Inverse Methods for Atmospheric Sounding: The-ory and Practice, World Sci., Singapore, 2000.
Schmidt, A., Ostro, B., Carslaw, K. S., Wilson, M., Thordarson, T., Mann, G. W., and Simmons, A. J.: Excess mortality in Europe following a future Laki-style Icelandic eruption, P. Natl. Acad. Sci. USA, 108, 15710–15715, 2011.
Schmidt, A., Leadbetter, S., Theys, N., Carboni, E., Witham, C. S., Stevenson, J. A., Birch, C. E, Thordarson, T., Turnock, S., Barsotti, S., Delaney, L., Feng, W., Grainger, R. G., Hort, M. C., Höskuldsson, Á., Ialongo, I., Ilyinskaya, E., Jóhannsson, T., Kenny, P., Mather, T. A., Richards, N. A. D., and Shepherd, J.: Satellite detection, long-range transport, and air quality impacts of volcanic sulphur dioxide from the 2014–2015 flood lava erup-tion at Bárðarbunga (Iceland), J. Geophys. Res.-Atmos., 120, 9739–9757, doi:10.1002/2015JD023638, 2015.
Sears, T. M., Thomas, G. E., Carboni, E., A Smith, A. J., and Grainger, R. G.: SO2 as a possible proxy for volcanic ash in
aviation hazard avoidance, J. Geophys. Res.-Atmos., 118, 5698– 5709, 2013.
Sigmundsson, F., Hooper, A., Hreinsdottir, S., Vogfjord, K. S., Ofeigsson, B. G., Heimsson, E. R., Dumont, S., Parks, M., Spaans, K., Gudmindsson, G. B., Drouin, V., Arnadottir, T., Jons-dottir, K., Gudmundsson, M. T., HognaJons-dottir, T., FridriksJons-dottir, H. M., Hensch, M., Einarsson, P., Magnusson, E., Samsonov, S., Brandsdottir, B., White, R. S., Agustdottir, T., Greenfield, T., Green, R. G., Hjartardottir, A. R., Pedersen, R., Bennet, R. A., Geirsson, H., La Femina, P. C., Bjornsson, H., Palsson, F., Sturkell, E., Bean, C. J., Mollhoff, M., Braiden, A. K., and Eibl, E. P. S.: Segmented lateral dyke growth in a rifting event at Barðarbunga volcanic system, Iceland, Nature, 517, 191–195, 2015.
Simpson, D., Benedictow, A., Berge, H., Bergström, R., Emberson, L. D., Fagerli, H., Flechard, C. R., Hayman, G. D., Gauss, M., Jonson, J. E., Jenkin, M. E., Nyíri, A., Richter, C., Semeena, V. S., Tsyro, S., Tuovinen, J.-P., Valdebenito, Á., and Wind, P.: The EMEP MSC-W chemical transport model – technical descrip-tion, Atmos. Chem. Phys., 12, 7825–7865, doi:10.5194/acp-12-7825-2012, 2012.
Theys, N., De Smedt, I., van Gent, J., Danckaert, T., Wang, T., Hen-drick, F., Stavrakou, T., Bauduin, S., Clarisse, L., Li, C., Krotkov, N., Yu, H., Brenot, H., and Van Roozendael, M.: Sulphur diox-ide vertical column DOAS retrievals from the Ozone Monitor-ing Instrument: Global observations and comparison to ground-based and satellite data, J. Geophys. Res.-Atmos., 120, 2470– 2491, doi:10.1002/2014JD022657, 2015.
Thomas, H. E. and Prata, A. J.: Sulphur dioxide as a volcanic ash proxy during the April–May 2010 eruption of Eyjafjalla-jökull Volcano, Iceland, Atmos. Chem. Phys., 11, 6871–6880, doi:10.5194/acp-11-6871-2011, 2011.
Thordarson, T. and Self, S.: The Laki (Skaftár Fires) and Gri-msvötn eruptions in 1783–1785, B. Volcanol., 55, 233–263, 1993.
Thordarson, T. and Self, S.: Atmospheric and environmental effects of the 1783-1784 Laki eruption: A review and reassessment, J. Geophys. Res.-Atmos., 108, AAC 7-1–AAC 7-29, 2003. Thordarson, T. and Hartley, M.: Atmospheric sulphur loading by
the ongoing Nornahraun eruption, North Iceland, EGU General Assembly Conference Abstracts, 17, 2015EGUGA, 1710708T, 2015.
Tørseth, K., Aas, W., Breivik, K., Fjæraa, A. M., Fiebig, M., Hjellbrekke, A. G., Lund Myhre, C., Solberg, S., and Yttri, K. E.: Introduction to the European Monitoring and Evalua-tion Programme (EMEP) and observed atmospheric composiEvalua-tion change during 1972–2009, Atmos. Chem. Phys., 12, 5447–5481, doi:10.5194/acp-12-5447-2012, 2012.
World Health Organisation (WHO): Air quality guidelines, Global update 2005, Particulate matter, ozone, nitrogen dioxide and sul-phur dioxide, http://www.who.int/phe/health_topics/outdoorair/ outdoorair_aqg/en/ (last access: 9 October 2015), World Health Organisation, European Centre for Environment and Health Bonn Office, ISBN 92 890 2192 2005.
Yang, K., Krotkov, N. A., Krueger, A. J., Carn, S. A., Bhar-tia, P. K., and Levelt, P. F.: Retrieval of large volcanic SO2