321
COMPARISON OF SINGLE NUCLEOTIDE POLYMORPHISMS AND MICROSATELLITES IN NON-INVASIVE GENETIC MONITORING OF A WOLF POPULATION
ELENA FABBrI1, r. CANIgLIA1, NADIA MuCCI1, H. P. THOMSEN2, K. KrAg2,
C. PErTOLDI2, V. LOESCHCKE2 and E. rANDI1
1 Istituto Superiore per la Protezione e la Ricerca Ambientale (ISPRA), Laboratorio di Genetica, Via Cà Fornacetta 9, I-40064 Ozzano dell’Emilia (Bologna), Italy
2 Ecology and Genetics, Department of Biological Sciences, University of Aarhus, Ny Munkegade 114, Building 1540, DK-8000 Aarhus C, Denmark
Abstract - Single nucleotide polymorphisms (SNPs) which represent the most widespread source of sequence variation in genomes, are becoming a routine application in several ields such as forensics, ecology and conservation genetics. heir use, requiring short ampliications, may allow a more eicient genotyping of degraded DNA. We provide the irst applica-tion of SNP genotyping in an Italian non-invasive genetic monitoring project of the wolf. We compared three diferent techniques for genotyping SNPs: pyrosequencing, SNaPshot® and TaqMan® Probe Assay in real-Time PCr. We succes-sively genotyped nine SNPs using the TaqMan Probe Assay in 51 Italian wolves, 57 domestic dogs, 15 wolf x dog hybrids and 313 wolf scats collected in the northern Apennines. he obtained results were used to estimate genetic variability and PCr error rates in SNP genotyping protocols compared to standard microsatellite analysis. We evaluated the cost, labora-tory efort and reliability of these diferent markers and discuss the possible future use of VeraCode, SNPlex and Fluidigm EP1 system in wild population monitoring.
Key words:Canis lupus, fecal samples, genotyping errors, Pyrosequencing, SNaPshot®, TaqMan® Assay.
INTrODuCTION
he wolf (Canis lupus Linnaeus 1758) is a top-level predator, protected by law in several European coun-tries. Ater centuries of decline worldwide, wolf pop-ulations are now expanding in anthropic areas, where they predate both wild and domestic ungulates (Es-puno et al. 2004; gazzola et al., 2008). Action plans have been designed, at national and European level, to recognize the major threats to the species’ survival and to identify the conservation priorities and guide-lines for wolf coexistence with humans (Boitani, 2000; Fritts et al., 2003).
and dispersal rates are still poorly understood, thus this expanding wolf population needs to be carefully monitored (genovesi, 2002). However, wolves are very elusive and information on their distribution, demographic structure, variability and genetic iden-tiication are diicult to obtain directly. For these rea-sons, wolf-howling, snow tracking, fecal sample col-lection, diet analysis and, more recently, non-invasive genetics have become popular techniques employed in wolf studies (Caniglia et al., 2010a; Ciucci and Boitani, 2010; Fabbri et al., 2007; Jędrzejewski et al., 2005; Marucco et al., 2009; Scandura et al., 2011).
Non-invasive genetics is a combination of ield, laboratory and analytical techniques that allow the study of the biology of natural populations, without observing or capturing individuals (Broquet et al., 2007). Microsatellites (STrs) have been the marker of choice in the last two decades, used to identify species and to detect individual genotypes from non-invasive samples (Taberlet and Luikart, 1999; Broquet et al., 2007). However, the DNA degradation of non-invasive samples, which leads to low amplii-cation rates and genotyping errors, risks the genera-tion of false genotypes, which do not correspond to any extant individual (Boninet al., 2004). he most frequent genotyping errors, allelic dropout (ADO: one allele of a heterozygous individual is not ampli-ied during a positive PCr) or false allele amplii-cation (FA: artifacts resulting from slippage during the PCr cycles and misinterpreted as true alleles be-cause they have the same characteristic shadow band proile) can lead to the number of individuals being overestimated (Broquet and Petit, 2004). To improve genotyping success and reliability, it is preferable to amplify DNA fragments that are as short as possible. he use of single nucleotide polymorphisms (SNPs) requires only the ampliication of very short frag-ments and this makes them particularly suitable for non-invasive genetic monitoring projects (Seddon et al., 2005).
SNPs represent the most widespread source of sequence variation within genomes (Brumield et al., 2003). hey have emerged as valuable genetic mark-ers in conservation genetics. SNPs are prevalently
biallelic markers and are inherently less informative if compared to the multiallelic microsatellites when used for individual identiication, parentage analysis and population genetics. However, their simpler mu-tational dynamics strongly reduces risks of homo-plasy (Syvänen, 2001; Vignal et al., 2002; Brumield et al., 2003; Chen and Sullivan, 2003). Furthermore, fast and inexpensive methods are available to screen hundreds or thousands of SNPs per sample per pop-ulation (Chen and Sullivan, 2003; Ellegren, 2008; Wang et al., 2009). SNP genotypes, based on single nucleotide changes, are universally comparable and do not require standardization across detection plat-forms. In contrast, it is diicult to compare micros-atellite data sets produced by diferent laboratories, due to inconsistencies in allele size calling and mis-interpretation of the electropherograms (Vignal et al., 2003). In genetic monitoring projects involving carnivores like the wolf, brown bear and lynx, which have a huge dispersal capacity and widespread terri-tories and that may cross country borders, collabora-tions between laboratories are necessary as suggested in the Action Plan for the wolf conservation in Eu-rope (Boitani, 2000).
Despite these advantages, the applications of SNPs in non-invasive monitoring projects to inves-tigate ecological and conservation issues are limited (Sanchez and Endicott, 2006), and individual micro-satellite genotyping from fecal samples still remains predominant. Many new technologies for SNP geno-typing have been developed in the last few years and it can be diicult to choose an appropriate method for a given application (Chen and Sullivan, 2003), in particular for non-invasive DNA analysis. In this study, we have compared three diferent techniques for SNP genotyping of non-invasive DNA: Pyrose-quencing (Biotage), SNaPshot® (Applied Biosystem),
and TaqMan® Assay (Applied Biosystem) used in a
the most common commercial technologies based on minisequencing reaction and using luorescent ddNTPs (Sobrino et al., 2005). Quantitative real-Time PCr can be used for the allelic detection of a single nucleotide polymorphic site using PCr assay probes labeled with diferent luorescent reporter dyes, speciic for each allele.
Pyrosequencing, SNaPshotTM and TaqMan®
Probe Assay are standardized methodologies used for high-throughput SNP analysis, and they have already been successfully applied to degraded DNA analysis for species identiication (Moran et al., 2008; Morin and Mccathy, 2007), human forensic case resolution (Nilsson et al., 2006; Tschentscher et al. 2008), investigation of anthropogenic issues (Quintáns et al., 2004), and to evaluate DNA quality (Morin et al., 2000); thus they appear promising in SNP analysis from non-invasive DNA.
Although SNPs could replace STrs in popula-tion and conservapopula-tion genetic studies which are usually based on problematic DNA samples, it mains unclear how many SNP markers will be re-quired or what the optimal characteristics of these markers should be in order to obtain suicient
sta-tistical power to detect diferent levels of population diferentiation (Morin et al., 2009). herefore, we compared the eiciency and reliability of ampliica-tion, identiication of individuals, and estimation of genetic diversity, of six STrs and nine SNPs, using data from a non-invasive monitoring project. Finally, we compared the performance of these markers in population genetic and structure analyzes and their capability in the detection of wolf x dog hybrids in the Italian wolf population.
MATErIALS AND METHODS
Sample collection and DNA extraction
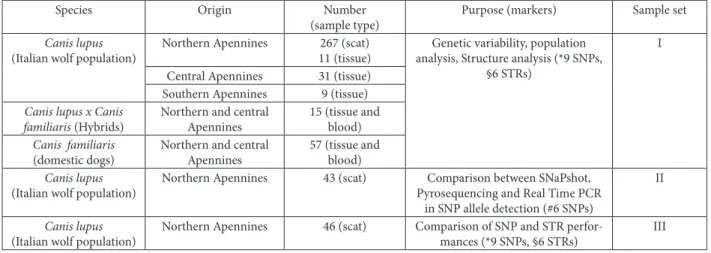
In this study we analyzed three sets of samples. Set one (I) includes DNA extracted from tissues col-lected mainly from the wolf source population in the central and southern Apennines, and from scat col-lected from recent expansion areas in the northern Apennines (Table 1). All wolf tissues were collected from carcasses which had the typical Italian wolf coat color pattern without any detectable morphological and genetic signals of hybridization with dogs (ran-di et al., 2000; randi and Lucchini, 2002). Scats were collected in the northern Apennines during a LIFE Table 1. Origin, size and type of the analyzed samples. Samples are regrouped in three sets for the performed analysis. he dog samples include both domestic, obtained from veterinary practice (n=26), and feral individuals, living sympatric with wolves (n=31).
§ Six STr loci are: FH2004, FH2088, FH2096 and FH2137 (Francisco et al., 1996), CPH2 and CPH8 (Fredholm and Wintero 1995). #Six SNP loci are: 1C06_138, 38K22_150, 96B17_422, 182B11_138, 309N24_298, 310M20_207 (Andersen et al., 2006). * Nine SNP
loci are: 1C06_138, 38K22_150, 182B11_138, 309N24_298, 168J14_149, 218J14_ 81 (Andersen et al., 2006), 372M9_32, BLA22_199, BLB52_368 (obtained from Seddom et al., 2005 and Sutter et al., 2004).
Species Origin Number
(sample type)
Purpose (markers) Sample set
Canis lupus
(Italian wolf population)
Northern Apennines 267 (scat) 11 (tissue)
genetic variability, population analysis, Structure analysis (*9 SNPs,
§6 STrs)
I
Central Apennines 31 (tissue) Southern Apennines 9 (tissue)
Canis lupus x Canis familiaris (Hybrids)
Northern and central Apennines
15 (tissue and blood)
Canis familiaris
(domestic dogs)
Northern and central Apennines
57 (tissue and blood)
Canis lupus
(Italian wolf population)
Northern Apennines 43 (scat) Comparison between SNaPshot, Pyrosequencing and real Time PCr
in SNP allele detection (#6 SNPs)
II
Canis lupus
(Italian wolf population)
Northern Apennines 46 (scat) Comparison of SNP and STr perfor-mances (*9 SNPs, §6 STrs)
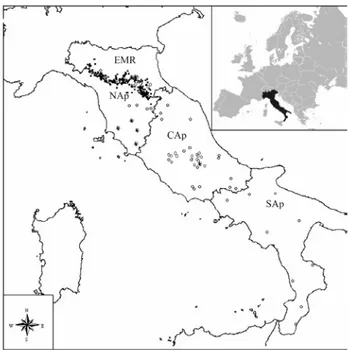
Project, LIFE00NAT/IT/7214, from 2001 to 2004 and during an ongoing non-invasive wolf population monitoring project supported by Emilia-romagna region from 2002 to 2008 (Fig. 1) (Caniglia et al., 2010b). We have split the Italian wolves into three sub-groups according to their geographic origin: northern, central and southern Apennines. Although there is no obvious geographical break in the wolf distribution, we maintained this subdivision, aiming to separate groups of samples collected from central and southern areas, where the species survived dur-ing the bottleneck in the 1970s, and samples collect-ed from the area of recent expansion in the north-ern Apennines (Fabbri et al., 2007). Moreover we analyzed 57 dog tissue and blood samples, collected from both domestic individuals of several breeds and ferals, in areas where they are sympatric with wolves. Furthermore, we analyzed 15 hybrid (wolf-dog) in-dividuals; three of them were from captivity. hey all showed anomalous phenotypic characters and had been previously identiied as hybrid by genetic analy-sis (Lucchini et al., 2002). he samples of set I were
analyzed in order to obtain information about the distribution of genetic variability of nine SNP mark-ers in the Italian wolf population, in the dogs and hybrid individuals. Set two (II) includes 43 wolf scat samples collected during the monitoring project in Emilia-romagna, and belong to three diferent DNA quality categories previously assessed by genotyping them at six microsatellite loci (see also STr genotyp-ing). he good quality category includes samples (n = 14) reliably genotyped at all loci; the medium qual-ity category includes samples (n = 14) reliably geno-typed at 50% of loci, while the low quality category includes samples (n = 15) reliably genotyped at less than 50% of loci. he reliability was assessed by re-liotype sotware (Miller et al., 2002). his dataset was used to compare the eiciency of the three diferent SNP genotyping methodologies: Pyrosequencing, SNaPShot® and TaqMan® Assay. Finally, we randomly
selected another 46 scat samples from non-invasive DNA (set III) to compare the performance of nine SNPs and six STrs in individual genotyping. he DNA quality of the samples was pre-screened by PCr amplifying at two microsatellite loci (for pro-tocol see below). In each case, total DNA from tissue and blood samples was extracted using a guanidine thiocyanate and silica protocol (gerlof et al., 1995), while DNA from fecal samples was obtained through the Qiagen DNeasy 96 Blood & Tissue Kit and a ro-botic platform: MultiProbe IIEX Liquid Handling
Sys-tem. Scat samples and DNAs were processed in sepa-rate rooms to avoid contamination. One negative control sample (no DNA) was added to each PCr or laboratory technique procedure.
SNP discovery and genotyping
We analyzed 139 candidate loci in 10 dogs and 14-20 Italian wolf tissue samples, by resequencing DNA regions containing SNPs in dogs (guyon et al., 2003; Sutter et al., 2004; Seddon et al., 2005). We discov-ered 53 sequences showing from one to ive poly-morphic SNPs, which led us to identify a total of 106 SNPs in the Italian wolf population (Andersen et al., 2006). PCrs were performed using primers and pro-tocols as described in guyon et al. (2003), Sutter et al. (2004) and Seddon et al. (2005). PCr products were Fig. 1. Study area: Italian Peninsula. he dark small circles
puriied using Exo-Sap (Amersham) and sequenced in both directions using a 3130xl genetic Analyzer (Applied Biosystems). Sequences were analyzed and aligned using Seqsecape v. 2.5 (Applied Biosystems) and BioEdit v.7.0.1 (Hall, 1999).
We compared the genotyping performance of three diferent allelic discrimination techniques: SNaPshot® Kit Analysis, Pyrosequencing, and
Taq-Man® Assay, choosing six unlinked SNPs from
the 106 SNPs previously detected: 1C06_138, 38K22_150, 96B17_422, 182B11_138, 309N24_298, 310M20_207 (Andersen et al., 2006). Pyrosequenc-ing technology uses an enzyme-cascade system con-sisting of four enzymes and speciic substrates to produce light whenever a nucleotide is incorporated to form a base pair with the complementary base in a DNA template strand. he amount of light is propor-tional to the number of incorporated nucleotides. To obtain the single-strand DNA necessary for the py-rosequencing, either the forward or reverse primer was biotinylated for immobilization of PCr products using Vacuum Prep Tool (Biotage). Primers suitable for pyrosequencing were designed by Assay design sotware v. 1.0.6 (Biotage). he single-strand PCr products were pyrosequenced by the PSQ 96MA System (Biotage). Protocol details are available in Anderson et al. (2006).
he SNaPshot® Multiplex kit can investigate up
to ten SNPs simultaneously by employing PCr fol-lowed by dideoxy single-base extension of an unla-beled primer. he primer is designed to anneal to the sequence adjacent to the SNP site. To analyze more SNPs simultaneously it may be necessary to add a non-annealing tail to a primer to make its length suf-iciently diferent from other primers to prevent the SNP markers from overlapping (ABI prism protocol). he irst PCr was performed in 10 μl using the same primers designed for pyrosequencing analysis. PCr products were puriied by Exo-Sap (Amersham). he second PCr was performed in multiplex using 1 μl of PCr cleaned product, 1 μl of SNaPshot® mix (Applied
Biosystem), 0.2 μl of each extension primer 1 μMol, bi-distillate water until 10 μl and the following ther-mal cycle condition: 25 cycles of 96°C for 10 s, 50°C
for 5 s, 60°C for 30 s.he PCr products were ana-lyzed by a 3130xl ABI Automatic Sequencer (Applied Biosystem) using the geneScan® - 120 LIZ (Applied
Biosystem) as marker ladder and the ABI sotware geneMapper v. 4.0 for the allele analysis.
real-Time PCr is used to detect the end-point luorescence by virtue of the presence of two probes that difer at the polymorphic site, and the luorescent dye attached to the 5’ end. During the PCr anneal-ing step, the TaqMan probes hybridize to the target DNA, and in the extension step, the luorescent dye (in 5’ position) is cleaved by the 5’ nuclease activity of the Taq polymerase, leading to an increase in luo-rescence (Sobrino et al. 2005). Primers and probes were designed using Custom Taqman® SNP
genotyp-ing Assay Service by Applied Biosystem. he ampli-ication reactions were performed by the 7500 Fast System real-Time PCr (Applied Biosystem) in 5 μl of inal volume using TaqMan universal Fast Master Mix (Applied Biosystem). Primer and probe concen-trations, PCr cycles and conditions were performed according to manufacturer’s instructions. he de-tected polymorphisms were analyzed using the 7500 Fast System SDS Sotware.
Primer sequences will be provided upon re-quest.
STR genotyping
to ADO or FA ampliication, we analyzed all non-in-vasive samples following a multi-tube protocol (gag-neux et al., 1997; Taberlet et al., 1996). his foresees from four to eight replicates for each locus/sample and a reliability analysis of multilocus genotypes us-ing the sotware reliotype. he quality of the DNA samples was initially screened by the ampliication of two STr loci, retaining only samples showing more than 50% positive ampliications (Caniglia et al., 2010b).
SNP and STR genotyping error analysis
genotypes obtained by amplifying non-invasive DNAs from sample set III at six STrs and nine SNPs were used to evaluate genotyping errors. he panel of six STrs includes the same markers used for indi-vidual identiication previously described, while the panel of nine SNPs includes four SNPs already used in the comparison among Pyrosequencing, SNaP-shot® and TaqMan® Assay (1C06_138, 38K22_150,
182B11_138, 309N24_298) and the other ive (168J14_149, 218J14_ 81, 372M9_32, BLA22_199, BLB52_368) (Table 1).
he sotware gimlet v. 1.3.3 (Valière, 2001) was used to estimate error rates in individual genotyping: ADO, FA, and successful PCrs. gimlet allows the user to construct consensus genotypes from a set of PCr repetitions for each sample and to calculate the error rates comparing the repeated genotypes and their consensus.
We used the sotware reliotype to evaluate the reliability (r) of the multilocus genotypes. reliotype is a program for assessing how reliable an observed multilocus genotype is, using a maximum likelihood approach. he sotware estimates the dropout prob-ability considering allele frequencies, assuming that false alleles do not occur or can be removed from the data (Miller et al., 2002).
SNP and STR variability analysis
Variability analysis was performed using the sot-ware genAlEx v. 6.1 (Peakall and Smouse, 2006).
he number of diferent alleles (Na), Shannon’s In-formation Index (I), observed (Ho) and expected (He) heterozygosity, unbiased Expected Heterozy-gosity (uHe), Fixation Index (F) and Principal Coor-dinate Analysis (PCA) were calculated separately for the Italian wolves (including tissue and scat samples) and dogs, and for SNPs and STrs. We further esti-mated the Hardy-Weinberg probability of identity (PI) for an increasing number of loci, i.e. the prob-ability that diferent individuals by chance share an identical genotype. Moreover, as wolvesin the same pack are known to be partially related (Mech and Boitani, 2003), i.e. sharing alleles which are identical by descent, we evaluated the probability of identity between sibs (PIsibs; Waits et al., 2001). To deter-mine the minimum number of loci needed for ge-netic tagging we estimated the number of matches between wolf genotypes (command Matches in the option Multilocus from the genAlEx menu) and simulated a dataset of 318 individuals for biallelic codominant markers.
To evaluate the SNP power in the population identiication and to assign the individuals to de-tected populations, we used the sotware Structure v. 2.3 (Falush et al. 2003). We performed four inde-pendent runs for each K cluster using the Admixture (each individual may have ancestry in more than one parental population) and LOCPrIOr (sam-pling locations are used as prior information to as-sist the clustering and improve the clustering for data sets with few markers, few individuals or very weak structure as suggested by Hubisz et al. (2009) models with Independent Allele Frequencies (I-model). We set the following run parameters: 200,000 MCMC discarding the irst 20,000 (considered as burn-in period), according to other studies that used 104 and
105 respectively of burn-in period and MCMC
the data posterior probability, Ln P(D), between each successive K (Evanno et al. 2005). hen we estimated the membership proportion (Q) of populations into the detected clusters, and the individual membership proportion q.
rESuLTS
SNP allele detection: comparison of methodologies
We tested the eiciency of SNP genotyping from non-invasive DNA using three standard methodologies: pyrosequencing, the SNaPShot® and TaqMan® Assays.
We selected six unlinked SNPs from a previous study (Anderson et al., 2006) and 43 fecal samples of difer-ent quality tested by STr ampliications. he rates of positive PCrs and ADO were calculated by gimlet v1.3.3 using three replicate PCrs per locus per sam-ple. he SNaPShot® methodology showed the
high-est positive PCr rate but only an intermediate ADO rate. TaqMan® assay methodology showed the lowest
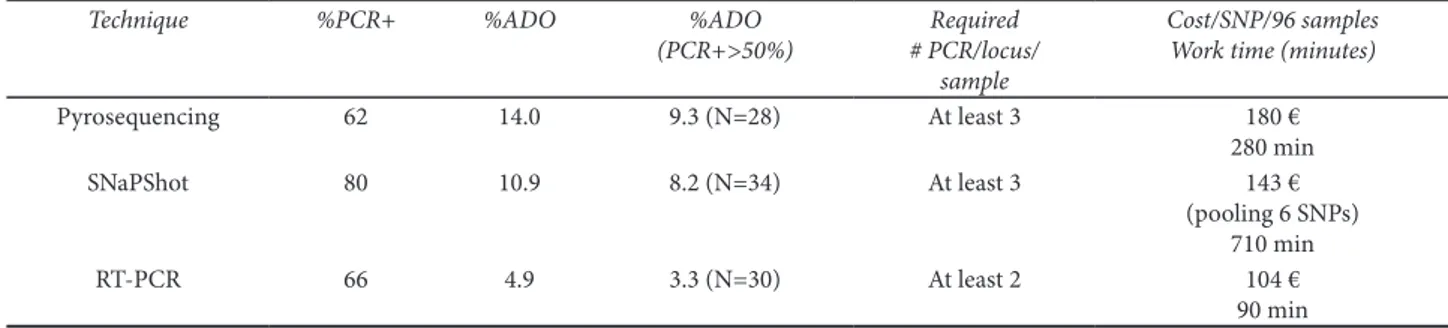
ADO rate but intermediate ampliication rates. Pyro-sequencing showed a high dropout rate and low rate of positive ampliications (Table 2). We estimated the cost for a single SNP genotyping per 96 samples (cor-responding to a 96 well plate) and the necessary time for laboratory work (Table 2). using the SNaPShot®
methodology, more SNPs can be easily multiplexed, but this involves two ampliications, an Exo-Sap pu-riication and an electrophoresis, resulting in the longest procedure of the three methodologies.
Taq-Man® Assay by real-Time PCr is the fastest of the
three procedures, requiring only a single PCr, but it is impossible to multiplex more loci. Pyrosequenc-ing is both a time-consumPyrosequenc-ing and expensive proce-dure. Having evaluated the ampliication success, al-lelic dropout, costs and working time, we deinitely preferred to use real-Time PCr to analyze SNPs in non-invasive DNA by an end-point luorescent ex-periment like that described above.
PCR success and genotyping error rate in non-invasive samples
For evaluating the use of SNP versus STr markers in non-invasive samples, we analyzed 46 scat samples that showed more than 50% positive ampliications in four replicates per two STr loci in a total at least four out of eight positive PCrs. Fig. 2 shows the av-erage of positive PCrs and genotyping errors (ADO, FA) calculated in nine SNPs and six STrs using four independent PCrs per sample/locus. he percent-age of positive PCrs was high for both STr (from 0.72 to 0.97) and SNP (from 0.86 to 0.92) markers. genotyping errors occurred more frequently in STr (ADO: from 0.079 to 0.359; FA: from 0 to 0.1) than in SNP (ADO: from 0 to 0.18; FA: 0) ampliications (Fig. 2). reliability estimates by reliotype showed a slightly higher level for SNPs than STrs (Fig. 2). he diferences of ADO, FA and reliability estimates between SNPs and STrs were at the limit of signii-cance for ADO and FA but were not signiicant for Table 2. Comparison of Pyrosequencing, SNaPShot® and TaqMan® Assay for SNP genotyping in non-invasive DNA. Percentage of
posi-tive PCrs on the total of 774 reactions, percentage of ADO, percentage of ADO calculated in samples with more than 50% of posiposi-tive PCrs, estimated using sotware gimlet v. 1.3.3. Number of PCr per locus per sample necessary to identify a reliable genotype; esti-mated costs per SNP per plate (96 samples) and needed working time.
Technique %PCR+ %ADO %ADO
(PCR+>50%)
Required # PCR/locus/
sample
Cost/SNP/96 samples Work time (minutes)
Pyrosequencing 62 14.0 9.3 (N=28) At least 3 180 €
280 min
SNaPShot 80 10.9 8.2 (N=34) At least 3 143 €
(pooling 6 SNPs) 710 min
rT-PCr 66 4.9 3.3 (N=30) At least 2 104 €
r. using a t-test for paired data, the p-values were as follows: 0.0472, 0.0574, 0.702 for ADO, FA and r, respectively.
Genetic variability and individual identiication
We determined the individual genotypes at six STr and nine SNP loci in 318 Italian wolves, 57
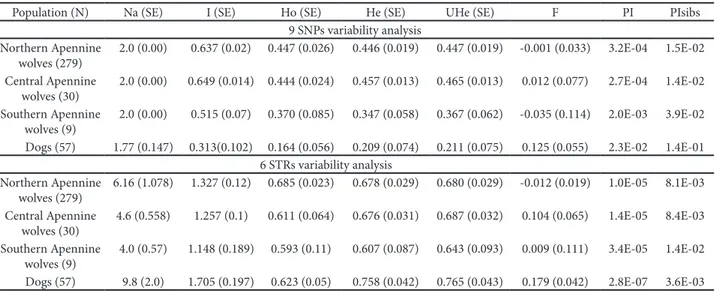
domes-tic dogs and 15 wolf x dog hybrids (Table 1). We previously selected the STr and SNP loci for their polymorphism in the Italian wolf population and for maximizing the diference for species identiication between wolves and dogs based on fecal samples. All microsatellites were polymorphic in all popula-tions, showing 3-11 alleles per locus in wolves and 5-17 alleles per locus in dogs. Values of Ho ranged from 0.59 to 0.68 and He from 0.60 to 0.75 (Table 3). All SNP loci were polymorphic in the wolf sub-pop-ulations but not in dogs where two SNPs displayed monomorphism. his is not surprising because we chose SNP polymorphic prevalently in wolf samples or ixed between wolf and dog. SNPs showed lower values of heterozygosity than microsatellites (Ho = 0.16-0.44; He = 0.20-0.44). he probability of identi-ty for increasing locus combination was lower in the 9 SNPs than in the 6 STrs. Considering the 9 SNPS, this was 2.3E-02 in dogs and ranged from 2.0E-03 to 2.7E-04 in wolves. PIsibs obtained with the 9 SNPs ranged from 3.9E-02 to 1.4E-02 in wolves, indicating that 1.4 wolves among 100 sibs are expected to share, by chance, an identical genotype with another wolf (Table 3). In Fig. 3 we calculated the PI and PIsibs values, increasing the locus combination from 1 to 12 loci. results showed that 12 SNPs are necessary to have PI and PIsibs values comparable with the six Fig. 2. Histogram showing the mean percentage of positive
am-pliications (% + PCr), allelic dropout (ADO), false ampliica-tion (FA) and reliability score (r). Black, light grey and dark grey bars represent the results for six STrs, nine SNPs and nine SNPs + three STrs respectively.
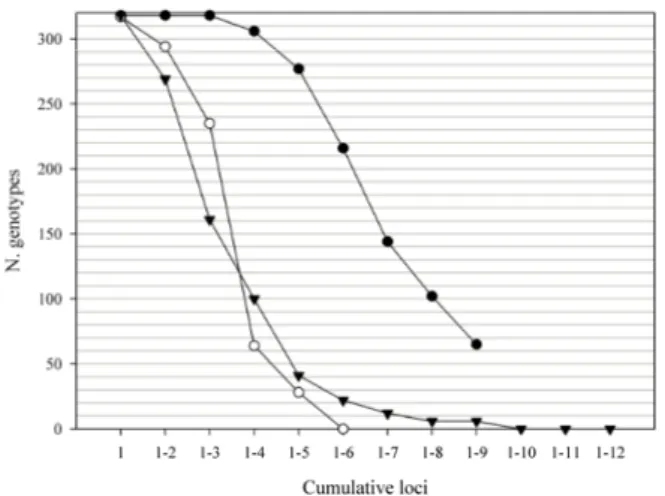
Fig. 4. Number of unique genotypes in 318 individuals from the Italian wolf population by locus combination from one to 12 markers. Line with dark dots represent the 9 SNPs, line with white dots 6 STrs and line with triangles mix markers (9SNPs + 3STrs).
STrs. In any case, the PI and PIsibs values should be evaluated considering the dimension of the analyzed population (N). PI can be regarded as low if less than 1/N. he detection of identical genotypes within the SNP dataset is shown in Fig. 4. using the six STrs, all the 318 analyzed samples exhibited a unique multilo-cus genotype, whereas the nine SNPs identiied only 253 unique genotypes. Discarding genotypes with
missing data, 25 matches involved two genotypes and 4 matches, three genotypes. Sixteen matches in-volved individuals sampled in the same province or that previous studies have identiied as related.
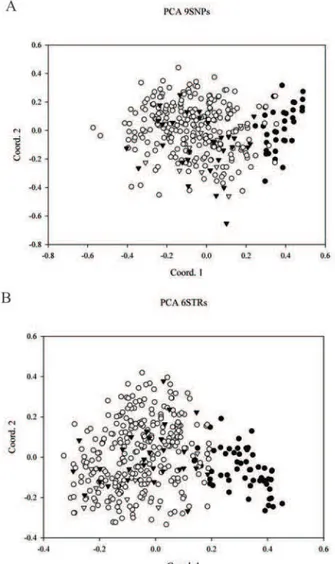
PCA results with SNP and STr genotypes are shown in Fig. 5. Individual scores are plotted on two principal component axes (PC-I and PC-II), which cumulatively explain 47.8% and 45.3% (for SNPs and STr respectively) of the total genetic diversity. he plot shows a separation between wolves and dogs, but it is not so clear as results from previous studies involving more loci (18 STrs, randi and Lucchini, 2002, Lucchini et al., 2004).
A clustering test was performed by Structure v. 2.3 and the membership proportion (Q) of popula-tions in the detected clusters is shown in Table 4. he number of clusters K that maximized the increase in the posterior probability of the data LnP(D) (gar-nier et al., 2004) visualized as ΔK (second order rate of change of likelihood function with respect to K, Evanno et al. 2005), was two both for STr and SNP loci. using STr loci, the wolf population was as-signed to cluster I with a Q of 0.998, dog samples to cluster II with a Q of 0.979 and hybrid individuals showed an intermediate assignation to both clusters, as expected (Table 4). Ater checking the individual membership proportion qi, wolves were assigned to cluster I with a qi average value (on four runs) rang-ing from 0.978 to 0.999. usrang-ing nine SNPs, wolves showed a lower population membership value (Q = 0.820) to cluster I, dog samples were assigned to cluster II with a Q of 0.997, while hybrid individu-als showed intermediate Q values to the two clusters. Looking at the individual membership proportion qi, wolves were assigned to cluster I with average values ranging from 0.643 to 0.819 (Table 4).
DISCuSSION AND CONCLuSION
Non-invasive genetic methods have previously found several applications in population biology, ecol-ogy and conservation for a wide number of species (Waits and Paetkau, 2005). However, the low quality of DNA with consequent genotyping errors and low Fig. 5. Principal component analysis (PCA) of 318 wolf and 57
ampliication success tend to limit the eiciency and the reliability of the obtained results. If compared to microsatellite markers, the application of SNPs re-quires shorter ampliications and thus ofers poten-tially high-throughput, which makes them
particu-larly promising in the analysis of non-invasive DNA. he main obstacle for the use of SNPs is the dii-culty of their identiication in non-model organisms (garvin et al., 2010; ryynänen et al. 2007). Identify-ing polymorphic and informative SNPs in small and Table 3. Estimates of genetic variability at nine SNP and six STr loci, computed using the sotware genAlEx v. 6.1 (Peakal and Smouse 2006). Mean number of diferent alleles (Na), Shannon’s Information Index (I), Observed (Ho) and Expected Heterozygosity (He), un-biased Expected Heterozygosity (uHe), Fixation Index (F), Probability of Identity for unrelated individuals (PI) and full sibs (PIsibs). Standard Errors (SE) are in parentheses.
Population (N) Na (SE) I (SE) Ho (SE) He (SE) uHe (SE) F PI PIsibs
9 SNPs variability analysis Northern Apennine
wolves (279)
2.0 (0.00) 0.637 (0.02) 0.447 (0.026) 0.446 (0.019) 0.447 (0.019) -0.001 (0.033) 3.2E-04 1.5E-02
Central Apennine wolves (30)
2.0 (0.00) 0.649 (0.014) 0.444 (0.024) 0.457 (0.013) 0.465 (0.013) 0.012 (0.077) 2.7E-04 1.4E-02
Southern Apennine wolves (9)
2.0 (0.00) 0.515 (0.07) 0.370 (0.085) 0.347 (0.058) 0.367 (0.062) -0.035 (0.114) 2.0E-03 3.9E-02
Dogs (57) 1.77 (0.147) 0.313(0.102) 0.164 (0.056) 0.209 (0.074) 0.211 (0.075) 0.125 (0.055) 2.3E-02 1.4E-01 6 STrs variability analysis
Northern Apennine wolves (279)
6.16 (1.078) 1.327 (0.12) 0.685 (0.023) 0.678 (0.029) 0.680 (0.029) -0.012 (0.019) 1.0E-05 8.1E-03
Central Apennine wolves (30)
4.6 (0.558) 1.257 (0.1) 0.611 (0.064) 0.676 (0.031) 0.687 (0.032) 0.104 (0.065) 1.4E-05 8.4E-03
Southern Apennine wolves (9)
4.0 (0.57) 1.148 (0.189) 0.593 (0.11) 0.607 (0.087) 0.643 (0.093) 0.009 (0.111) 3.4E-05 1.4E-02
Dogs (57) 9.8 (2.0) 1.705 (0.197) 0.623 (0.05) 0.758 (0.042) 0.765 (0.043) 0.179 (0.042) 2.8E-07 3.6E-03
Table 4. results from Structure analysis: average on four runs of membership proportion (Q) and 90% CIs in parenthesis of popula-tions into the detected clusters obtained by Admixture and I models whit K = 2.
K = 2 6 STRs - Q (90% probability interval) 9 SNPs - Q (90% probability interval)
Population (n) Cluster I Cluster II Cluster I Cluster II
Wolves (318) 0.998 (0.997–1.000) 0.002 (0.000–0.003) 0.820 (0.987–1.000) 0.181 (0.000–0.013) Dogs (57) 0.021 (0.000–0.110) 0.979 (0.890–1.000) 0.004 (0.000–0.01) 0.997 (0.98–1.000) Hybrids (15) 0.596 (0.361–0.813) 0.405 (0.187–0.639) 0.574 (0.531–0.997) 0.426 (0.003–0.469)
Table 5. rate of SNP identiication from sequencing. Number of sequenced loci for SNP identiication (tested primer pairs and reliable sequences). Number of identiied polymorphic SNPs. Number of primer/probe for SNP detection tested by rT PCr.
references N. of tested loci
N. of reliable sequences
N. of sequences containing polymor-phic SNPs
N. of SNPs tested by TaqMan Assay Freq. > 1% Freq. > 10%
guyon et al. 2003 76 60 28 24 11
Sutter et al. 2004 45 45 18 14 6
Seddon et al. 2005 18 18 9 9 3
endangered populations is diicult. Checking single sequences has proved to be expensive and requires a considerable laboratory efort. In this study we uti-lized information from BAC clones that are available from the domestic dog (Canis familiaris). We chose 139 polymorphic sequences used in previous studies regarding dog breeds (guyon et al., 2003; Sutter et al., 2004) and endangered wolf populations (Seddon et al., 2005). We tested 139 primer pairs, but only 43% of them showed polymorphic SNPs in the analyzed wolf samples (Table 5), with an average density of one SNP every 470 base. Seddon et al. (2005) identiied 25 variable fragments in Scandinavian wolves out of 40 sequenced, with an average density of one SNP every 306 base. Identiication of polymorphic and informative SNPs in small or diferentiated popula-tions is diicult, even when polymorphic sequences for closely related species are available.
Furthermore, not all SNPs detected in the se-quences are in speciic positions suitable for primer and probe design. In fact, some requirements are necessary. Applied Biosystem and Biotage distribute sotware for these purposes. However, sometimes the primer design fails or the ampliication does not show optimal performances. For example, in our study, out of 27 polymorphisms tested for primer/ probe Assay designed to be used with TaqMan Assay protocol, seven failed and nine showed problems in the analysis of allelic discrimination. To have a huge number of useful SNPs it is a necessary to establish a start point in view of the diiculty in primer design used in SNP genotyping. Next-generation sequenc-ers are able to rapidly generate millions of DNA sequences at reduced costs. he new generation of genome sequencing can produce very huge contig. sequences that can be applied to non-target organ-isms and to investigate several biological questions. Contrarily, DNA microarrays or chips can produce a screen of hundreds of thousands of bp contain-ing SNPs. For example, the Broad Institute has de-veloped a custom canine SNP array in collaboration with Aimetrix. he goal of this project was the re-alization of a SNP array useful in many dog breeds to perform genome-wide association mapping using at least 15,000 SNPs.
Several studies have focused on comparing the advantages and disadvantages of STr and SNP markers for various genetic issues in humans (Bai-ley-Wilson et al., 2005) and in non-model organisms (Coates et al., 2009; ryynänen et al., 2007; Seddon et al., 2005), but not a single study has investigated the application of SNPs in non-invasive samples and evaluated the eiciency of the diferent techniques available for allele detection in non-invasive moni-toring projects. In fact, a great variety of diferent SNP genotyping protocols are available for research-ers, but it is necessary to take into account diferent aspects, like sensitivity, reproducibility, cost, level of throughput, to determine which technology is the most suitable for non-invasive genetic monitoring purpose (Sobrino et al., 2005).
We compared the reliability of allele detection of three common genotyping techniques: Pyrose-quencing, SNaPShot® and TaqMan® Assay, using
non-invasive DNA. TaqMan® Assay was revealed to be the
most reliable in allele detection (like in other studies, Li et al., 2010), even though it showed a lower than expected success rate of ampliication, which may be due to the presence of contaminants in non-invasive DNA. Kontanis and reed (2006) showed that tannins and other oligomeric compounds with free phenolic groups can inhibit the TaqMan® Assay. Our results
could be improved by testing diferent DNA purii-cation or enriching methods before the ampliipurii-cation process. A further strategy might be the dilution of DNAs to a threshold concentration at which inhibi-tors are inefective but contain a suiciently small number of template molecules required to generate reliable PCr products. However this operation could increase the risk of no ampliication products or al-lelic dropouts in low content DNA samples such as the non-invasive ones.
clustering. To obtain a PI from SNP markers com-parable with six STrs we need at least 12 SNPs. In fact nine SNPs are not enough to distinguish indi-viduals in the Italian wolf population: among the 318 analyzed genotypes we found 65 matches (Fig. 4). Simulating a dataset of biallelic codominant markers with uHe = 0.5 and 318 individuals by genAlEx, we found that 12 biallelic markers are necessary to distinguish all individuals. he observed and esti-mated expected variability is lower in the nine SNPs than in the six microsatellites. ryynänen et al. (2007) found a signiicant correlation between the estimat-ed heterozygosityof six biallelic markers and 14 mi-crosatellites in two salmon populations. Our results suggest that nine polymorphic SNPs provide useful information of the general level of genetic diversity but they are not powerful enough for individual de-tection or clustering analysis; in fact SNPs have lower mutation rate per generation (10-8-10-9) than STrs
(10-4) (Brumield et al., 2003). results from
Struc-ture show that nine SNPs are enough to distinguish between wolves, dogs and hybrids running the pro-gram with the LOCPrIOr model that uses prior population information and that is more for per-forming datasets with few markers, but not as much as six STr markers.
Our work conirms that in non-invasive projects and in population genetic studies either a higher number of SNPs or an integrative combination of SNPs/STrs are needed. For example, adding three STrs (choosing among the most polymorphic and reliable) to the nine SNP dataset, all the 318 wolves show a unique genotype (Fig. 4). On the other hand, adding STr markers to the SNP dataset increased the error rate (Fig. 2).
In technologies based on hybridization and luo-rescent detection there is the advantage of avoiding further manipulation steps using a single PCr reac-tion, but there is a limited multiplexing capability. High-throughput equipment for TaqMan Assay is available and can be tested on degraded DNA. For example, the Fluidigm EP1 system for genetic analy-sis enables high-yield SNP genotyping through inte-grated luidic circuits (IFCs) known as dynamic
ar-rays. here are currently two types of dynamic arrays ofered for genotyping applications: 96.96 and 48.48. he irst enables the testing of 96 SNPs against 96 samples in a single run, the second, 48 SNPs and 48 samples (Wang et al. 2009). LightCycler® 1536 System
(roche) allows analysis of up to 1536 samples using reduced reaction volumes. his system is designed to generate basic PCr results in mono- and dual-color assay formats for gene detection, gene expression, and genetic variation analysis.
A subset of very informative SNPs (48 or 96) could be genotyped using relatively cheap technolo-gies such as, for example, VeraCode or Fluidigm EP1 System. he costs of SNP microchip bead application is gradually decreasing, making it available to a wider range of users. he planned costs of a panel of 50 loci using VeraCode SNPs, SNPlex or Fluidigm EP1 sys-tem would be less than 10 Euros, which is 1/20 of the amount necessary for genotyping 12 microsatellite loci with four PCr replicates. However, both these values were estimated excluding salary costs, as well as primer and PCr optimization costs.
hese new techniques for high-throughput SNP genotyping could be used in non-invasive DNA monitoring projects that usually require a huge number of samples to be analyzed. However, we sug-gest evaluating carefully the efects that DNA deg-radation could have when these new technologies, developed for high quality DNA, are used.
Acknowledgments - he authors wish to thank all ield col-leagues for their help in the sample collection. We thank Dr. Claudia greco for her collaboration in genetic analysis on the non-invasive wolf monitoring project and Dr. Alice Mouton for her contribution in sequencing analysis.
rEFErENCES
Andersen, D., Fabbri, E., Santini, A., Pager, S., Cadieu, E., Ga-libert, F., André, C., and E. Randi (2006). Characteriza-tion of 59 canine single nucleotide polymorphisms in the Italian wolf (Canis lupus) population. Mol Ecol Notes,6, 1884–1187.
Bailey-Wilson, JE, Almasy, L, Andrade, M, Bailey, J, Bickeböller, H, Cordell, HJ, Daw, EW, Goldin, L., Goode, E.L., Gray-McGuire, C., Hening, W., Jarvik, G., Maher, B.S., Mendell, N., Paterson, A.D., Rice, J., Satten, G., Suarez, B., Vieland,
V., Wilcox, M., Zhang, H., Ziegler, A., and J.W.MacCluer
(2005). genetic Analysis Workshop 14: microsatellite and single-nucleotide polymorphism marker loci for genome-wide scans. BMC Genetics,6, S1.
Boitani, L. (1992). Wolf research and conservation in Italy. Biol
Conserv. 61, 125–132.
Boitani, L. (2000). Action plan for the conservation of the wolves
(Canis lupus) in Europe. Council of Europe Press,
Stras-bourg, France.
Bonin, A., Bellemain, E., Eidesen, P.B., Pompanon, F., Brochmann,
C., and P Taberlet (2004). How to track and assess
geno-typing errors in population genetics studies. Mol Ecol. 13, 3261–3173.
Broquet, T., and E.Petit (2004). Quantifying genotyping errors
in noninvasive population genetics. Mol Ecol. 13, 3601– 3608.
Broquet, T., Ménard, N., and E.Petit (2007). Noninvasive
popula-tion genetics : a review of samples source, diet, fragment length and microsatellite motif efects on ampliication success and genotyping error rates. Conserv Genet. 8, 249–260.
Brumield, R.T., Beerli, P., Nickerson, D.A., and S.V. Edwards (2003). he utility of single nucleotide polymorphisms in inferences of population history. Trends Ecol Evol. 18, 249–256.
Caniglia, R., Fabbri, E., Greco, C., Galaverni, M., and E. Randi (2010a). Forensic DNA against wildlife poaching: Identii-cation of a serial wolf killing in Italy. Forensic Sci Int Genet. 4, 334–338.
Caniglia, R., Fabbri, E., Greco, C., and E. Randi (2010b).
Non-in-vasive genetic monitoring of the wolf (Canis lupus)
popu-lation in Emilia-romagna. In: Caniglia r, Fabbri E, greco C, randi E (eds) Proceedings of the Conference: Scientiic research and management for wolf conservation in Italy.
Nat Conserv Rep 33, Ministry of Environment-ISPrA,
Bo-logna, Italy, pp 19-66 (in Italian).
Chen, X., and P.F. Sullivan (2003). Single nucleotide polymor-phism genotyping: biochemistry, protocol, cost and throughput. Pharmacogenomics J.3, 77–96.
Ciucci, P., and L. Boitani (2010). Wolf monitoring by
snow-track-ing: criteria, limits and applicability. In: Caniglia r, Fabbri E, greco C, randi E (eds) Procedeeding of the Conference: Scientiic research and management for wolf conservation in Italy. Nat Conserv rep 33, Ministry of Environment-ISPrA, Bologna, Italy, pp 67–89 (in Italian).
Coates, B.S., Sumerford, D.V., Miller, N.J., Kim, K.S., Sappington,
T.W., Siegfried, B.D., and L.C. Lewis (2009).
Compara-tive performance of single nucleotide polymorphism and microsatellite markers for population genetic analysis. J
Hered.5, 556–564.
Ellegren, H. (2008). Sequencing goes 454 and takes large-scale genomics into the wild. Mol Ecol. 17, 1629–1635.
Espuno, N., Lequette, B., Poulle, M.L., Migot, P., and J.D. Lebreton (2004). Heterogeneous response to preventive sheep hus-bandry during wolf recolonization of the French Alps.
Wildlife Soc B.32, 1195–1208.
Evanno, G., Regnaut, S., and J. Goudet (2005). Detecting the
num-ber of cluster of individuals using the sotware STruC-TurE: a simulation study. Mol Ecol.14, 2611–2620.
Fabbri, E., Miquel, C., Lucchini, V., Santini, A., Caniglia, R., Du-champ, C., Weber, J.M., Lequette, B., Marucco, F., Boitani,
L., Fumagalli., L, Taberlet, P., and E. Randi (2007). From
the Apennines to the Alps: colonization genetics of the naturally expanding Italian wolf (Canis lupus) population. Mol Ecol. 16, 1661–1671.
Falush, D., Stephens, M., and J.K. Pritchard (2003). Inference of population structure using multilocus genotype data: linked loci and correlated allele frequencies. Genetics164, 1567–1587.
Francisco, L.V., Langston, A.A., Mellersh, C.S., Neal, C.L., and
E.A. Ostrander (1996). A class of highly polymorphic
tet-ranucleotide repeats for canine genetic mapping. Mamm
Genome7, 359–362.
Fredholm, M., and A.K. Winterø (1995). Variation of short
tan-dem repeats within and between species belonging to the Canidae family. Mamm Genome6, 11–18.
Gagneux, P., Boesch, C., and D.S. Woodruf (1997). Microsatel-lite scoring errors associated with noninvasive genotyp-ing on nuclear DNA ampliied from shed hair. Mol Ecol. 6, 861–868.
Garnier, S., Alibert, P., Audiot, P., Prieur, B., and J.Y. Rasplus (2004). Isolation by distance and sharp discontinuities in gene frequencies: implications for the phylogeography of an alpine insect species, Carabus somieri. Mol Ecol. 13, 1883–1897.
Garvin, M.R., Saitoh, K., and A.J. Gharret (2010). Application of
single nucleotide polymorphisms to non-model species: a technical review. Mol Ecol. Res.10, 915–934
Gazzola, A., Capitani, C., Mattioli, L., and M. Apollonio (2008). Livestock damage and wolf presence. J Zool. 274, 261–269.
Genovesi, P. (ed) (2002) National action plan for wolf (Canis
lu-pus) conservation in Italy, Nat Conserv rep 13. Ministry of Environment-ISPrA, Bologna, Italy, pp 1-94 (in Italian).
Gerlof, U., Schlotterer, C., Rassmann, K., Rambold, I., Hohmann,
G., Frutth, B., and D. Tautz (1995). Ampliication of
hy-pervariable simple sequence repeats (microsatellites) from excremental DNA of wild living Bonobos (Pan paniscus). Mol Ecol. 4, 515–518.
Guyon, R., Lorentzen, T.D., Hitte, C., Kim, L., Cadieu, E., Parker, H.G., Quignon, P., Lowe, J.K., Renier, C., Gelfenbeyn, B., Vignaux, F., DeFrance, H.B., Gloux, S., Mahairas, G.G.,
An-dre´, C., Galibert, F., and E.A. Ostrander (2003). A 1-MB
resolution radiation hybrid map of canine genome. Proc
Natl Acad Sci USA100, 5296–5301.
Hall, T.A. (1999). BioEdit: a user-friendly biological sequence alignment editor and analysis program for Windows 95/98/NT. Nucl,eic Acids Symposium Series41, 95–98.
Hubisz, M.J., Falush, D., Stephens, M., and J.K. Pritchard (2009).
Inferring weak population structure with the assistance of sample group information. Mol Ecol. Res.9, 1322- 1332
Kontanis, E.J., and Reed, F.A. (2006). Evaluation of real-time PCr ampliication eiciencies to detect PCr inhibitors. J Forensic Sci.4, 795–803.
Li, L., Li, C., Zhang, S., Zhao, S., Liu ,Y., and Y. Lin (2010). Analy-sis of 14 highly informative SNP markers on X chromo-some by TaqMan® SNP genotyping assay. Forensic Pop Ge-netics4, 145–148.
Lucchini, V., Fabbri, E., Marucco, F., Ricci, S., Boitani, L., and E.
Randi (2002). Non-invasive molecular tracking of
colo-nizing wolf (Canis lupus) packs in the western Italian Alps.
Mol Ecol.11, 857–868.
Lucchini, V., Galov, A., and E. Randi (2004). Evidence of genetic
distinction and long-term population decline in wolves
(Canis lupus) in the Italian Apennines. Mol Ecol.13, 523–
536.
Jędrzejewski, W., Branicki, W., Veit, C., Međugorac, I., Pilot, M., Bunevich, A.N., Jędrzejewska, B., Schmidt, K., heuerkauf,
J., Okarma, H., Gula, R., Szymura, L., and M. Förster
(2005). genetic diversity and relatedness within packs in an intensely hunted population of wolves Canis lupus.
Acta heriol.50, 3–22.
Marucco, F., Pletscher, D.H., Boitani, L., Schwartz, M.K., Pilgrim,
K.L, and J.D. Lebreton (2009). Wolf survival and
popula-tion trend using non-invasive capture-recapture tech-niques in the Western Alps. J Appl Ecol. 46, 1003–1010.
Mech, L.D., and L. Boitani (2003). Wolf social ecology. In: Mech
LD, Boitani L (eds) Wolves: behaviour, ecology and con-servation. he university of Chicago Press, pp 1–34.
Miller, C., Joyce, P., and L. Waits (2002). Assessing allelic dropout and genotype reliability using maximum likelihood.
Ge-netics160, 357–366.
Moran, S., Turner, P.D., and C. O’Reilly (2008). Non-invasive
ge-netic identiication of small mammal species using real-time polymerase chain reaction. Mol Ecol. Res.8, 1267– 1269.
Morin, P.A., Chambers, K.E., Boesch, C., and L. Vigilant (2000).
Quantitative polymerase chain reaction analysis of DNA from noninvasive samples for accurate microsatellite genotyping of wild chimpanzees (Pan troglodytes versus). Mol Ecol. 10, 1835–1844.
Morin, P.A., and M. Mccathy (2007). Highly accurate SNP
geno-typing from historical and low-quality samples. Mol Ecol.
Notes7, 937–946.
Morin, P.A., Karen, K.M., and L.T. Barbara (2009). Assessing
sta-tistical power of SNPs for population structure and con-servation studies. Mol Ecol. Res9, 66–73.
Nilsson, M., Styrman, H., Andréasson, H., Divne, A-M., M. and
Allen (2006). Sensitive forensic analysis using the
Pyrose-quencing technology. International Congress Series1288, 625–627.
Oliveira, R., Godinho, R., Randi, E., Ferrand, N., and P.C. Alves
(2007). Molecular analysis of hybridisation between wild and domestic cats (Felis silvestris) in Portugal: implication for conservation. Conserv Genet. 9, 1–11.
Peakall, R., and P.E. Smouse (2006). genAlEx v. 6: genetic
analy-sis in Excel. Population genetic sotware for teaching and research. Mol Ecol Notes6, 288–295.
Poulle, M.L., Lequette, B., and T. Dahier (1999). he Alpine wolf
recolonization from 1992 to 1998. Mont Bull of the Nat Of
for Hunting242, 4–13 (in French).
Quintáns, B., Alvarez-Iglesias, V., Phillips, C., Lareu, M.V., and A.
Carracedo (2004). Typing of mitochondrial DNA coding
Randi, E., and V. Lucchini (2002). Detecting rare introgression of domestic dog genes into wild wolf (Canis lupus) popu-lations by Bayesian admixture analyzes of microsatellite variation. Conserv Genet.3, 31–45.
Randi, E., Lucchini, V., Christensen, M.F., Mucci, N., Funk, S.M.,
and G. Dolf (2000) .Mitochondrial DNA variability in
Ital-ian and East European wolves: detecting the consequences of small population size and hybridization. Conserv Biol.
14, 464–473.
Ryynänen, H.J., Tonteri, A., Vasemägi, A., and C.R. Primmer
(2007). A comparison of biallelic markers and microsat-ellites for the estimation of population and conservation genetic parameters in Atlantic Salmon (Salmo salar). J Hered. 7, 692–704.
Ronaghi, M., Uhlen, M., and P. Nyren (1998). A sequencing
method based on real-time pyrophosphate. Science281, 363–365.
Sanchez, J.J., and P. Endicott (2006). Developing multiplexed SNP
assays with special reference to degraded DNA templates. Nat Protoc. 3, 1370–1378.
Scandura, M., Iacolina, L., Capitani, C., Gazzola, A., Mattioli, L.,
and M. Apollonio (2011). Fine-scale genetic structure
sug-gests low levels of short-range gene low in a wolf popu-lation of the Italian Apennines. Eur J Wildlife Res DOI 10.1007/s10344-011-0509-y.
Seddon, J.M., Parker, H.G., Ostrander, E.A., and H. Ellegren
(2005). SNPs in ecological and conservation studies: a test in the Scandinavian wolf population. Mol Ecol. 14, 503–511.
Syvänen, A.C. (2001). Accessing genetic variation:
genotyp-ing sgenotyp-ingle nucleotide polymorphisms. Nat Rev Genet,2, 930–942.
Sobrino. B., Brión, M., and A. Carracedo (2005). SNPs in forensic
genetics: a review on SNP typing methodologies. Forensic
Sc In.154, 181–194.
Sutter, N.B., Eberle, M.A., Parker, H.G., Pullar, B.J., Kirkness, E.F., Kruglyak, L., and E.A. Ostrander (2004). Extensive and breed-speciic linkage disequilibrium in Canis familiaris.
Gen Res.14, 2388–2396.
Taberlet, P., Griin, S., Goossens, B., Questiau, S., Manceau, V.,
Escaravage, N., Waits, L.P., and J. Bouvet (1996). reliable
genotyping of samples with very low DNA quantities us-ing PCr. Nucleic Acids Res. 26, 3189–3194.
Taberlet, P., and G. Luikart (1999). Non-invasive genetic sam-pling and individual identiication. Biol J Linn Soc.68, 41–55.
Troell, K., Mattsson, J.G., Alderborn, A., and J. Höglund (2003).
Pyrosequencing analysis identiies discrete populations of
Haemonchus contortus from small ruminants. Int J
Para-sitol. 33, 765–771.
Tschentscher, F., Frey, U.H., and T. Bajanowski (2008). Amelo-genin sex determination by pyrosequencing of short PCr products. Int J Legal Med. 122, 333–335.
Valière, N. (2001). gimlet: a computer program for analysing
genetic individual identiication data. Mol Ecol Notes2, 377–379.
Valière, N., Fumagalli, L., Gielly, L., Miquel, C., Lequette, B., Poulle, M-L., Weber, J-M., Arlettaz, R., and P. Taberlet (2003), Long distance wolf recolonization of France and Switzerland inferred from noninvasive genetic sampling over a period of 10 years. Anim Conserv. 6, 83–92.
Verardi, A., Lucchini, V., and E. Randi (2006). Detecting
intro-gressive hybridization between free-ranging domestic dogs and wild wolves (Canis lupus) by admixture linkage disequilibrium analysis. Mol Ecol. 15, 2845–2855.
Vignal, A., Milan, D., San Cristobal, M., and A. Eggen (2002) A
review on SNP and other types of molecular markers and their use in animal genetics. Genet Sel Evol. 34, 275–305.
Vilà, C., Walker, C., Sundqvist, A-K., Flagstad, Ø., Andersone, Z.,
Casulli, A., Kojola, I., Valdmann, H., Halverson, J., and H.
Ellegren (2003). Combined use of maternal, paternal and
bi-parental genetic markers for the identiication of wolf-dog hybrids. Heredity90, 17–24.
Wang, J., Lin, M., Crenshaw, A., Hutchinson, A., Hicks, B., Yea-ger, M., Berndt, S., Huang, W-Y., Hayes, R.B., Chanock, S.J.,
Jones, R.C., and R. Ramakrishnan (2009). High-throughput
single nucleotide polymorphism genotyping using nano-luidic Dynamic Arrays. BMC Genomics10, 561–574.
Waits, L.P., Luikart, G., and P. Taberlet (2001). Estimating the probability of identity among genotypes in natural popu-lations: cautions and guidelines. Mol Ecol. 10, 249–256.
Waits, L.P., and D. Paetkau (2005). Noninvasive genetic sampling
tools for wildlife biologists: a review of applications and recommendations for accurate data collection. J Wildlife