breed
Anna Maria Guastella
1, Andrea Criscione
1, Donata Marletta
1, Antonio Zuccaro
1, Luigi Chies
2and Salvatore Bordonaro
11
Dipartimento di Scienze Agronomiche, Agrochimiche e delle Produzioni Animali,
Università degli Studi di Catania, Catania, Italy.
2
Dipartimento di Scienze e Tecnologie Agro-Forestali ed Ambientali,
Università degli Studi Mediterranea di Reggio Calabria, Reggio Calabria, Italy.
Abstract
Nero Siciliano is an autochthonous pig breed that is reared mainly in semi-extensive systems in northeastern Sicily. Despite its economic importance and well-appreciated meat products, this breed is currently endangered. Conse-quently, an analysis of intra-breed variability is a fundamental step in preserving this genetic resource and its breed-ing system. In this work, we used 25 microsatellite markers to examine the genetic composition of 147 unrelated Nero Siciliano pigs. The total number of alleles detected (249, 9.96 perlocus) and the expected heterozygosity (0.708) indicated that this breed had a high level of genetic variability. Bayesian cluster analysis showed that the most likely number of groups into which the sample could be partitioned was nine. Based on the proportion of each individuals genome derived from ancestry, pigs with at least 70% of their genome belonging to one cluster were as-signed to that cluster. The cluster size ranged from 7 to 17 (n = 108). Genetic variability in this sub-population was slightly lower than in the whole sample, genetic differentiation among clusters was moderate (FST0.125) and theFIS
value was 0.011. NeighborNet and correspondence analysis revealed two clusters as the most divergent. Molecular coancestry analysis confirmed the good within-breed variability and highlighted the clusters that retained the highest genetic diversity.
Key words:cluster analysis, coancestry, intra-breed genetic variation, microsatellites, Nero Siciliano pig breed.
Received: November 12, 2009; Accepted: May 14, 2010.
Introduction
In recent decades, many livestock breeds have experi-ence a severe loss of biodiversity that has markedly af-fected animal production systems, especially in marginal areas. Attempts to reverse this negative trend have led to re-search in the preservation and exploitation of local animal breeds, with efforts to identify and reintroduce potentially important genetic traits that have been overlooked by glob-alized production systems. Autochthonous breeds require careful molecular and morphological characterization that takes into account potential influences of the environment in which they were originally developed and adapted.
Nero Siciliano is an ancient black pig breed that origi-nated in Sicily and has always been reared in extensive and semi-extensive systems on this island. Currently, most of the farms that rear autochthonous black pigs (1800 pigs, 70% of the entire population for this breed) are located mainly in the mountainous area of Nebrodi in northeastern
Sicily. Black pigs are rustic animals that thrive on roughage and a limited food supply, in addition to being resistant to diseases in harsh conditions. This breed still retains its dis-tinctiveness thanks to the geographical and orographical characteristics of the island and breeding area, but runs a high risk of losing its original traits because of the lack of a suitable plan to safeguard and exploit its production.
Nero Siciliano pigs grow slowly and yield tasty meat and fat (Puglieseet al., 2003) used to produce high quality meat, including salami and cured ham that are very appreci-ated by local consumers. The creation of a Protected Desig-nation of Origin (PDO) label for Nero Siciliano meat and other related products has helped to safeguard and preserve this breed, and has led to an important increase (21%) in the number of farms and in sow rearing (24%) in the last three years. Despite this renewed interest of breeders and con-sumers, only 850 breeding sows are currently being reared and the Nero Siciliano breed is included in the list of endan-gered autochthonous breeds.
Genetic characterization is a fundamental prerequi-site for managing genetic resources. A recent
tric analysis of Nero Siciliano pigs involving 13 body measurements highlighted the low-medium size of this breed when compared with other Italian breeds (Guastella
et al., 2009). Genetic variability has also been assessed
based on the use of different genetic markers (Russoet al.,
2004; D’Alessandroet al., 2007; Davoliet al., 2008). In
particular, microsatellite markers have been particularly useful for quantifying genetic variation within and among several European pig breeds, including Nero Siciliano (SanCristobalet al., 2006).
The aim of this study was to use microsatellite mark-ers to assess the genetic variability and genetic structure of Nero Siciliano pigs reared in the Nebrodi mountains, in or-der to provide suitable data for conservation strategies.
Material and Methods
Sample collection and microsatellite analysis
A representative sample of 147 Nero Siciliano pigs (22 boars and 125 sows) was selected from 22 farms in 11 communes (Alcara Li Fusi, Brolo, Capizzi, Caronia, Flo-resta, Longi, Mirto, Sanfratello, San Salvatore di Fitalia, Raccuja and Tortorici) in the Nebrodi area; first- and sec-ond-degree relatives were avoided. The Nebrodi area is part of a natural Park (37°50’-38°9’ N; 14°26’-14°54’ E) lo-cated 100-1700 m above sea level, and is where the Nero Siciliano breed originated and is still extensively bred. The sample size ranged from 2 to 15 pigs per farm, depending on the herd size. Only pigs that met the morphological stan-dard for the breed were sampled, and digital photographs of each animal were taken. Farmers were also asked about the breeding strategies that they employed to select animals with an exclusively native Sicilian germplasm: farms in which there had been recent crossbreeding with commer-cial breeds were excluded from the sampling.
For each pig, 10 mL of peripheral blood was collected in K3-EDTA tubes. DNA was extracted from blood using the commercial Illustra blood genomic Prep Mini Spin kits (GE Healthcare, Little Chalfont, UK). Genetic character-ization was done with a set of 25 microsatellite markers (Table S1) chosen from a list maintained by the Pig Bio-diversity project and USDA MARC database. The markers were chosen based on preliminary data about their degree of heterozygosity and polymorphism obtained from small samples of Nero Siciliano and other local Italian pig popu-lations. Six PCR multiplex reactions and two single PCR reactions were done to amplify the microsatellites accord-ing to standard protocols. The amplicons (2 mL) were
mixed with 4mL of loading buffer containing formamide
and 350 TAMRA as an internal size standard (Applied Biosystems, Warrington, UK). Individual genotypes were determined with an ABI PRISM®377 sequencer equipped
with Genescan Analysis® v.3.1.2 and Genotyper® v. 2.5
softwares (Applied Biosystems, Foster City, CA, USA).
Statistical analysis
Individual multilocus genotypes were analyzed by Molkin v. 3.0 software (Gutierrezet al., 2005) to calculate the main parameters of genetic variability. For eachlocus
and group of pigs, the allele frequencies, private alleles (Ap), effective number of alleles (Ae), and observed (Ho)
and expected (He) heterozygosities were calculated.
Molec-ular coancestry coefficients and kinship distances (Dk)
weighted by polymorphic information content (PIC) were also assessed. In addition, the contribution of the different groups of pigs to the overall or total diversity was also in-ferred, according to Caballero and Toro (2002) and Petitet al.(1998).
Genepop v. 4.0 (Rousset, 2007) was used to perform the score test for Hardy-Weinberg equilibrium (Rousset and Raymond, 1995) perlocususing a Markov chain
algo-rithm implemented with 10,000 dememorizations, 200 ba-tches and 5000 iterations per batch. The presence of null alleles was tested with MICRO-CHECKER v. 2.2.3 (Van Oosterhoutet al., 2004), using Bonferroni adjustments.
FSTAT v.2.9.3 software (Goudet, 2001) was used to estimate theFIT,FSTandFISstatistics (Weir and
Cocker-ham, 1984) and their significance was inferred by methods based on randomisation. Multiple tests of significance were corrected by the sequential Bonferroni method (Rice, 1989).
The model-based approach proposed by Falushet al.
(2003) in the software STRUCTURE v.2.2 was used to as-sess the genomic clustering of the sample. Individual pigs were probabilistically assigned to two or more subpopu-lations on the basis of their multilocus genotype, assuming that they were admixed. As suggested by the authors, the admixture model associated with the option of correlated allele frequencies was used to infer the population struc-ture. The run length was set to 100,000 burn-ins followed by 100,000 iterations. This setting produced consistent esti-mations that were not significantly altered by a longer burn-in or Markov chain Monte Carlo (MCMC). The range of possible clusters (K) tested was from 1 to 15, and 10 runs
were done for eachK. CLUMPP software (Jakobsson and
Rosenberg, 2007) was subsequently used to find the opti-mal alignment of the 10 replicate cluster analyses of the sameK. The similarity coefficient G’, which is also a
mea-sure of the constancy over runs, was used to define the pop-ulation structure. The mean membership matrix across replicates was plotted with the program DISTRUCT (Ro-senberg, 2004). The method reported by Evanno et al.
(2005) was also used to estimate the most likely number of
Kthat explained the sample structure.
Reynolds’ pairwise distances (Reynoldset al., 1983),
judge the proximity of the clusters.
Results
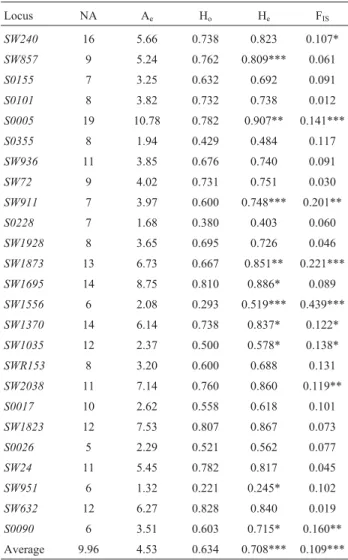
Nero Siciliano pigs showed high genetic variability (Table 1). Two hundred and forty-nine alleles were de-tected, with 5 (locus S0026) to 19 (locus S0005) alleles per locus and an average number per locus (9.96) that was
fairly high. The effective number of alleles (Ae), which
takes into account the expected heterozygosity (He),
showed thatS0005 was the most polymorphic locusand SW951the least polymorphic. The expected heterozygosity
was higher than that observed at eachlocus and ranged
from 0.245 to 0.907 (mean: 0.708). The estimated polymor-phic information content (PIC) ranged from 0.236 at
SW951to 0.901 atS0005(data not shown). Overall, Nero
alleles, inferred for five loci (S005, SW911, SW1873, SW1556,SW2038), could explain the excess of
homozy-gotes and the deviation from genetic equilibrium at these
loci. The heterozygote deficiency within populations (FIS)
was significant for nineloci. The overallFIScoefficient for
thelociwas 0.109, indicating a significant (p < 0.001)
ex-cess of homozygotes in the whole sample.
The level of population structuring was quite high. Model-based clustering of the microsatellite genotypes re-vealed that the likelihood variance of the observed data ini-tially increased by the predefined number of clusters to reach a peak value atK= 9 and then decreased. As indicated
by Pritchardet al.(2000), nine is the smallest value ofK
that captures the major structure in the dataset. Based on the method proposed by Evannoet al.(2005), two clear peaks
atK= 9 andK= 2 (the latter being particularly indicative of
a very low likelihood variance) were observed in theDK
distribution. The highest values of the similarity coefficient G’ (> 95%) were detected atK= 2,K= 7 andK= 9. Based
on these three approaches, we assumedK= 9 to be the most
likely number of clusters.
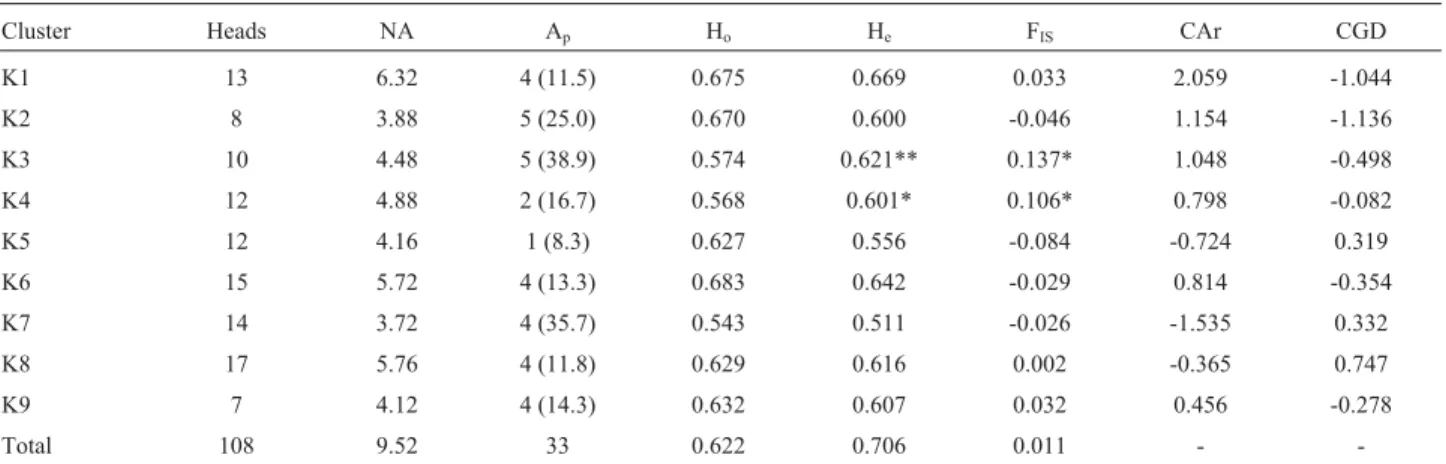
Based on the average matrix of membership (data not shown), animals with at least 70% of their genome belong-ing to one cluster were assigned to that cluster. The cluster size ranged from 7 to 17 (for a subsample of 108 of the orig-inal 147 pigs). Table 2 shows the genetic parameters of di-versity for the nine clusters and the subsample of 108 pigs. The average genetic differentiation among inferred clusters was moderate (FST0.125; p = 0.001). The genetic
variabil-ity of this subsample was still high with the overall FIS
value (0.011) not significantly different from zero, indicat-ing frequent random matindicat-ing. The observed and expected heterozygosities were slightly lower than in the whole sam-ple of 147 pigs.
Among the 22 farms sampled, nine were highly ho-mogenous, with > 70% of the genome belonging to a clus-ter. In contrast, animals from three farms that were particularly active in fattening pigs for meat production and pork products showed a wide genome distribution among clusters. Some clusters (K7,K5andK3) consisted of
indi-viduals from single farms, whereas two (K9andK4)
con-sisted of pigs from different herds reared in the same area. The rarefacted number of alleles (Ar), which mea-sures the contribution of alleles weighted by the sample size, ranged from 3.01 (K7) to 4.40 (K1). Thirty-three pri-vate alleles were detected in the model-inferred group of pigs. Each cluster was characterized by at least one unique allele: high frequencies were observed for allelesSW1695
(167 bp),SW1928(85 bp) andS0005(258 bp) inK3 (0.39),
K7 (0.36) andK2 (0.25), respectively.
NeighborNet built on Reynolds’ distances revealed a close linkage among most of the clusters:K7 andK2 were
Table 1- Number of observed (NA) and effective (Ae) alleles, observed
(Ho) and expected heterozygosity (He), and FISperlocus.
Locus NA Ae Ho He FIS
SW240 16 5.66 0.738 0.823 0.107*
SW857 9 5.24 0.762 0.809*** 0.061
S0155 7 3.25 0.632 0.692 0.091
S0101 8 3.82 0.732 0.738 0.012
S0005 19 10.78 0.782 0.907** 0.141***
S0355 8 1.94 0.429 0.484 0.117
SW936 11 3.85 0.676 0.740 0.091
SW72 9 4.02 0.731 0.751 0.030
SW911 7 3.97 0.600 0.748*** 0.201**
S0228 7 1.68 0.380 0.403 0.060
SW1928 8 3.65 0.695 0.726 0.046
SW1873 13 6.73 0.667 0.851** 0.221***
SW1695 14 8.75 0.810 0.886* 0.089
SW1556 6 2.08 0.293 0.519*** 0.439***
SW1370 14 6.14 0.738 0.837* 0.122*
SW1035 12 2.37 0.500 0.578* 0.138*
SWR153 8 3.20 0.600 0.688 0.131
SW2038 11 7.14 0.760 0.860 0.119**
S0017 10 2.62 0.558 0.618 0.101
SW1823 12 7.53 0.807 0.867 0.073
S0026 5 2.29 0.521 0.562 0.077
SW24 11 5.45 0.782 0.817 0.045
SW951 6 1.32 0.221 0.245* 0.102
SW632 12 6.27 0.828 0.840 0.019
S0090 6 3.51 0.603 0.715* 0.160**
Average 9.96 4.53 0.634 0.708*** 0.109***
Deviations from H-W equilibrium and significance of the FISvalues are
the most divergent in terms of average distance, with values of 0.190 and 0.182, respectively. The lowest pairwise dis-tance was betweenK6 andK8, and the highest betweenK7
andK5 (data not shown).
Correspondence analysis provided an alternative spa-tial representation of individuals and clusters scattered in the metric space (Figure 1). The first two axes contributed almost equally to the total inertia (16.84% and 15.96%, re-spectively). With regard to the dispersion in the first and second axes, S0017 (155 bp), SW1928 (85 bp), SW240
(122 bp) andS0017 (155 bp) were the most important
al-leles, each with a contribution > 5.7%.
The spatial dispersion of clusters and related individ-uals was determined mainly by four alleles that had very different frequencies among clusters, and by high fre-quency alleles detected exclusively in a given cluster. In
particular, alleleSW1928(85 bp), which was found only in K7 at a high frequency (35.7%), contributed significantly to
dispersion in the first and second axes (3.8% and 2.4%, re-spectively); an additional three alleles contributed more than 5% to dispersion in the first two axes and occurred at very high frequencies,i.e., 50% forSW240(122 bp) inK2,
56% for S0017 (155 bp) in K2 and 82% for SW1873
(136 bp) inK7.
Molecular coancestry in each cluster ranged from 0.287 inK1 to 0.389 inK7. Self-coancestry and the
inbreed-ing coefficient showed the same trend: the lowest values were detected inK6, the highest inK3. Kinship distances
ranged from 0.277 to 0.361. The contribution to the diver-sity of the whole sample is shown in Table 2. Cluster 2 con-tributed the most to the total genetic diversity (CGD) and
K8 the least, when assessed according to Caballero and
Table 2- Number of heads, average number of observed (NA) alleles perlocus, private alleles (Ap) with the highest allele frequency in parentheses,
ob-served (Ho) and expected (He) heterozygosities, and FISvalues per cluster and for the subsample of 108 pigs. The contribution of allelic richness (CAr) and
gene diversity (CGD) per cluster to the diversity of the subsample is also shown.
Cluster Heads NA Ap Ho He FIS CAr CGD
K1 13 6.32 4 (11.5) 0.675 0.669 0.033 2.059 -1.044
K2 8 3.88 5 (25.0) 0.670 0.600 -0.046 1.154 -1.136
K3 10 4.48 5 (38.9) 0.574 0.621** 0.137* 1.048 -0.498
K4 12 4.88 2 (16.7) 0.568 0.601* 0.106* 0.798 -0.082
K5 12 4.16 1 (8.3) 0.627 0.556 -0.084 -0.724 0.319
K6 15 5.72 4 (13.3) 0.683 0.642 -0.029 0.814 -0.354
K7 14 3.72 4 (35.7) 0.543 0.511 -0.026 -1.535 0.332
K8 17 5.76 4 (11.8) 0.629 0.616 0.002 -0.365 0.747
K9 7 4.12 4 (14.3) 0.632 0.607 0.032 0.456 -0.278
Total 108 9.52 33 0.622 0.706 0.011 -
al., 1998).
Discussion
Nero Siciliano pigs showed considerable genetic va-riability and diversity, expressed in terms of the number of alleles perlocus(NA) and expected heterozygosity (He):
the values for these parameters were higher than for several European breeds (NA = 4.5 on average, He= 0.43-0.68),
in-cluding Iberian breeds (NA = 3.44-5.86, He= 0.46-0.64)
(Martinez et al., 2000), seven native and commercial
breeds reared in Portugal (NA = 3.77-6.27, He= 0.49-0.69)
(Vicenteet al., 2008), and a population of Nero Siciliano
pigs (NA = 6.70, He= 0.67) studied by SanCristobalet al.
(2006). These values were also greater than those reported for Korean native pigs (NA = 3.44, He= 0.49) (Kimet al.,
2005), Cuban Criollo pigs (NA = 8.2, He= 0.65) (Martinez et al., 2005) and most Chinese breeds (NA = 6.25-11.55,
He= 0.57-0.77) (Liet al., 2004).
The number of effective alleles (4.53) was higher than in European breeds (2.74 on average) and Nero Sici-liano pigs (4.03) studied by SanCristobalet al.(2006) and
higher than or comparable to those reported for several Chi-nese breeds (1.69-5.62) (Liet al., 2004; Fanget al., 2005),
except for Lingao (4.76; Fanget al., 2005) and Nang Yang
Black, Sheng Xian Spotted and Hai Nan (5.12, 5.21 and 5.62, respectively) (Liet al., 2004). Conversely, the
num-ber of effective alleles and expected heterozygosity in Nero Siciliano pigs was lower than in the Indian Ankamali breed (Ae = 5.34, He= 0.83) (Behlet al., 2006).
The significant deviation from Hardy-Weinberg equilibrium observed at 10locimay reflect the presence of
null alleles at somelociand the Wahlund effect,i.e., a
re-duction in the observed heterozygosity that occurs in subdi-vided populations. Genetic substructures in Nero Siciliano pigs apparently resulted from different management strate-gies across herds and inbreeding within herds. In the Ne-brodi area, farmers use their own boars for a year or more, with only a limited exchange of animals among farms and herds. The within-group inbreeding values (FIS) support
this hypothesis (Table 2).
The unsupervised analysis of population structure de-tected nine homogenous groups in the sample analyzed and determined the corresponding fraction of the individual’s genome derived from ancestry in each cluster. ClusterK1
showed the highest variability in the number of alleles and heterozygosity, whereasK7 showed the least. These results
agreed with the values for molecular coancestry and were confirmed by analysis of the contribution to the total ge-netic diversity estimated from the allelic richness.
The negativeFISvalues detected in clustersK2 and K5, which represent two closed-cycle farms, probably
re-flected the proper selection of breed animals among the
breeding and processing herds probably helps to maintain a high level of diversity. Molecular data confirmed that these two farms had good mating management programs that en-sured high genetic variability.
Correspondence analysis provided a more interesting and informative spatial representation of the relationships among the nine clusters with respect to the network built on genetic distances. ClustersK2 andK7 represented the two
most distinct group of pigs and accounted for 14.2% and 12.7% of the inertia, respectively. Cluster 7 represented a single herd. The farm in question is interesting because it is the only one in the Nebrodi area in which the recessive mu-tation in the RYR1 (Ryanodine Receptor 1)locus
responsi-ble for the Porcine Stress Syndrome (PSS) has been reported (Matassinoet al., 2007); ten of the 14 pigs in this
cluster were carriers of this recessive allele. Despite their morphological traits and recent successful breeding his-tory, these pigs retain the traces of a possible accidental introgression of other commercial breeds. In addition, the low values for effective alleles and expected heterozygosity inK7 may reflect mating between closely related or inbred
animals. Cluster 2 also represented a single farm that was among the first to rationally manage the short chain cycle of breeding-processing-resale. The spatial distribution ofK2
pigs and the high contribution of this cluster to overall di-versity support the hypothesis that the present herd was de-rived from different genetic lineages that were incorporated to control the level of inbreeding.
Mitochondrial DNA haplotype analysis has shown that modern European pig breeds belong to a general Euro-pean cluster (Larsonet al., 2005). The populations are often
heavily structured and more than half of the European pig diversity can be assigned to local breeds (Ollivieret al.,
2005). The results described here indicate a high degree of genetic variability in Nero Siciliano pigs, as previously re-ported (SanCristobalet al., 2006; Davoliet al., 2007),
de-spite the limited population size of this breed. This is a rather frequent condition for populations reared in exten-sive systems where there is no systematic selection and planned mating. Part of the observed heterogeneity may have originated from accidental crosses with wild boars (Ollivieret al., 2005) and limited introgression with other
Italian breeds (Neapolitan and Casertana), as well as with Iberian breeds and commercial pigs (Russoet al., 2004).
stocks and planned matings as part of strategies to preserve and restore the rational breeding of black pigs. Boars be-longing to clusterK7need to be screened for the PSS
syn-drome gene and possibly excluded from selection programs in order to eliminate the PSS mutated gene and related PSE (pale, soft, exudative) defect from the population gene pool. Individuals belonging to different clusters could be used in planned matings to maintain a good level of genetic variability and rusticity (stress-resistance) and avoid exces-sive inbreeding. On the other hand, pigs sharing the same clusters and chosen based on their individual multilocus ge-notypes may be used in planned matings to preserve the most typical traits in this autochthonous population. Nero Siciliano pigs belonging to the most divergent cluster (K2)
and pigs not included in the most homogenous subpopu-lation of 108 animals need to be incorporated into selection schemes in order to counterbalance any increase in inbreed-ing. Such approaches should help to preserve the Nero Siciliano breed and ensure the production of high quality products for local and national markets.
Acknowledgments
The authors thank Drs. Vincenzo Di Marco, Vin-cenzo Pruiti and Giuseppe Spartà for technical assistance. This work was funded by Regione Sicilia Assessorato Agricoltura e Foreste Progetto “SUNEBRO”.
References
Behl R, Sheoran N, Behl J and Vijh RK (2006) Genetic analysis of Ankamali pigs of India using microsatellite markers and their comparison with other domesticated Indian pig types. J Anim Breed Genet 123:131-135.
Belkhir K, Borsa P, Chikhi L, Raufaste N and Bonhomme F (2004) GENETIX 4.05, Logiciel sous Windows TM pour la Génétique des Populations. Laboratoire Génome, Popula-tions, InteracPopula-tions, CNRS UMR 5171, Université de Mont-pellier II, MontMont-pellier.
Caballero A and Toro MA (2002) Analysis of genetic diversity for the management of conserved subdivided populations. Conserv Genet 3:289-299.
D’Alessandro E, Fontanesi L, Liotta L, Davoli R, Chiofalo V and Russo V (2007) Analysis of the MC1R gene in the Nero Siciliano pig breed and usefulness of this locus for breed traceability. Vet Res Commun 31 (Suppl. 1):389-392. Davoli R, Zambonelli P, San-Cristobal M, Scotti E, Fontanesi L,
Colombo M, Dall’Olio S, Braglia S and Russo V (2007) SNPs and microsatellite markers for genetic diversity study in Italian pig breeds. In: Nanni Costa L, Zambonelli P and Russo V (eds) Proceedings of the 6thInternational
Sympo-sium on the Mediterranean Pig. Università di Bologna, Capo d’Orlando, pp 46-53.
Evanno G, Regnaut S and Goudet J (2005) Detecting the number of clusters of individuals using the software STRUCTURE: A simulation study. Mol Ecol 14:2611-2620.
Falush D, Stephens M and Pritchard JK (2003) Inference of popu-lation structure: Extensions to linked loci and correlated al-lele frequencies. Genetics 164:1567-1587.
Fang M, Hu X, Jiang T, Braunschweig M, Hu L, Du Z, Feng J, Zhang Q, Wu C and Li N (2005) The phylogeny of Chinese indigenous pig breeds inferred from microsatellite markers. Anim Genet 36:7-13.
Guastella AM, Bordonaro S, Zuccaro A, Marletta D, Criscione A and D’Urso G (2009) Morphological and genetic character-ization of Nero Siciliano pig population reared in the Ne-brodi area. Ital J Anim Sci 8 (Suppl. 2):209.
Gutiérrez JP, Royo LJ, Álvarez I and Goyache F (2005) MolKin v. 2.0: A computer program for genetic analysis of populations using molecular coancestry information. J Hered 96:718-721.
Jakobsson M and Rosenberg NA (2007) CLUMPP: A cluster matching and permutation program for dealing with label switching and multimodality in analysis of population struc-ture. Bioinformatics 23:1801-1806.
Kim TH, Kim KS, Choi BH, Yoon DH, Jang GW, Lee KT, Chung HY, Lee HY, Park HY and Lee JW (2005) Genetic structure of pig breeds from Korea and China using microsatellite loci analysis. J Anim Sci 83:2255-2263.
Larson G, Dobney K, Albarella U, Fang M, Matisoo-Smith E, Robins J, Lowden S, Finlayson H, Brand T, Willerslev E,et al.(2005) Worldwide phylogeography of wild boar reveals
multiple centers of pig domestication. Science 307:1618-1621.
Li SJ, Yang SH, Zhao SH, Fan B, Yu M, Wang HS, Li MH, Liu B, Xiong TA and Li K (2004) Genetic diversity analyses of 10 indigenous Chinese pig populations based on 20 micro-satellites. J Anim Sci 82:368-374.
Martinez AM, Delgado JV, Rodero A and Vega-Pla JL (2000) Ge-netic structure of the Iberian pig breed using microsatellites. Anim Genet 31:295-301.
Martinez AM, Pèrez-Pineda E, Vega-Pla JL, Barba C, Velàzquez FJ and Delgado JV (2005) Genetic characterisation of the Cuban Creole pig with microsatellites. Arch Zootec 54:369-375.
Matassino D, Bordonaro S, Castellano N, Guastella AM, In-coronato C, Monaco F, Occidente M, Pane F and Barone CMA (2007) CRClocusscreening in some Italian pig
an-cient autochthonous genetic types (AAGTs). Preliminary re-sults. In: Nanni Costa L, Zambonelli P and Russo V (eds) Proceedings of the 6thInternational Symposium on the
Med-iterranean Pig. Università di Bologna, Capo d’Orlando, pp 68-72.
Ollivier L, Alderson L, Gandini GC, Foulley JL, Haley CS, Joosten R, Rattink AP, Harlizius B, Groenen MAM, Ami-gues Yet al.(2005) An assessment of European pig
diver-sity using molecular markers: Partitioning of diverdiver-sity among breeds. Conserv Genet 6:729-741.
Petit RJ, El Mousadik A and Pons O (1998) Identifying popula-tions for conservation on the basis of genetic markers. Con-serv Biol 12:844-855.
Pritchard JK, Stephens M and Donnely P (2000) Inference of pop-ulation structure using multilocus genotype data. Genetics 155:945-949.
43:223-225.
Rosenberg NA (2004) Distruct: A program for the graphical dis-play of population structure. Mol Ecol Notes 4:137-138. Rousset F (2007) Genepop’007: A complete re-implementation of
the GENEPOP software for Windows and Linux. Mol Ecol Notes 8:103-106.
Rousset F and Raymond M (1995) Testing heterozygote excess and deficiency. Genetics 140:1413-1419.
Russo V, Fontanesi L, Davoli R, Chiofalo L, Liotta L and Zumbo A (2004) Analysis of single nucleotide polymorphisms in major and candidate genes for production traits in Nero Siciliano pig breed. Ital J Anim Sci 3:19-29.
SanCristobal M, Chevalet C, Haley CS, Joosten R, Rattink AP, Harlizius B, Groenen MA, Amigues Y, Boscher MY, Rus-sell Get al.(2006) Genetic diversity within and between
Eu-ropean pig breeds using microsatellite markers. Anim Genet 37:189-198.
Van Oosterhout C, Hutchinson WF, Wills DPM and Shipley P (2004) MICRO-CHECKER: Software for identifying and correcting genotyping errors in microsatellite data. Mol Ecol Notes 4:535-538.
Vicente AA, Carolino MI, Sousa MCO, Ginja C, Silva FS, Marti-nez AM, Vega-Pla JL, Carolino N and Gama LT (2008) Ge-netic diversity in native and commercial breeds of pigs in Portugal assessed by microsatellites. J Anim Sci 86:2496-2507.
Felsenstein J (2005) PHYLIP (Phylogeny Inference Package), v. 3.6. Distributed by the author. Department of Genome Sci-ences, University of Washington, Seattle. Available from
http://evolution.genetics.washing-ton.edu/phylip/getme.html (December 3, 2009).
Goudet J (2001) FSTAT, a program to estimate and test gene di-versities and fixation indices (version 2.9.3). Available from http://www.unil.ch/izea/softwares/fstat.html (Decem-ber 3, 2009).
Pig Biodiversity Project, http://www.projects.roslin.ac.uk/ pigbiodiv/markers.html (December 3, 2009). USDA MARC database, http://www.genome.iastate.edu/
pigs/maps/marc.html (December 3, 2009).
Supplementary Material
The following material is available online for this ar-ticle:
Table S1 - Multiple (M) and single (S) PCR, locus name and chromosomal location, and primer sequences and dyes used in PCR
This material is available as part of the online article from http://www.scielo.br/gmb.
Associate Editor: Bertram Brenig
PCR Locus Chromosome Primer sequences (5’ - 3’) (Forward - F, Reverse - R)
Dye
S0005 5 F:TCCTTCCCTCCTGGTAACTA
R:GCACTTCCTGATTCTGGGTA
FAM
S0101 7 F:GAATGCAAAGAGTTCAGTGTAGG
R:GTCTCCCTCACACTTACCGCAG
TET
S0155 1 F:TGTTCTCTGTTTCTCCTCTGTTTG
R: AAAGTGGAAAGAGTCAATGGCTAT
FAM
M1 S0355 15 F:TCTGGCTCCTACACTCCTTCTTGATG
R: TTGGGTGGGTGCTGAAAAATAGGA
HEX
SW240 2 F: AGAAATTAGTGCCTCAAATTGG
R: AAACCATTAAGTCCCTAGCAAA
TET
SW857 14 F:TGAGAGGTCAGTTACAGAAGACC
R:GATCCTCCTCCAAATCCCAT
TET
SW72 3 F: ATCAGAACAGTGCGCCGT
R:TTTGAAAATGGGGTGTTTCC
TET
M2 SW936 15 F:TCTGGAGCTAGCATAAGTGCC
R:GTGCAAGTACACATGCAGGG
HEX
SW911 9 F:CTCAGTTCTTTGGGACTGAACC
R: CATCTGTGGAAAAAAAAAGCC
HEX
S0228 6 F:GGCATAGGCTGGCAGCAACA
R:AGCCCACCTCATCTTATCTACACT
HEX
SWR1928 7 F:TAGGGTCAGTGCATCCTTCC
R:ACGAGAACTCCGAACCCTG
FAM
M3 SW1873 7 F:TATAATCTGGTGAACCATCCCC
R:ATCAGATGTGCTAATACCCTGC
HEX
SW1695 2 F: ATAAGGGAAATCAGGCTGAGC
R:TCCCAGGAGCTACCATATGC
TET
SW1556 14 F: TCCCAGCACCTTGATTTTAG
R:AGGTTGCTGGAGATAGTGAAGC
HEX
SW1370 2 F: AGAGCAGTGGTCTGCTAAGATG
R: GAATTGCCTAAATTTACTTGTCC
HEX
M4 SW1035 16 F:TATGGGGGCCCTAAAAAGAC
R: AACGGCCTTAACCTCCTCAG
HEX
SWR 153 4 F: CCACGTTCTCCTTTTTGAGG
R:ATGAGTTGTGGTGTAGGTCGC
FAM
SW2038 14 F: GCCGAGAAACCCTTCACC
R: TAGCCTGTTCAGTGCCACC
TET
M5 S0017 8 F:CTAGGAGAAAATCTGAGGTT
R:GTTTGAATGGAGGTGCTGTA
FAM
SW1823 6 F: CAGGTCATTGCTGTAGTGAAGG
R: GAGCCTTGGGCTACGTAGTG
HEX
SW 951 10 F:TTTCACAACTCTGGCACCAG
R:GATCGTGCCCAAATGGAC
HEX
M6 SW 632 7 F:TGGGTTGAAAGATTTCCCAA
R:GGAGTCAGTACTTTGGCTTGA
TET
S0026 16 F:AACCTTCCCTTCCCAATCAC
R:CACAGACTGCTTTTTACTCC
HEX
S1 SW 24 17 F:CTTTGGGTGGAGTGTGTGC
R:ATCCAAATGCTGCAAGCG
FAM
S2 S0090 12 F:CCAAGACTGCCTTGTAGGTGAATA
R:GCTATCAAGTATTGTACCATTAGG
FAM