ABSTRACT:The objectives of this study were to identify the genetic variability and estimate the level of homozygosity in a castor bean F4 population using microsatellite markers (SSR). To this end, it was performed the genotyping of the population through 53 pairs of SSR primers. Allele frequencies were estimated by number of alleles per locus, expected heterozygosity (He), observed heterozygosity (Ho) and polymorphic information content (PIC). An array of genetic dissimilarity was generated by Nei and Li index, and hierarchical cluster analysis was performed using the Unweighted Pair-Group Method Averages(UPGMA) method. Polymorphism was detected in a total of eight loci (15.09%) of
PLANT BREEDING - Article
Genetic variability and homozygosity
in a F4 castor bean population by
microsatellite markers
Edna Lobo Machado*, Simone Alves Silva, Luciel dos Santos Fernandes, Helison Santos Brasileiro
Universidade Federal do Recôncavo da Bahia - Centro de Ciências Agrárias, Ambientais e Biológicas - Cruz das Almas (BA), Brazil.
*Corresponding author: [email protected]
Received:Nov. 8, 2015– Accepted:Dec. 29, 2015
the 53 evaluated, with the presence of two alleles per locus. Allele frequencies varied between 0.71 and 0.53, and the PIC, between 0.32 and 0.37. The average observed heterozygosity Ho (0.30) was lower than the expected heterozygosity He (0.47). Five dissimilar groups were formed, showing that there is genetic variability among the evaluated genotypes. The highest genetic dissimilarity was 0.708 and the lowest, 0.00. The percentages of homozygous genotypes varied from 25 to 75%. These results show that controlled selfing in castor bean raises the level of homozygosity, important for the breeding program.
Bragantia, Campinas, v. 75, n. 3, p.307-313, 2016
308
E.L. Machado et al.
INTRODUCTION
Genetic improvement of plants is a lengthy process that takes, on average, 12 years for annual species and 30 years for perennial species (Bespalhok et al. 1999). Therefore, the breeder should try to anticipate future needs. One of the challenges is to search for renewable energy sources. Given the above, several breeding programs have worked with species that can be used to produce alternative fuels such as ethanol (sugarcane) or biodiesel (rapeseed, sunflower and canola) (Bespalhok et al. 1999). The castor bean is an oleaginous of great social and economic importance in Brazil, especially for the Northeastern region, where the culture generates jobs and income for small and medium farmers (Freitas et al. 2010).
Ricinus communis L. is a monotypic species belonging
to the Euforbeaceae family and considered self-pollinated (Távora 1982) because of its reproductive system. However, due to the high rate of outcrossing, it is a better fit for the mixed or intermediate plants classification. Vencovsky et al. (2001) stated that a mixed population has a crossing rate between 5 and 95%; these values represent averages on population, not on the individual. Thus, castor bean is an interesting plant for breeding programs since it is easy to obtain crossings and controlled self-fertilization.
The fundamental condition to implement a breeding program is the existence of genetic variability. In the search for variability, crossings are made to maximize the genetic diversity of the population, and, once this variability is achieved in a segregating population, it is necessary to identify the superior homozygous genotypes obtained through selfing in advanced populations. Self-fertilization is the process that leads to more intense degree of inbreeding (Maia et al. 2008). It is easier to predict the behavior of the progenies in these populations since segregation of alleles in homozygous does not occur. Thus, the identification of variability and level of homozygosity achieved in the pairs of alleles in genotypes derived from an F4 population gives an indication of how many heterozygous loci are present in the study population and how many generations of self-fertilization are needed to achieve the expected homozygosity.
The detection of genetic variability and the level of homozygosity of an advanced population such as the F4 castor bean can be done using molecular markers.
Microsatellite (SSR) markers are informative due to their codominance, high degree of polymorphism, reproducibility and easy interpretation (Borém and Miranda 2009). It is important to point out that genetic variability studies and degree of homozygosity using SSR markers in an advanced castor bean population are still unprecedented. Given the above, the objectives of this study were to identify the genetic variability and estimate the level of homozygosity of an F4 castor bean population using SSR markers to monitor the species breeding.
MATERIAL AND METHODS
The F4 population with 32 individuals used resulted from the crossing between the BRS Nordestina and Sipeal 28 cultivars, followed by selfing. These cultivars were selected because they were different and suitable for the Northeastern region (Bahia et al. 2008).
The seeds of the genotypes were germinated in washed sand inside plastic basins. After 15 days, healthy leaves were collected for DNA extraction according to the protocol described by Doyle and Doyle (1990). The quantity and quality of DNA were evaluated by comparative analysis with known concentrations of lambda DNA (Invitrogen, Carlsbad, CA, USA) in 0.8% agarose gel, stained with ethidium bromide (0.5 mg∙mL–1).
The samples were diluted in Tris-EDTA to adjust concentration (5 ng∙μL–1).
A total of 53 pairs of SSR primers was used for the genotyping of the F4 population and the parents. Each amplification reaction was prepared in a final volume of 25 μL, which contained: 2.5 mmol∙L–1 10X buffer
(50 mmol∙L–1 Tris-HCl, 20 mmol∙L–1 KCl), 0.1 mmol∙L–1
dNTPs mix, 1.2 mmol∙L–1 MgCl
2, 0.4 mmol∙L
–1 of each
primer (Invitrogen, Carlsbad, CA, USA), 0.2 U Taq DNA polymerase (Life Technologies of Brazil Ltda., São Paulo, SP), 25 ng genomic DNA and ultra-pure water q.s.p.
for 10 min (Bajay et al. 2011). The amplified products were subjected to electrophoresis in 7% denaturing polyacrylamide gel, following the protocol proposed by Litt et al. (1993). The gel was stained with silver nitrate (Creste et al. 2001) and, after dried, was scanned (HP ScanJet N8460, Hewlett-Packard Company, Palo Alto, CA, USA). The amplitude of the fragments was estimated by comparison with a standard molecular weight of 50 bp (Invitrogen, São Paulo, SP), and the loci were characterized as either polymorphic or monomorphic due to the existence of different alleles between the genotypes.
Estimates of allele frequencies, number of alleles per locus, high allele frequency (HAF), expected heterozygosity (He), obser ved heterozygosity (Ho) and polymorphic information content (PIC) were obtained using the PowerMarker software version 3.25 (Liu and Muse 2005); the genetic dissimilarity matrix was obtained using the Nei and Li index (1973).
A hierarchical cluster analysis was performed using the Unweighted Pair-Group Method Averages (UPGMA) method (Sneath and Sokal 1973). The dendrogram was constructed using the MEGA 5 software (Tamura et al. 2011).
The level of homozygosity of the evaluated genotypes was estimated following the procedure adopted by Mendes et al. (2006):
Loco Sequence 5’-3’ Reason T a Fragment
amplitude HAF NA He Ho PIC
Rco2 F:CTAGCTTTGGGGCACAGTC
R:GGAAAATAGGTGCGTATGAAAC (AC)12 62 210-232 0.53 2 0.49 0.21 0.37
Rco11 F: GCGTGGACTAACTTCAAGCA
R: CCCCATTAGCATCGAGAAAG (TC)10(GT)6 60 240-250 0.71 2 0.40 0 0.32
Rco23 F: CATGGATGTAGAGGGTCGAT
R: CAGCCAAGCCAAAGATTTTC (GA)15(AG)8 62 300-320 0.53 2 0.49 0.11 0.37
Rco29 F: GAGAAAAGAAAGGGAGAAGG
R: GCCAAAAGCACACTTAATTTGA (GA)7 60 250-260 0.55 2 0.49 0 0.37
RcoM2 F:GATGTGAGCCCATTATGCTG
R:TCAGAAATACCTCTAGGCGACA (CT)14 64 185-192 0.55 2 0.49 0.46 0.37
RcoM11 F: AGGGGGATAAGCGTGATATG
R: CCGTTATGAAAAGGAAAGCA (CAA)6 63 252-268 0.53 2 0.49 0.8 0.37
RcoM27 F: CATGTTGTTTTTGGCAGCTC
R: CGTTCACACTCATCAATCCA (AG)20 63 287-294 0.57 2 0.48 0.84 0.36
RcoM28 F: CATGTTGTTTTTGGCAGCTC R: CGTTCACACTCATCAATCCA
(GAA)6 (AGA)5 (AAG)6
63 215-234 0.71 2 0.40 0.04 0.32
Mean 0.59 2 0.47 0.30 0.36
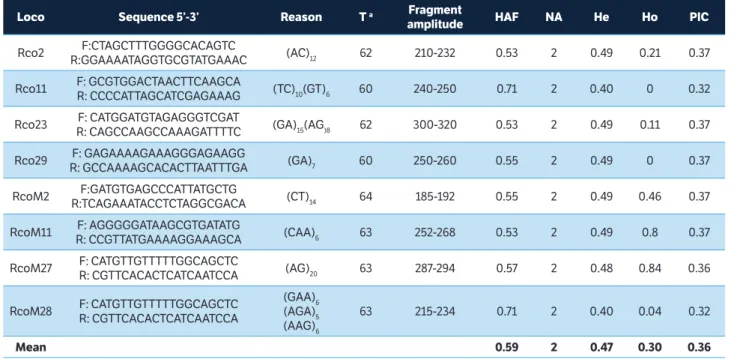
Table 1. Loci, SSR primer sequence, reason (microsatellite repeat), amplitude of fragments, high allele frequency, number of alleles per locus, expected heterozygosity, observed heterozygosity, polymorphic information content in eight polymorphic loci identified in a F4 Ricinus communis L.population, Cruz das Almas, Bahia, Brazil, 2015.
Ta = Optimal annealing temperature of the initiators; HAF = High allele frequency; NA = Number of alleles per locus; H
e = Expected heterozygosity; Ho = Observed
heterozygosity; PIC = polymorphic information content.
P = [(2m
− 1)/2m
]n
where: P is the proportion of completely-homozygous
genotypes; m represents the number of generations; n
is the number of alleles.
The chi-square test (χ2) at 5% was conducted to check the differences between the expected and observed values using the Genes software (Cruz e Carneiro 2003).
RESULTS AND DISCUSSION
Bragantia, Campinas, v. 75, n. 3, p.307-313, 2016
310
E.L. Machado et al.
polymorphism (31.13%) was detected in 24 castor bean samples collected in different countries (Qiu et al. 2010). These authors analyzed 379 EST-SSR loci.
Two alleles were identified for each SSR locus (Table 1). This result was expected because, in a segregating population that originated from the cross between two parental diploids, four alleles at most could be found. This population resulted from the crossing between two cultivars. In general, commercial cultivars have a high degree of homozygosity that resulted from the breeding process.
Bajay et al. (2009, 2011) identified, in 12 and 11 polymorphic SSR loci, two to five alleles per locus, for the 38 and 76 castor bean genotypes, respectively. The higher number of alleles found by the authors is explained by the fact that it was not a self-fertilization population, such as the castor bean F4 one analyzed in this study.
The highest allele amplitude was identified for Rco23 locus (300 – 320 bp) and the lowest, for RcoM2 (185 – 192 bp). The Rco11 and RcoM28 loci showed the greatest allelic frequencies (0.71) while the Rco2, Rco23 and RcoM11 loci, the lowest (0.53) (Table 1).
For the evaluated loci, the PIC ranged from 0.32 (Rco11 and RcoM28 loci) to 0.37 (Table 1). The highest PIC (0.37) was detected for most loci: Rco2, Rco23, Rco29, RcoM2 and RcoM11 (Table 1). Bajay et al. (2009) found PIC value for SSR markers in castor bean ranging from 0.1703 to 0.6597. This greater variation in PIC value can be explained by the greater number of genotypes evaluated by these authors.
The average PIC was 0.36. In general, the loci were moderately informative (Table 1). According to Botstein et al. (1980), PIC values are grouped into three levels: highly informative (PIC > 0.5); moderately informative (0.25 < PIC < 0.5) and little informative (PIC < 0.25). The PIC estimates the discriminatory power of the locus, taking into account not only the number of identified alleles but also their relative frequencies.
The average observed heterozygosity Ho (0.30) was lower than the expected heterozygosity He (0.47). This
result agrees with what is expected for a segregating F4 population, which characteristically has a higher homozygosity level with allele fixation. Low Ho values (0.416 and 0.0922) were also found by Bajay et al. (2009, 2011), respectively.
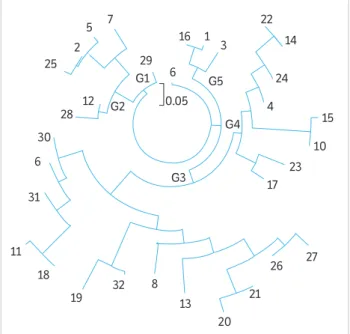
The dendrogram indicates the formation of five groups (Figure 2), showing the presence of genetic variability among the evaluated genotypes, an important trait in a breeding program since it allows selection. Group I consisted of a single genotype (29) and group V, of only three genotypes (16, 1 and 3). Group II was composed of genotypes 7, 5, 2, 25, 12 and 28. Group III was formed by the genotypes 30, 6, 31, 11, 18, 19, 32, 8, 13, 20, 21, 26 and 27. Finally, group IV was formed by genotypes 17, 23, 10, 15, 4, 24, 14 and 22.
The highest genetic dissimilarity (0.708) was observed between genotypes 11 × 25 and 11 × 3, and the lowest (0.00), between 1 × 16, 10 × 15, 11 × 18, 12 × 2, 12 × 29, 14 × 22, 16 × 2, 2 × 25, 2 × 29, 2 × 3, 2 × 5, 2 × 7, 2 × 9, 20 × 21, 22 × 26, 26 × 27 and 30 × 31 (Table 2).
Figure 1. Polymorphism of Rco23 locus in the F4 castor bean population detected by 7% polyacrylamide gel electrophoresis stained with silver nitrate. 50 bp molecular weight marker; 1 – 32 progenies.
Figure 2. Genetic relationships among the 32 genotypes of castor bean based on SSR markers generated by the UPGMA method.
22 14
24
4
15
10 23 17 G4 G5
3 1 16
6
0.05 29 7 5 2 25
12 28 30 6
31
11 18
19
32 8 13
20 21
26 27 G3
3
11
Br
agantia, C
ampina
s, v
. 7
5
, n. 3
, p
.3
0
7-3
13
, 2
01
6
C
a
st
or be
an br
eeding pr
ogr
am
1 0.000
10 0.125 0.000
11 0.500 0.500 0.000
12 0.250 0.125 0.417 0.000
13 0.286 0.500 0.500 0.417 0.000
14 0.125 0.250 0.250 0.450 0.375 0.000
15 0.292 0.000 0.250 0.450 0.375 0.250 0.000
16 0.000 0.250 0.250 0.125 0.167 0.083 0.500 0.000
17 0.250 0.125 0.550 0.150 0.350 0.375 0.250 0.500 0.000
18 0.550 0.500 0.000 0.300 0.400 0.313 0.313 0.250 0.625 0.000
19 0.583 0.625 0.417 0.250 0.250 0.650 0.550 0.500 0.250 0.300 0.000
2 0.083 0.125 0.750 0.000 0.417 0.500 0.625 0.000 0.083 0.625 0.333 0.000
20 0.464 0.625 0.458 0.375 0.250 0.417 0.250 0.667 0.300 0.350 0.208 0.333 0.000
21 0.400 0.625 0.350 0.450 0.150 0.125 0.125 0.500 0.313 0.350 0.250 0.500 0.000 0.000
22 0.125 0.250 0.250 0.450 0.375 0.000 0.250 0.083 0.375 0.313 0.650 0.500 0.357 0.100 0.000
23 0.250 0.125 0.375 0.208 0.464 0.333 0.417 0.083 0.100 0.450 0.375 0.333 0.688 0.583 0.429 0.000
24 0.071 0.125 0.417 0.333 0.357 0.042 0.208 0.083 0.150 0.500 0.583 0.333 0.464 0.250 0.042 0.179 0.000
25 0.250 0.125 0.708 0.208 0.321 0.500 0.250 0.417 0.100 0.650 0.375 0.000 0.214 0.300 0.500 0.429 0.321 0.000
26 0.313 0.625 0.313 0.500 0.063 0.000 0.083 0.125 0.417 0.313 0.313 0.500 0.063 0.063 0.000 0.500 0.250 0.250 0.000
27 0.357 0.625 0.417 0.417 0.214 0.375 0.125 0.417 0.250 0.450 0.250 0.417 0.107 0.100 0.375 0.464 0.357 0.179 0.000 0.000
28 0.250 0.125 0.375 0.042 0.464 0.333 0.583 0.083 0.300 0.250 0.375 0.000 0.563 0.583 0.429 0.250 0.321 0.429 0.500 0.607 0.000
29 0.214 0.125 0.417 0.000 0.357 0.375 0.542 0.083 0.150 0.300 0.250 0.000 0.406 0.375 0.321 0.281 0.286 0.321 0.500 0.500 0.156 0.000
3 0.107 0.125 0.708 0.208 0.179 0.333 0.417 0.083 0.100 0.650 0.375 0.000 0.357 0.300 0.333 0.286 0.179 0.143 0.250 0.321 0.286 0.179 0.000
30 0.250 0.250 0.100 0.200 0.417 0.208 0.375 0.083 0.188 0.125 0.300 0.500 0.464 0.250 0.179 0.179 0.167 0.542 0.333 0.417 0.321 0.143 0.375 0.000
31 0.357 0.625 0.083 0.333 0.357 0.208 0.375 0.083 0.350 0.100 0.250 0.667 0.406 0.208 0.179 0.281 0.286 0.607 0.250 0.357 0.406 0.250 0.464 0.000 0.000
32 0.357 0.625 0.250 0.167 0.214 0.375 0.542 0.083 0.350 0.100 0.083 0.333 0.406 0.375 0.464 0.281 0.429 0.464 0.250 0.357 0.156 0.250 0.321 0.286 0.250 0.000
4 0.107 0.125 0.292 0.208 0.393 0.083 0.250 0.083 0.150 0.350 0.458 0.333 0.438 0.250 0.071 0.188 0.036 0.357 0.313 0.393 0.313 0.156 0.214 0.036 0.156 0.406 0.000
5 0.286 0.125 0.583 0.083 0.357 0.542 0.292 0.417 0.100 0.500 0.250 0.000 0.344 0.458 0.607 0.281 0.357 0.036 0.313 0.214 0.281 0.313 0.179 0.500 0.563 0.313 0.406 0.000
6 0.250 0.625 0.125 0.375 0.250 0.083 0.250 0.083 0.350 0.150 0.292 0.667 0.313 0.083 0.071 0.313 0.179 0.500 0.063 0.250 0.438 0.281 0.357 0.036 0.031 0.281 0.125 0.531 0.000
7 0.286 0.125 0.417 0.083 0.500 0.375 0.292 0.417 0.300 0.300 0.417 0.000 0.250 0.350 0.375 0.464 0.357 0.179 0.313 0.357 0.179 0.214 0.321 0.417 0.500 0.357 0.321 0.143 0.464 0.000
8 0.321 0.625 0.250 0.417 0.250 0.250 0.167 0.167 0.300 0.300 0.250 0.667 0.250 0.125 0.214 0.313 0.250 0.357 0.063 0.107 0.563 0.344 0.357 0.107 0.094 0.344 0.188 0.406 0.063 0.464 0.000
Bragantia, Campinas, v. 75, n. 3, p.307-313, 2016
312
E.L. Machado et al.
These results show that controlled hybridization between the BRS Nordestina and Sipeal 28 cultivars generated genetic variability among progenies, favoring the castor bean breeding programs.
Table 3 shows the homozygosity analysis of 32 genotypes. The percentage of homozygosity among genotypes ranged between 25 and 75%, with emphasis on genotypes 13, 20, 23 and 28, which showed the highest value (75%), while genotypes 2, 10, 16 and 26 had the lowest value (25%). The analysis of homozygosity also resulted in the formation of five groups (Table 3).
According to Allard (1971) and Borém and Miranda (2009), the proportion of homozygous plants is a function of the number of allelic pairs and the number of selfing generations. Over five generations of selfing, in five separate/independent genes, 85% of the population genotypes are homozygous in all five loci. However, considering three generations of selfing in the F4 castor bean population, in which the ratio of homozygotes increases and of heterozygotes decreases, and eight loci are involved, it is expected that 34% of the genotypes are in complete homozygosity. Thus, the average value obtained for the homozygosity level of the genotype was high (52.7%), with quick setting of homozygous alleles and possible genetic gain from selection, considering another generation of selfing. The detection of heterozygous alleles with molecular markers is more sensitive than the assessment of the genetic constitution using phenotypic data. So, for the proportion of five independent loci, after three generations of selfing, 51% of the population genotypes would be expected to be in homozygosity in all eight loci (Allard 1971; Borém and Miranda 2009), thus corroborating the homozygosity value obtained in this work.
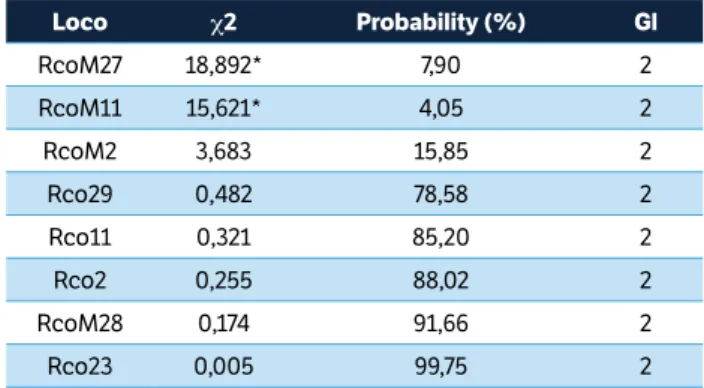
The c2 test to analyze the differences between the expected and observed homozygosity level for genotypes can be found in Table 4. In this case, the calculated values of the c2 test at 5% probability for RcoM27 (18.892) and RcoM11 (15.621) initiators were significantly different. The probabilities associated with these values are 7.90 and 4.05%, respectively. This indicates that some factor other than chance is responsible for the differences between the observed and expected values. The value calculated for the other initiators did not differ significantly by the c2 test at 5%. The highest probabilities were found for the primers Rco23 (99.75%) and RcoM28 (91.66%), indicating a high probability that the difference between observed and expected values happened by chance.
The analysis of genotypes of F4 castor bean population using SSR markers showed that most of the alleles are
Genotypes Homozygosity
(%) Genotypes
Homozygosity (%)
2 25.0 24 50.0
10 25.0 27 50.0
16 25.0 30 50.0
26 25.0 3 62.5
12 37.5 5 62.5
17 37.5 11 62.5
1 50.0 19 62.5
4 50.0 22 62.5
6 50.0 25 62.5
7 50.0 29 62.5
8 50.0 31 62.5
9 50.0 32 62.5
14 50.0 13 75.0
15 50.0 20 75.0
18 50.0 23 75.0
22 50.0 28 75.0
Mean 52.7
Table 3. Percentage of homozygous genotypes of the F4 castor bean population from microsatellite markers.
Loco c2 Probability (%) Gl
RcoM27 18,892* 7,90 2
RcoM11 15,621* 4,05 2
RcoM2 3,683 15,85 2
Rco29 0,482 78,58 2
Rco11 0,321 85,20 2
Rco2 0,255 88,02 2
RcoM28 0,174 91,66 2
Rco23 0,005 99,75 2
Table 4. c2 test for the SSR loci in the F4 castor bean population
that originated from the crossing between the BRS Nordestina and Sipeal 28 cultivars.
*Significantly different. DoF = Degrees of freedom
homozygous, suggesting a strong inbreeding, which may have resulted from selfing processes. These studies demonstrate the efficiency of using self-fecundation in a population to achieve high level of homozygosity, important for the breeding programs of castor bean.
CONCLUSION
Allard, R. W. (1971). Princípios do melhoramento genético das plantas.
São Paulo: Edgard Blüchner.
Bahia, H. F., Silva. S. A., Fernandez, L. G., Ledo, C. A. S. and Moreira, R. F.
C. (2008). Divergência genética entre cinco cultivares de mamoneira.
Pesquisa Agropecuária Brasileira, 43, 357-362. http://dx.doi.org/10.1590/
S0100-204X2008000300010.
Bajay, M. M., Zucchi, M. I., Kiihl, T. A. M., Batista, C. E. A, Monteiro, M.
and Pinheiro, J. B. (2011). Development of a novel set of microsatellite
markers for castor bean, Ricinus communis (Euphorbiaceae). American
Journal of Botany, 98, e87-e89. http://dx.doi.org/10.3732/ajb.1000395.
Bajay, M. M., Pinheiro, J. P., Batista, C. E. A., Nóbrega, M. B. M. and
Zucchi, M. I. (2009). Development and characterization of microsatellite
markers for castor (Ricinus communis L.), an important oleaginous
species for biodiesel production. Conservation Genetics Resources,
1, 237-239. http://dx.doi.org/10.1007/s12686-009-9058-z.
Bespalhok, F. J. C., Guerra, E .P. and Oliveira, R. (1999) Introdução ao
melhoramento de plantas. In F. J. C. Bespalhok, E. P. Guerra and R.
Oliveira. Melhoramento de plantas (p. 1-9). Curitiba: Editora da UFP.
Borém, A. and Miranda, G. V. (2009). Melhoramento de Palntas. Viçosa:
Editora da UFV.
Botstein, D., White, R. L., Skolnick, M. and Davis, R. W. (1980). Construction
of a genetic linkage map in man using restriction fragment length
polymorphisms. The American Journal of Human Genetics, 32, 314-331.
Creste S., Tulmann, Neto A. and Figueira, A. (2001). Detection of
single sequence repeat polymorphisms in denaturing polyacrylamide
sequencing gels by silver staining. Plant Molecular Biology Reporter,
19, 299-306. http://dx.doi.org/10.1007/BF02772828.
Cruz, C. D. and Carneiro, P. C. S. (2003). Modelos biométricos aplicados
ao melhoramento genético. Viçosa: Editora da UFV.
Doyle, J. J. and Doyle, J. L. (1990). Isolation of plant DNA from fresh
tissue. Focus, 12, 13-15.
Freitas, J. B., Pereira, A. W. R. and Menezes, E. R. (2010). Cultivo da
mamona para biodiesel no Nordeste do Brasil é viável ou não? In
Anais do VII SEGeT – Simpósio de Excelência em Gestão e Tecnologia.
Resende, Brazil.
REFERENCES
Litt M., Hauge X. and Sharma V. (1993). Shadow bands seen when
typing polymorphic dinucleotide repeats: some causes and cures.
BioTechniques, 15, 280-284.
Liu, K. and Muse, S. V. (2005). PowerMarker: an integrated analysis
environment for genetic marker analysis. Bioinformatics, 21, 2128-2129.
http://dx.doi.org/10.1093/bioinformatics/bti282.
Maia, M. C., Assis, G. M. L. and Rocha, M. M. (2008). O fenômeno da
endogamia em plantas. Rio Branco: Agrosoft Brasil.
Mendes, A. N. G., Bueno, L. C. S. and Carvalho, S. P. (2006). Melhoramento
genético de plantas — princípios e procedimentos. 2. ed. Lavras:
Editora UFLA.
Nei, M. and Li, W. H. (1973). Linkage disequilibrium in subdivided
populations. Genetics, 75, 213-219.
Pranavi, B., Sitaram, G., Yamini, K. N. and Dinesh, K. V. (2011). Development
of EST-SSR markers in castor bean (Ricinus communis L.) and their
utilization for genetic purity testing of hybrids. Genome, 54, 684-691.
http://dx.doi.org/10.1139/G11-033.
Qiu, L., Yang, C., Tian, B., Yang J. and Liu A. (2010). Exploiting EST
databases for the development and characterization of EST-SSR
markers in castor bean (Ricinus communis L.). BMC Plant Biology, 10,
278. http://dx.doi.org/10.1186/1471-2229-10-278.
Sneath, P. H. A. and Sokal, R. R. (1973). Numerical taxonomy — the
principles and practice of numerical classification. San Francisco:
W. H. Freeman.
Tamura, K., Peterson, D., Peterson, N., Stecher, G., Nei, M. and Kumar,
S. (2011). MEGA5: Molecular Evolutionary Genetics Analysis using
Maximum Likelihood, Evolutionary Distance, and Maximum Parsimony
Methods. Molecular Biology and Evolution, 28, 2731-2739. http://dx.doi.
org/10.1093/molbev/msr121.
Távora, F. J. A. (1982). A cultura da mamona. Fortaleza: EPACE.
Vencovsky, R., Pereira, M.B., Crisóstomo, J.R. and Ferreira, M.A.J. (2001).
Genética e melhoramento de populações mistas. In L.L. Nass, A. C.
C. Valois, I. S. Melo and Valadaresinglis, M.C. Recursos genéticos e
melhoramento de plantas (p. 231-281). Rondonópolis: Fundação MT. of selfing, with the possibility of obtaining in the next
generation of genotypic selfing a good degree of stability