* Corresponding author.
E-mail addresses: [email protected] (A. Mehdiabadi) © 2012 Growing Science Ltd. All rights reserved. doi: 10.5267/j.msl.2012.03.005
Contents lists available atGrowingScience
Management Science Letters
homepage: www.GrowingScience.com/msl
An empirical study for measuring the success index of banking industry
Mosayeb Karamia, Amir Mehdiabadib*, Ali Shahabic and Mohsen Mardanid
a
Industrial Management of M.A student at Islamic Azad University, Expert credit of Tose`eTa`avon Bank, Semnan, Iran
b
Member of Young Researchers Club, MA of Islamic Azad University, Semnan
c
Member of Young Researchers Club, MA of Islamic Azad University, Semnan, Iran
d
Member of Young Researchers Club, Industrial Management of MA at Islamic Azad University, Semnan, Iran
A R T I C L E I N F O A B S T R A C T
Article history: Received October 1, 2011 Received in Revised form November, 14, 2011 Accepted 15 February 2012 Available online 5 March 2012
Measuring organization performance plays an important role for developing better strategic plans. In today's competitive environment, organizations attempt for the product quality or offering the service, delivery, reliability capability and the customer satisfaction. These properties are not measurable only by traditional financial criteria and we need a method, which could consider non-financial factors as well. The present study of this paper proposed a hybrid of balanced score card (BSC) and data envelopment analysis (DEA) method for an empirical study of banking sector. The study proposes a model for assessing the Tose`eTa`avon bank performance, which is an example of governmental credit and financial services institutes. The study determines different important factors associated with each four components of BSC and uses analytical hierarchy process to rank the measures. In each part of BSC implementation, we use DEA for ranking different units of bank and efficient and inefficient units are determined.
© 2012 Growing Science Ltd. All rights reserved.
Keywords:
BSC
Function assessment Measurement index Efficiency AHP
1. Introduction
including the Tose`eTa`avon Bank, comparing to their competitors at the private section, is that income of most of state section organizations is supplied by the state and should be responsible against the numerous beneficially. So, measuring the function at the state section is partly considered impossible (Boland & Fowler, 2000). From the most important bank challenges, which have been caused to perform this research, included: lack of a scientific and clear definition from activates' limit and purposes, business model and trade banking, extent banking and cooperative banking work method and their different and distinction from one another which is accepted at the bank managers level, generally and overly, not being exactly identified the duties description and persons position and functional strategies extent including the resource attraction strategy extent and target markets determining, human resources management strategy extent. In fact, defined Tose`eTa`avon Bank processes should be mostly driven toward their principle strategies. The most important principle dimension of this research is to assess the bank strategy into four principle dimensions and the present research is an attempt for assessing the Tose`eTa`avon Bank functions. One bank has been constituted from two parts, line and staff, BSC method can measure general organization function with strategic view, but it is difficult for measuring the function of bank line parts. Therefore, a hybrid algorithm from BSC and DEA model is presented to offer the successful financial and credit organizations assessment indexes.
2. Background and theoretical research frame
Assessing the function is one of the principle duties of each organization and one of the function management faces has been mostly executed by applying the financial indexes. It is clear that the managers need a tool at this situation to determine their positions relative to the competitors and environment and provide the necessary preparations for reaching the next purpose. Innovation and quality management, increase the prominent activities for all kinds of organizations, and usually work with competitive advantage acquisition. Function measuring can be defined as a system, by which organization control and assess its routine functions, that whether organization achieves, to its purposes or not (Wu et al., 2009). Overall, five cases from traditional function measurement limitations have been identified, which are as follow,
1. Traditional function measurements have been based on traditional cost management systems.
2. Traditional function measurements use the retrograde measurements.
3. Traditional function measurements do not participate at strategy and dismounting the strategy
by them is difficult, in practice.
4. Traditional function measurements contradict the continued improvement accepted thought.
5. Traditional function measurements do not consider the customer needs.
2.1. Balance Scorecard (BSC)
function, and concluded that by executing the strategic plan, financial function is significantly improved. Wu et al. (2011) compared the results of dismounting BSC at three banks and by using the fuzzy decision-making methods, attempted to prioritize them. Wu et al. (2011) attempted to assess the function by using BSC at high training centers at universities. They performed their research at three universities in Taiwan and by using DEMATEL technique and attempted to examine causal relationship among indexes. Teresa et al. (2009) studied the perspectives of the BSC for R&D by means of DEA for assessing R&D extent and research projects. In other research, by using a compound of two models of BSC and DEA, Eilat et al. (2006) presented a model for assessing an industrial researches laboratory. At this model, assessing R&D projects has been attempted (Eilat et al., 2008).
2.2. Data envelopment analysis (DEA) model
DEA is a non-parametric assessment method to measure relative efficiency of decision-maker units (DMUs) based on a linear programming model. Charnes et al. (1978) introduced this technique for the first time. There are two versions of DEA, which are constant outputs (CRS) and variable output
(VRS). Let be the vector of input for decision making unit (DMU) and be the vector of
output. A simple VRS model is as follows,
subject to
, , … . . ,
, , … . . ,
, , … … ,
E free in sign
[[where is the weight of unit to dominate unit 0 and be the efficiency of unit 0. There are different
studies, which uses the hybrid methods of DEA and BSC (Guo et al., 2006). Examples of this research area include facilities location designing at production systems (Yang & Kuo, 2003; Ertay et al., 2006), warehouse operator selection (Korpela et al., 2007), improving and optimizing the railroad system (Azadeh et al., 2007) and assessing the bridges risk (Wang et al., 2007). Chen and Chen (2007) applied DEA with BSC for assessing semi-conductive industries function and used analytical hierarchy process (AHP) for weighting four-perspectives BSC indexes. Banwet and Deshmutk (2008) attempted to assess the extent and research organizations function, by compounding DEA-AHP technique. Kang and Lee (2010) presented a new function assessment model from the supplier at the cumulative orbits pack aging firms, by compounding AHP-DEA technique. Konstantina et al. (2010) attempted to analysis, by compounding DEA-AHP and DEA-ANP inside quality function development (QFD).
3. Research Methodology
The proposed study of this paper attempts to develop a method for designing an applied function assessment system for continues improvement of the internal processes. The method also accelerates a state bank feedback to the operational layers and their branches. It also enhances the profitability and dimensional recognition from the prospective, which requires a review on the process re-engineering and definitions.
3.1. Society and Research Sample
3.2. Executive Research Stages
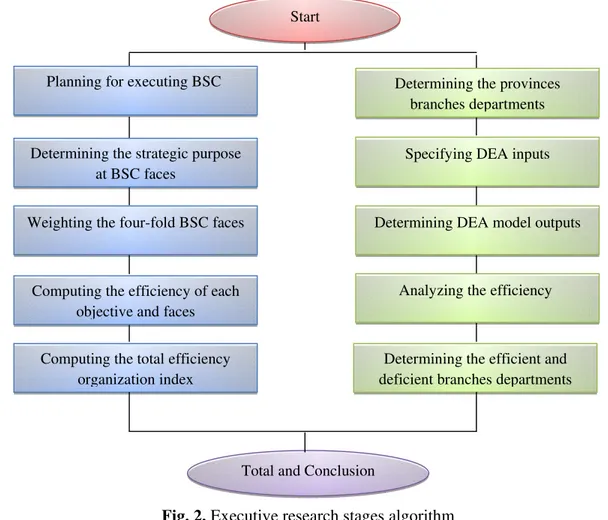
Performance methodology of this research was initially proposed by Kaplan and Norton and the model presented by Niven (2002). In addition, DEA model is divided into two principle phases, which are as follows,
- Phase of dismounting BSC model for assessing the organization function
1- BSC design and implementation,
2- BSC strategic determination,
3- BSC components weight specification,
4- DEA implementation for efficiency estimation,
5- Efficiency estimation for the whole organization.
- Phase of dismounting DEA model for determining the bank line efficient and deficient units
1- Branch and departments identification,
2- Inputs:
- Number of personnel, which includes number of men and women employed at each of the
branches departments,
- Total saving left at the end of the year for each branch department,
- Cost of each branch including: personnel costs, official costs, paid commission and profit,
3- Output:
- Delayed calls left at the end of year for each of branch department,
- Income of each of branch department,
4- Analysis the efficiency of each branch department by DEA-MASTER software,
5- Analysis the inefficient branch departments of the country.
Finally, results comparison attained and results analysis have been taken action. Executive research stages have been summarized into Fig.2.
4. Data Analysis
4.1. Phase of dismounting BSC model for assessing the organization function
4.1.1. Planning for executing BSC
At this stage, after attaining the executive support, among the senior managers, a team, which constitutes of the elite experts from affaires of credit, marketing and equipping the financial resources, planning and branch affaire, is formed. Then, BSC teams have attempted to compile the project plan and to extend a relationship establishment design at Tose`eTa`avon Bank.
4.1.2. Determining strategic objectives at BSC faces
measurements associated with each strategic objective are collected and among them, measurements, which were proper and organizational units associated with the measurement are selected. Table 1 shows details of our indexes.
Fig. 2. Executive research stages algorithm
Table1
Macro objectives and measurement determined at Tose`eTa`avon Bank
BSC face Macro objectives Measurement index Related organizational unit
Financial
Profit improvement
Assets output
Credit financial branches affaires
Net difference of paid and received Capital output
Net profitability ratio attained profit rate difference
Output rate of divided incomes
Cost reduction Finished money cost Financial
Growth and learning face
Training programs Workers education level
Human resources Held training hours
Bonus cost amount paid to workers Financial New technology
adaptations
Budget spent for extending IT financial
Internal processes
Equipping financial resources
Attracting deposit Equipping resources
Delayed claims reduction
Delayed claims collecting amount Legal
Increasing efficient forces
Attracting key and efficient forces Human resources
Customer face
Increasing customer satisfaction
Time of handling credit cases(customer satisfaction)
Credit
Acquiring more share from market
Loyal customer Equipping resourcing
Start
Planning for executing BSC
Determining the strategic purpose at BSC faces
Weighting the four-fold BSC faces Determining DEA model outputs Specifying DEA inputs Determining the provinces
branches departments
Computing the efficiency of each objective and faces
Computing the total efficiency organization index
Determining the efficient and deficient branches departments
Analyzing the efficiency
4.1.3. Determining the relative weight of BSC faces, by using AHP at Tose`eTa`avon Bank
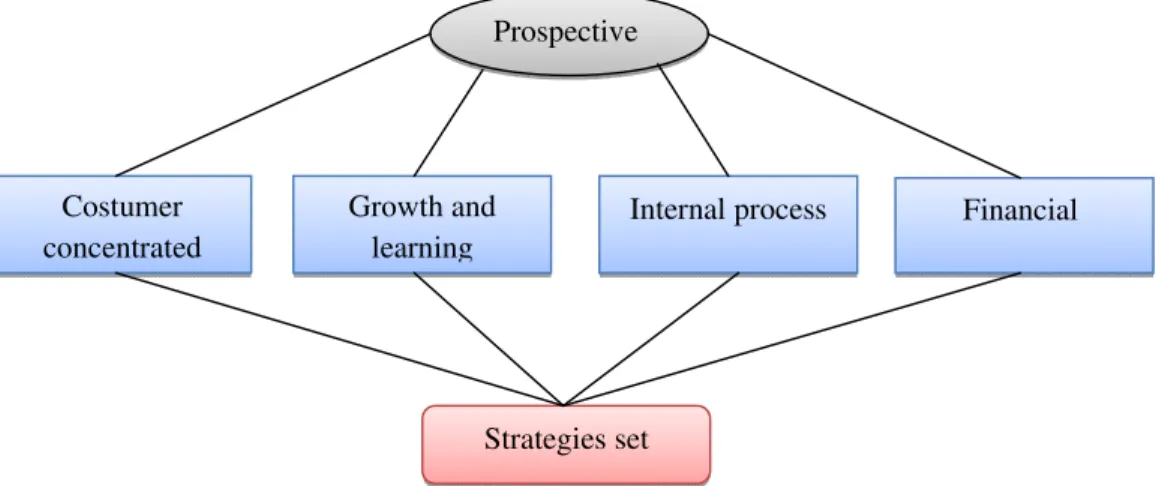
AHP is considered as of one of the most efficient decision-making techniques proposed by Thomas. L. Saaty, in 1980, for first time, which is based on pair-wise comparisons of various alternatives. The propose model of this paper uses AHP to rank four components of BSC. Fig. 3 shows details of our implementation and Table 2 shows details of our ranking for all four BSC aspects.
Fig. 3. Total design of strategies set hierarchy
Table 2
Result of double comparisons matrix of BSC faces indexes from elite's points of view
BSC face Measuring index Weight attained from AHP
Financial
Assets output 0.1817
Net difference of paid and received 0.1567
Capital output 0.1667
Net profitability ratio attained profit rate difference 0.0875
Output rate of divided incomes 0.0675
Finished money cost 0.34
Growth and learning face
Workers education level 0.2575
Held training hours 0.275
Bonus cost amount paid to workers 0.1191
Budget spent for extending IT 0.3484
Internal processes
Attracting deposit 0.3483
Delayed claims collecting amount 0.342
Attracting key and efficient forces 0.3097
Customer face
Time of handling credit cases(customer satisfaction) 0.5225
Loyal customer 0.4775
4.1.4. Computing the efficiency of each BSC faces and objectives
When we set quantitative objectives, we should be careful to use proper resources specially in
banking industry. Let be the true amount of index , be the percent of amount of achieving index
to target amount and be the ideal amount of index , therefore in order to achieve the idea level
we have, . Let be total efficiency of face , be the weight of index in at face , and
be the amount of achieving index at face . Therefore, ∑ . is total efficiency index
for each face.
Prospective
Costumer concentrated
Financial Internal process
Growth and learning
4.1.4.1 Financial face
Financial issues include an appropriate increase in income, improving profitability, decreasing cost, increasing asset return, which are the base of organization processes and strategies. This face has two faces. From one side, it should be an indicator of expected financial function and from other side it is used from three other ends.
Decreasing the finished money cost
This objective has been adopted along management and decreasing the cost for improving the long-term financial objective of bank as a credit and financial institute. According to the talks performed with organization manager and team sessions, this objective has been established for competition the price relative to other competitors. This objective can be measured with indexes such as cost of each unit money per scale with competitors. As defined, finish cost is all costs which the economic institute undertakes for producing the end product. For computing the finish money cost at bank system, one can computes direct and indirect finished money price cost: at Tose`eTa`avon Bank, for each 100 Rials attracted resources, 4.2 percent, direct cost is undertaken, so, we will have
. %(direct money cost)
Indirect money cost
As known, bank for attracting the resources, undertakes other costs including departmental, personnel, amortization and doubtful received claims cost, so, accounting the cost mentioned for accessing to finished money cost is necessary. Total branches cost amount is divided into free resources sum inserted, so we will have:
9 0.065 Indirect branches-money costs
= 0.026 indirect staff-money cost
Finished money cost (without accounting the doubtful-received claims cost) = =13.7
Finished money cost at Tose`eTa`avon Bank according to above statistic data and computations performed for each 100 Rialsresource is 13.7 Rials.
Indirect money-amortization and doubtful-received claims costs
. 0.065
Finished money cost= = 20.2
According to above computations, finished money cost at Tose`eTa`avon Bank is 20.2 %, while the facilities awarded are mainly paid with 12% rate.
Profitability indexes
One of proportions which are used at bank is ROA proportion. This and also other proportions as ROI, profitability net proportions and etc. are considered as profitability proportions. These proportions indicate the bank ability at using and applying all resources that are available. Profitability indexes have an important role at assessing the economic institutes function. By invoking to year-end balance, proportions mentioned are as follow:
- ROA=0.003
- Net profitability proportion attained from profit rates differences = 4.8%
- Undivided incomes output rate (commission +depositing before banks) = 3.2%
- Undivided income output rate (commission) = 1%
- Net paid and received profit difference = 4.4%
Comparing the financial indexes result to average universal rate and ideal mode
Table3 reflects indexes, macro objectives, aspects weights and also the financial aspect efficiency score.
Table 3
Computing the financial face efficiency
Macro objectives Measurement index Index weight True amount Ideal amount Percent of amount of achieving to
target
Total efficiency
Decreasing the costs
Finished money cost 0.34 20.2 12 0.59 20.2%
52.65% Increasing the
organization profit
Assets output 0.181 0.003 1 0.003 0.05%
Net paid and received
profit difference 0.1567 1 15 0.07 1.04%
Capital output 0.1667 4.8 5 0.96 16%
Net profitability proportion arise from
net profit difference 0.0875 1 1 1.00 8.75%
Undivided incomes
output rate 0.0675 4.4 4.5 0.98 6.60%
4.1.4.2. Internal processes face
Internal processes play important role at organization function. From one side, they cause to meet the customers' needs and offer the customers attraction and maintain approaches and from other side, move along organization financial objectives to meet the beneficiary expectations.
Deposit attraction plan
By considering the bank capacity at attracting public and state deposits, bank attempts to achieve to 1% share of the country's bank system deposits. Bank resources and deposit attraction plan have been complied at provinces separately and for achieving to deposit attraction objectives, bank target market has been also examined and identified.
Delayed-received and delayed claims receiving plan
Delayed claims receivable was about 660 billiard Rials, which indicated 37% increased compared with the previous year. Table 4, reflects indexes, macro objectives, aspects weights and also internal processes aspect efficiency score, in the year.
Efficient human force attraction plan
Tose`eTa`avon Bank for supplying its own needed human force requires attracting 695 people, human force with university education by employment exam.
4.1.4.3. Customer face
Table 4
The results of the internal processes efficiency
Macro objectives Measurement index Index weight True amount Ideal amount Percent of amount of achieving to target Total efficiency Equipping the financial resources Attracting the
deposit 0.3483 6645000 18000000 0.37 12.86%
45.37% Decreasing the delayed claims Amount of receiving the delayed claims
0.342 660000 1310000 0.504 17.23%
Increasing the efficient
forces
Attracting the key and efficient
forces
0.3097 343 695 0.494 15.28%
Increasing the customer satisfaction
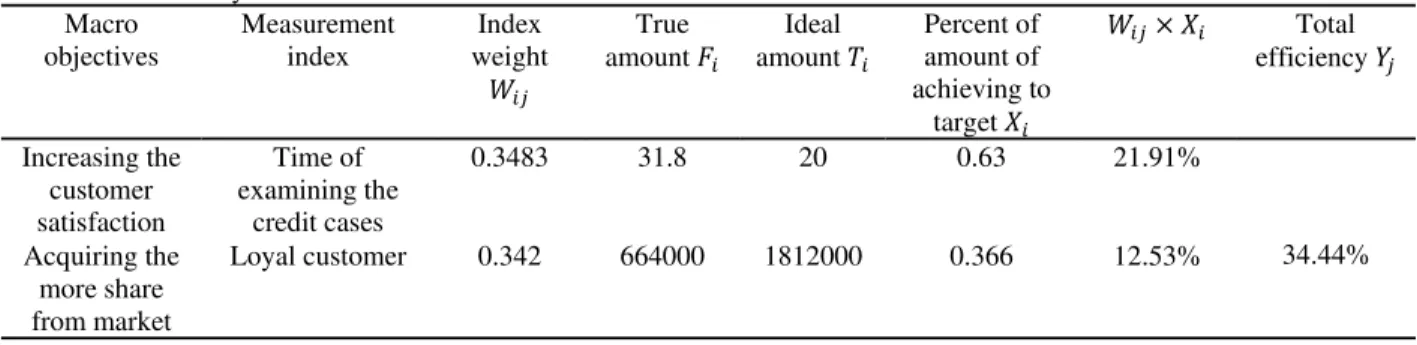
There are many evidences, which indicate that customer satisfaction is resulted from high quality services. A satisfied customer tends to be more faithful to bank in long run than unsatisfied customers are. Therefore, while at Tose`eTa`avon Bank, electronic cartable system is active, all of processes stages of examining the customer's request from time of referring to bank branches to the time of contracting the agreement are recordable and retrievable. Designing a cartable system is performed such that one can receive and study the time spent at each of the case examining stages.
Customer loyalty
At today changing world, we need tremendous efforts for providing and maintaining customer satisfaction. Loyal customer is as an excellent marketing agent and very valuable sale resource. BSC team by sessions held with the expert and manager of the resources equipping affaires, for assessing the customer loyalty at Tose`eTa`avon Bank considered the agreements number examination, contracted between bank and the private firms and the state organizations agreements as the main indicators of the customers willingness for continuing their activities with bank. Table 5 reflects indexes, macro objectives, aspects weights and customer's feedback efficiency score in 2010.
Table 5 Customer efficiency Macro objectives Measurement index Index weight True amount Ideal amount Percent of amount of achieving to target Total efficiency Increasing the customer satisfaction Time of examining the credit cases
0.3483 31.8 20 0.63 21.91%
34.44% Acquiring the
more share from market
Loyal customer 0.342 664000 1812000 0.366 12.53%
4.1.4.4.Learning and growth face
survival of the organization. Table 6 reflects indexes, macro objectives, aspect weights and also learning and growth aspect efficiency score in 2010.
Table 6
Computing learning and growth efficiency face
Macro objectives
Measurement index
Index weight
True amount
Ideal amount
Percent of amount of achieving to
target
Total efficiency
Increasing and enhancing the
workers training level
Workers
education level 0.2575 66.5% 100% 0.67 17.12%
72.37% Held training
hours
0.275 3041541 5250000 0.579 15.93%
Amount of paid bonus sum to
workers
0.1191 835072 1745121 0.48 5.70%
Using today technology
and IT
Budget spent for extending information
technology
0.3484 74000000 76693000 0.96 33.62%
4.1.4.5. Computing total organization efficiency index
Based on the results we obtained, we are now able to compute the relative efficiencies of four BSC components. Table 7 summarizes the results of our survey.
Table 7
Total efficiency of Tose`eTa`avon Bank
BSC faces Face weight Total face
efficiency
.
Financial 0.121 52.65% 6.37%
41.87%
Internal process 0.382 45.37% 17.33%
Growth and learning 0.251 72.37% 18.16%
Customer-concentrated 0.246 34.44% 8.47%
As we can observe from the results of Table 7, it is possible to improve total efficiency of the bank using different techniques.
4.2. Phases of dismounting DEA model for determining bank line efficient and deficient units
For the proposed study of this case study, we have considered 30 bank units. There were 28 units with long working history, and we could use all necessary information and two branches were set aside because they were relatively new ones. For DEA implementation, we have used DEA-MASTER software package to measure the relative efficiencies of 28 units. Table 8 summarizes detailed results of our investigation.
Table 8
Computing Tose`eTa`avon Bank branches department efficiency
Unit 1 2 3 4 5 6 7 8 9 10 11 12 13 14
Efficiency 39.5 52.9 32.7 58.8 84.7 100 100 85.4 100 43 100 51.1 49 72.7
Unit 15 16 17 18 19 20 21 22 23 24 25 26 27 28
At this stage from research, at the first, branches departments under examination were determined. Tose`eTa`avon Bank has the branches and branches department at thirty Iran provinces, that in this research twenty eight branches departments have been examined and two branches departments because of being new-established, were not considered at the examination. At DEA, organization line, personnel number, total deposits remaining at end of the year for each branch and branches cost have been considered as input and delayed claims remaining and income have been considered as output. After being specified research input and output collecting the creditable bank information by using DEA-MASTER software, efficiency and deficiency of each of 28 branches departments available at the country were specified based on axis output model and with VRS relative to scale as follow, at below table, branches departments names have not been mentioned due to maintaining the bank information:
5. Discussion and conclusion
According to the research findings, one can state the results of this research as follow:
At financial face, the most effective index is the cost of money followed by other indexes of return and assets and equities. The organization function score at financial face is 52.65%, which indicates that organization could reach to more than 50% of its own strategic objectives. For analyzing the results attained from profitability indexes at Tose`eTa`avon Bank, the following concluding remarks and suggestions can be made,
The bank has considerable amount of receivable accounts and it seems that the bank cannot settle a significant portion of this item of current assets. In other word, bank has no choice but to write down a big portion of this item and this would hurt profitability of the organization. The other important factor influencing the profitability of this bank is the change in prime rate and domestic economy. The other BSC aspect is learning and growth with 72.37%, which means the bank was relatively successful. The main reason was because of the sufficient access to necessary software and hardware equipments. Learning and growth identify the necessary substructure for organization survival and long-term growth. Customer has been the weakest aspects of this bank with 34.44% points, which is well below the desirable limit. The bank should be blamed for shortcoming on customer loyalty and satisfaction. The bank needs for better plans for customer retention and having better communication with its customers. The internal processes was another poor sector in terms of BSC perspectives gaining only 45.37% leading the whole organization to an unacceptable rate of 41.87%. Note that there were only seven units remained efficient compared with other 21 units based on DEA implementation and 21 units mostly were operating less than 50% of the efficiency.
Reference
Azadeh, A., Ghaderi, S.F., & Izadbakhsh, H. (2007). Integration of DEA and AHP with computer
simulation for railway system improvement and optimization. Applied Mathematics and
Computation, 195, 775-85.
Boland, T. & Fowler, A. (2000). A System perspective of performance management in public sector
organizations. The International Journal of Public Sector Management, 13(5), 417-446.
Bolton, M. (2003). Public sector performance measurement: delivering greater accountability. Work
Study, 52(1), 20-24.
Charnes, A., Cooper, W.W., & Rohdes, E. (1978). Measuring the efficiency of decision making units.
European Journal of Operational Research, 2(6), 429-444.
Chen, T.-Y., & Chen, L.-H. (2007). DEA performance evaluation based on BSC indicators
incorporated. International Journal of Productivity and Performance Management, 56(4),
335-357.
Ertay, T., Ruan, D., & Tuzkaya, U.R. (2006). Integrating data envelopment analysis and analytic
hierarchy for the facility layout design in manufacturing systems. Information Sciences, 176,
237-62.
Farrel, M. (1957). The mesurment of productivity efficiency. Journal of Royal Statistical Society,
120, 253-281.
Guo, J.Y., Liu, J., & Qiu, L. (2006). Research on supply chain performance evaluation: based on DEA/AHP model. Proceedings of the IEEE Asia-Pacific Conference on Services Computing (APSCC`02).
Huang, H.C. (2009). Designing a knowledge-based system for strategic planning: A balanced
scorecard perspective. Expert Systems with Applications, 36, 209-218.
Eilat, H., Golany, B., & Shtub, A. (2008). R&D project evaluation: An integrated DEA and balanced
scorecard approach. Omega, 36, 895 – 912
Wu, H.Y., Tzeng, G.H., & Chen, Y.H. (2009). A fuzzy MCDM approach for evaluating banking
performance based on balanced scorecard. Expert Systems with Applications, 36(6), 10135-10147.
Wu, H.Y., Lin, Y.K., & Chang, C.H. (2011). Performance evaluation of extension education centers
in universities based on the balanced scorecard. Evaluation and Program Planning, 34, 37-50.
Jyoti Banwet, D. K., & Deshmukh, S. G. (2008). Evaluating performance of national R&D
organizations using integrated DEA-AHP technique. International Journal of Productivity and
Performance Management, 57(5), 370-388.
Karathanos, D., & Karathanos, P. (2005). Applying the balanced scorecard to education. Journal of
Education for Business, 80(4), 222-230.
Kang, H.Y., & Lee, A.H.I(2010). A new supplier performance evaluation model A case study of
integrated circuit (IC) packaging companies. Kybernetes, 39(1), 37-54.
Korpela, J., Lehmusvaara, A. and Nisonen, J. (2007). Warehouse operator selection by combining
AHP and DEA methodologies. International Journal of Production Economics, 108, 135-142.
Kamvysi, K., Gotzamani, K., Andronikidis, A. & Georgiou, A.C. (2010). Integrating DEAHP and
DEANP into the quality function deployment, The TQM Journal, 22(3), 293-316.
Niven, P.R. (2002). Balanced Scorecard Step-by-step: Maximizing Performance and Maintaining
Results. John Wiley & Sons, Inc., New York.
Papalexandris, A., Ioannou, G., Prastacos, G.P., & Soderquist, K.E. (2005). An Integrated
Methodology for Putting the Balanced Scorecard into Action. European Management Journal,
23(2), 214–227.
Propper, C. & Deborach, W. (2003). The use and usefulness measures in the public sector. Oxford
review of economic policy, 19(2), 250-267.
Saaty, T.L. (1994). Fundamentals of Decision Making, RWS Publications, Pittsburgh, PA.
Stan, D., Albright, T. (2004). An investigation of the effect of Balanced Scorecard implementation on
financial performance. Management Accounting Research, 15, 135–153.
Tangen, S. (2004). Professional practice performance measurement: from philosophy to practice.
International Journal of Productivity and performance Management, 53(8), 26-37.
Garcia-Valderrama, T., Mulero-Mendigorri, E., & Revuelta,Bordoy, D. (2009). Relating the
perspectives of the balanced scorecard for R&D by means of DEA. European Journal of
Operational Research, 196(3), 1177–1189
Wang, Y.M., Liu, J., & Elhag, M.S. (2007). An integrated AHP-DEA methodology for bridge risk assessment. Computers & Industrial Engineering, 54(3), 513-525.
Yang, T., & Kuo, C. (2003). A hierarchical AHP/DEA methodology for facilities layout design