*
Corresponding author: Yangchun Chen, Department of Nuclear Medicine, Quanzhou First Hospital, Fujian Medical University, 248 East Street, Licheng District, Quanzhou, China. Tel: 008618120625062; E-mail: [email protected]© 2016 mums.ac.ir All rights reserved.
This is an Open Access article distributed under the terms of the Creative Commons Attribution License (http:// creativecommons.org/licenses/by/3.0), which permits unrestricted use, distribution, and reproduction in any
Background-based Delineation of Internal Tumor Volume in Static
Positron Emission Tomography in a Phantom Study
Yangchun Chen
1,2*, Xiangrong Chen
3, Ji-an Liu
4, Fanyong Li
21 Department of Nuclear Medicine, Quanzhou First Hospital, Fujian Medical University, Quanzhou, China 2 The PET-CT Center, First Affiliated Hospital of Guangzhou Medical University, Guangzhou, China 3 Department of Radiology, Quanzhou First Hospital, Fujian Medical University, Quanzhou, China
4 Guangdong Provincial Key Laboratory of Micro-nano Manufacturing Technology and Equipment, Guangdong University
of Technology, Guangzhou, China
A R T I C L E I N F O A B S T R A C T
Article type:
Original article
Objective(s): Considering the fact that the standardized uptake value (SUV) of a normal lung tissue is expressed as x±SD, x+3×SD could be considered as the threshold value to outline the internal tumor volume (ITV) of a lung neoplasm. Methods: Three hollow models were filled with 55.0 kBq/mL fluorine18- fluorodeoxyglucose (18F-FDG) to represent tumors. The models were fixed to a
barrel filled with 5.9 kBq/mL 18F-FDG to characterize normal lung tissues as a
phantom. The PET/CT images of the phantom were acquired at rest. Then, the barrel was moved periodically to simulate breathing while acquiring PET/CT data. Volume recovery coefficient (VRC) was applied to evaluate the accuracy of ITVs. For statistical analysis, paired t-test and analysis of variance were applied. Results: The VRCs ranged from 0.74 to 0.98 and significantly varied among gross tumor volumes for delineating ITV (P<0.01). In two-dimensional PET scans, the motion distance did not affect VRC (P>0.05), whereas VRC decreased with increasing distance in three-dimensional PET scans (P<0.05)
.
Conclusion: The threshold value (x+3×SD) had the potential to delineate the ITV of cancerous tissues, surrounded by lung tissues, particularly in two-dimensional PET images.
Article history:
Received: 4 Jun 2015 Revised: 16 Aug 2015 Accepted: 6 Sep 2015
Keywords:
Gross Tumor Volume Internal Tumor Volume Positron Emission Tomography Standardized Uptake Value
Please cite this paper as:
Yangchun Ch, Xiangrong Ch, Ji-an L, Fanyong L. Background-based Delineation of Internal Tumor Volume in Static Positron Emission Tomography in a Phantom Study. Asia Oceania J Nucl Med Biol. 2016; 4(1):38-44. doi: 10.7508/ aojnmb.2016.04.006
images, acquired by gated or list-mode scans (3-6).
Several methods have been proposed for outlining lung neoplasms on PET images. These methods are based on the standardized uptake value (SUV) of the tumor alone or the SUV of the tumor combined with that of the background or even the tumor volume and motion distance (7).
Since the coincidence time window is less than 12 ns during PET scan (8), any coincidence event can be regarded as a free motion event. In other
Introduction
Based on the guidelines by the National Comprehensive Cancer Network (NCCN) on
Non-Small Cell Lung Cancer (version 2, 2015), fluorine-18 fluorodeoxyglucose (18F-FDG) positron emission tomography (PET) has been recommended for delineating lung tumor target volume (1).
Since respiratory motions affect quantification
in un-gated PET images(2), several studieshave attempted to outline the gross tumor volume
words, it can be stated that the coincidence event is immobile, while the lung tumor is in motion. Therefore, it was speculated that PET images of lung tumors at rest could be linearly translated and overlaid to simulate un-gated PET images during breathing. Un-gated PET images of a lung
tumor should accurately reflect its ITV.
In the present study, the region of interest in normal lung tissues was outlined, and the SUV of each voxel was computed. The SUV values were normally distributed and recorded as x±SD. If the SUV surpassed x+3×SD, the probability of the voxel belonging to a normal lung tissue would be smaller than 0.003. Therefore, x+3×SD served as the threshold value (ThV) for measuring ITV (9) on two-dimensional (2D)-PET images and showed great potential in three-dimensional (3D)-PET images, as well.
Materials and Methods
PhantomThree hollow plastic models (two heart-shaped models and one ball-heart-shaped model) with internal diameters of 26, 46 and 50 mm and volumes of 18.9, 64.6 and 100.9 mL were used and labeled as model 3, model 2 and model 1, respectively (10). A barrel was filled with 5.9
kBq/mL 18F-FDG solution to represent a normal lung tissue. Afterwards, the models were filled
with 55.0 kBq/mL 18F-FDG solution to simulate a tumor tissue; the models were fixed on the bottom of the barrel (9).
Simulation of respiratory motions
To simulate respiratory patterns (i.e.,
breathing extent and frequency) in the majority
of patients by three stepper motors, the phantom was linearly translated, based on the
equation (1) or equations (2a–2d), as illustrated
in Figure 1. The motors continued moving step by step, and the time interval was set at 0.04 s
or 0.05 s for equation (1) or equations (2a-2d),
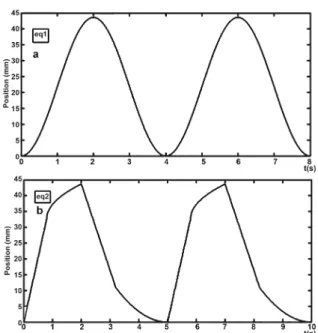
respectively: Figure 1. Illustration of time-position curves of the phantom.
The phantom movements controlled by stepper motors (following equations 1 and 2a-2d) were graphed in sub-images (based on equations 1 and 2), respectively
Figure 2. Volume recovery coefficients of three lung tumor models (NS: not significant)
Table 1. Moment of PET data acquisition after the injection
Simulated breath PET scan
Motion Distance (mm) 2D (min) 3D (min)
Equation (1)
10.9 210/223/230 347/353/358
21.8 192/198/204 331/336/341
43.7 172/178/185 314/320/325
Equation (2)
10.9 276/282/288 397/403/409
21.8 257/264/270 381/387/392
Yangchun Chen et al AOJNMB Delineation of Internal Tumor Volumes on PET
P(t) = A + A × sin(2πt/T-π/2) (Eq. 1)
where the amplitudes of motion A were 5.5, 10.9 and 21.8 mm, respectively. The period T for the breathing cycle was set at 4 s.
When 0+5×N-cycle≤ t ≤ 0.4Ti+5×N-cycle:
πt π/2
When 0+5×N-cycle≤ ≤ 0.4
t T
h t P
i × =
8 15 ) (
(Eq.
When 0.4 +5×N-cycle ≤
h
× × − × + =
≤
15h× −
− =
≤
T + −
× =
(Eq.2a)
When 0.4Ti+5×N-cycle<t ≤ Ti+5×N-cycle:
i P
i i
T T t
h h t
P )
6 . 0
4 . 0 ( 4 4 3 ) (
× × − × +
= (Eq. 2b)
When Ti +5×N-cycle< t ≤ Ti + 0.4Te+5×N-cycle:
πt π/2
≤ ≤ 0.4
× =
≤
× × − × + =
When +5×N-cycle< ≤ + 0.4
) ( 8 15 )
( i
e T t T
h h t
P = − × −
When + 0.4 +5×N-cycle< ≤
t
− + × =
(Eq. 2c)
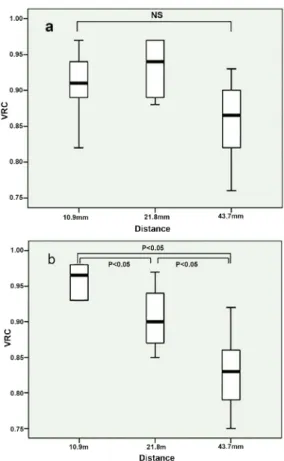
Figure 3. The impact of distance and the acquisition model on volume recovery coefficients of lung tumor models: A) 2D-PET data acquisition, B) 3D-PET data acquisition (NS: not significant)
Figure 4. The impact of distance and mode of motion on volume recovery coefficients of lung tumor models: A) Motion of models according to equation 1, B) Motion of models according to equation 2 (NS: not significant)
Table 2. ITVmeasured (delineated by x+3×SD on PET images) and ITVtrue of three lung tumor models moving in six different motions. ITVmeasured (mL)
GTV (mL) Distance (mm) ITVtrue (mL) Following equation (1) Following equation (2)
2D 3D 2D 3D
100.9 10.9 139.9 156.0 ± 4.8 149.1 ± 2.7 144.3 ± 5.8 144.1 ± 4.8
21.8 172.7 182.9 ± 5.0 169.1 ± 1.1 170.0 ± 8.4 157.9 ± 3.5
43.7 234.8 218.1 ± 3.0 210.1 ± 3.8 212.9 ± 3.6 208.3 ± 16.8
64.6 10.9 85.8 108.0 ± 2.6 101.9 ± 1.8 98.4 ± 6.8 100.5 ± 3.8
21.8 107.0 122.6 ± 3.4 118.3 ± 2.2 120.3 ± 7.5 111.6 ± 2.9
43.7 149.6 155.8 ± 1.9 152.4 ± 6.4 152.6 ± 9.6 151.3 ± 10.4
18.9 10.9 32.2 39.8 ± 0.8 38.4 ± 1.6 36.0 ± 3.6 37.4 ± 1.6
21.8 42.8 48.7 ± 2.7 44.8 ± 0.8 44.1 ± 2.3 41.7 ± 2.0
43.7 63.7 61.2 ± 0.4 56.6 ± 2.3 59.1 ± 2.8 58.7 ± 7.3
When Ti + 0.4Te +5×N-cycle< t ≤ Ti + Te+5×N-cycle:
≤ ≤ 0.4
× =
≤
× × − × + =
≤
− × − =
When + 0.4 +5×N-cycle< ≤
e
P e e i
T t T T h t
P )
6 . 0 ( 4 )
( = × + − (Eq. 2d)
where P(t) is the position of phantom at time t. The maximum motion distance h was 10.9, 21.8 and 43.7 mm, respectively. The inhalation time Ti was fixed at 2 s and the exhalation time Te was
fixed at 3 s. Therefore, the respiratory cycle was set at 5 s in equations 2a-2d. In addition, Pi and Pe were 0.5 and 2, respectively. Also, N-cycle denoted “non-negative integer” (e.g., 0, 1 and 2).
PET imaging and SUV calculation
The image acquisition protocol was in
accordance with Chen YCH et al. (11), performed by
the PET/CT scanner (Discovery ST, GE Healthcare,
USA). The CT scans were obtained with 140 kV,
150 mA, and 0.8 s/rotation, using a 3.75
mm-thick section. Two dimentional (2D) and 3D PET scans were immediately performed following the CT scan with 3.5 min per table position. The Full width at half maximum (FWHM) values were
6.9 and 7.2 mm for 2D and 3D PET acquisitions,
respectively.
The PET/CT data of the moving phantom were acquired, following the PET/CT scan at rest. The
scan time is presented in Table 1. The CT images were displayed by a 512×512 matrix with a pixel size of 0.98 mm, while the PET images were displayed in a 128×128 matrix with a pixel size of 4.7 mm. The SUVs were calculated, according to
Meirelles GS et al. (12).
ITV of the models on CT images
True GTV (GTVtrue) denotes the volume of
the hollow model (11), and ITV was defined as a region, encompassed of GTVtrue motions during
PET/CT data acquisition.
Regarding phantom movements, equations (1) and (2a–2d) were followed, and the exact
position of the phantom at a specific moment during movement could be easily located. The CT images at rest could be linearly translated to the determined position, with a weighted factor of 0.01. The overlaying of these weighted CT images resulted in artifact-free CT images of the phantom at motion, covering a whole breathing cycle.
The contours of the ITVs of tumor models could be delineated on the obtained artifact-free CT images, with an optimal Hu threshold value (ThV ). The ThV (Hu) matched the volume of the ITV (ITVtrue) of model 2 (ball-shaped), which could be computed using the following
equation:
ITVtrue = GTVtrue + πR2 × distance (Eq. 3)
where R can be calculated based on the
following equation:
3 true
4 GTV 3
π × =
R (Eq. 4)
ITV of the models on PET images
The CT and PET images were accurately co-registered in a single gantry without external markers or internal landmarks (13, 14). After the CT voxels were resized by interpolation to match the PET voxels, the ITVtrue values of models on PET images were established. Any voxel with an SUV above x+3×SD would be related to the measured ITV (ITVmeasured) of each model.
Statistical analysis
The volume recovery coefficient (VRC) of the
ITV was calculated by the following equation:
true true measured
ITV ITV ITV
VRC= (Eq. 5)
The ITVmeasured and VRC were calculated for each model and motion by 2D and 3D scan
acquisitions. The average values and standard
deviations were calculated for further analysis. Figure 5. Differences between ITVtrue and ITVmeasured obtained
Yangchun Chen et al AOJNMB Delineation of Internal Tumor Volumes on PET
Nine ITVtrue values were obtained in this study, and paired t-test was performed to identify significant differences between ITVtrue and ITVmeasured.
Factorial analysis of variance (ANOVA) was performed to evaluate significant differences
between VRCs and factors such as GTVtrue of the models (models 1, 2, and 3), distance (10.9, 21.8
and 43.7 mm), motion (according to equations 1 and 2) and PET acquisitions (2D and 3D scans). Student-Newman-Keuls test was also
performed when the factorial ANOVA reached a significance level of P≤0.05 (two-tailed).
Results
ITV of the models
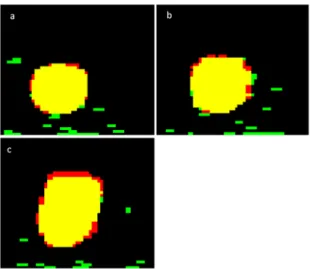
The SUV threshold value (x+3×SD) was within the range of 1.7-2.2 for the segmentation of PET images from the models in motion. The ITVmeasured values as calculated by x+3×SD were not significantly different from ITVtrue values (P>0.05) (Table 2).
VRCs of ITVs
The VRC values are presented in Table 3.
These VRCs were significantly different among GTVtrue values, used for delineating ITVs (P<0.01). The VRCs of model 2 surpassed those of model 3 (P<0.05); however, neither model 2 nor model 3
significantly differed from model 1 (P>0.05), as indicated in Figure 2.
In addition, statistically significant relationships
were found (P<0.01) between motion distance,
PET acquisition and motions. In the 2D PET scans,
the motion distance did not affect VRC (P>0.05), as shown in Figure 3A, whereas VRC decreased with increasing motion distance (P<0.05) in 3D PET scans, as depicted in Figure 3B. The VRCs
decreased with increasing motion distance
calculated by equation (2), and the VRCs for 43.7 mm distance were significantly lower than VRCs for
10.9 mm distance (P<0.05), as shown in Figure 4.
No significant differences were detected between
other mean values (P>0.05).
Discussion
Lung tumor and normal tissues are usually surrounded by each another. Therefore, the ThV of SUV in a normal lung tissue was speculated to outline the ITV of the tumor tissue, surrounded by
the normal tissue on PET images. We confirmed
this hypothesis and showed that x+3×SD could be an ideal threshold for measuring ITV, as ITVmeasured
was not significantly different from ITVtrue.
Furthermore, according to the Gaussian
distribution, only 0.1% of the voxels from the normal lung tissue was added to the ITVtrue. However, the ITVmeasured as determined by x+3×SD calculation did not exactly match the ITVtrue (Figure 5). Two major reasons can be stated for this discrepancy. First, the SUV of the voxels on the margin of the ITV may be lower than the ThV value. Second, the registered error between CT and PET images, obtained from the same PET-CT scanner, could reach half the size of PET pixels (14).
Since the reference images of ITVs in our study were obtained from simulated CT images and error propagation rules, the registered error between the ITVmeasured on PET images and ITVtrue on reference images might be larger than the registered error between CT and PET data
acquisitions at rest (i.e., half the size of PET pixels).
Therefore, the ITVmeasured did not match the ITVtrue, and the VRCs were always smaller than one.
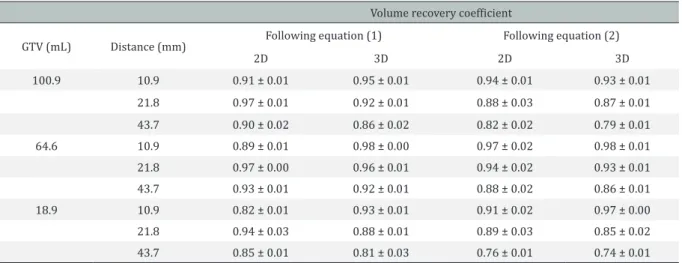
The VRCs of model 2 exceeded those of models 1 and 3 (P<0.05). One possible reason is that the Table 3. Volume recovery coefficients of the ITVmeasured for the three lung tumor models moving in six different motions.
Volume recovery coefficient
GTV (mL) Distance (mm) Following equation (1) Following equation (2)
2D 3D 2D 3D
100.9 10.9 0.91 ± 0.01 0.95 ± 0.01 0.94 ± 0.01 0.93 ± 0.01
21.8 0.97 ± 0.01 0.92 ± 0.01 0.88 ± 0.03 0.87 ± 0.01
43.7 0.90 ± 0.02 0.86 ± 0.02 0.82 ± 0.02 0.79 ± 0.01
64.6 10.9 0.89 ± 0.01 0.98 ± 0.00 0.97 ± 0.02 0.98 ± 0.01
21.8 0.97 ± 0.00 0.96 ± 0.01 0.94 ± 0.02 0.93 ± 0.01
43.7 0.93 ± 0.01 0.92 ± 0.01 0.88 ± 0.02 0.86 ± 0.01
18.9 10.9 0.82 ± 0.01 0.93 ± 0.01 0.91 ± 0.02 0.97 ± 0.00
21.8 0.94 ± 0.03 0.88 ± 0.01 0.89 ± 0.03 0.85 ± 0.02
relative error measurement of the GTV of model 2
(∝1/diameter = 1/50) was smaller than the GTVs of models 1 and 3 (∝1/diameter= 1/46 and 1/26, respectively) for the same CT or PET image. The order of the relative error measurement of ITVs in
these three models was similar to the GTV values.
In 2D-PET scans, the motion distance did not affect VRC (P>0.05), whereas in 3D-PET scans, VRC decreased by increasing motion distance (P<0.05), which was in line with the results reported by Park and colleagues (15).
Two important reasons can be stated in this regard. First, the axially-angled segments yielded truncated views of the object in 3D-PET
acquisitions, and these truncated views were
smaller in the y direction, whereas 2D transverse planes could be reconstructed independently from each other (16). Second, the registered error and attenuation corrected error between PET and CT images could be enlarged as the motion distance of the models increased. Therefore, since the
densities of the models were similar to the liquid
in the background, the attenuation corrected error could be neglected.
The VRCs decreased by increasing motion
distance calculated by equation (2), and the VRC for 43.7 mm distance was significantly lower than
the VRC for 10.9 mm distance (P<0.05). On the
other hand, VRCs did not significantly change by increasing motion distance, based on equation (1). The obtained findings suggest that different
motion types may affect the ITV delineation, and
four-dimensional PET-CT data acquisition would be beneficial for delineating ITVs as their motion
distance increases, since the superior temporal resolution helps to freeze motion images in several phases.
Limitations
Considering the partial volume effects, small spheres (<18.9 mL) were not included in this study. In addition, only regular respiratory motions were simulated. Therefore, the effects of patient’s irregular breathing on ITV segmentation in PET images should be further investigated. Moreover, since the normal lung tissue region was manually outlined, the SUV (x±SD) of this region might have been affected by inter- and intra-operator variability.
The heterogeneous tracer distribution in the models was also not simulated in this study,
considering the difficulty of simulation in phantom studies. It should be mentioned that the fluid-based
background could imitate 18F-FDG distribution in normal lung tissues, although it could not mimic
its density. Finally, since PET image reconstruction was based on its corresponding CT image (8), the SUV in the realistic lung tumor might have been underestimated, whereas the ITV measured by the background-based method might have been overestimated in this study.
Conclusion
The ThV (x+3×SD) of the SUV, determined in the normal lung tissue region, especially on 2D-PET images, had the potential to delineate the ITV of a lung tumor, surrounded by a normal lung tissue for radiotherapy.
Conflicts of interest
There were no conflicts of interest.
Acknowledgements
This study was supported by the National
Natural Science Foundation of China (Grant No.:
30800274).
References
1. Ettinger DS, Wood DE, Akerley W, Bazhenova LA, Borghaei H, Camidge DR, et al. Non-small cell lung cancer, version 1.2015. J Natl Compr Canc Netw. 2014;12(12):1738-61.
2. Apostolova I, Wiemker R, Paulus T, Kabus S, Dreilich T, van den Hoff J, et al. Combined correction of recovery effect and motion blur for SUV quantification of solitary pulmonary nodules in FDG PET/CT. Eur Radiol. 2010;20(8):1868-77.
3. Wang J, del Valle M, Goryawala M, Franquiz JM, McGoron AJ. Computer-assisted quantification of lung tumors in respiratory gated PET/CT images: phantom study. Med Biol Eng Comput. 2010;48(1):49-58.
4. Bundschuh RA, Martí�nez-Möller A, Essler M, Nekolla SG, Ziegler SI, Schwaiger M. Local motion correction for lung tumours in PET/CT--first results. Eur J Nucl Med Mol Imaging. 2008;35(11):1981-8.
5. Schaefer A, Kremp S, Hellwig D, Rube C, Kirsch CM, Nestle U. A contrast-oriented algorithm for FDG-PET-based delineation of tumour volumes for the radiotherapy of lung cancer: derivation from phan-tom measurements and validation in patient data. Eur J Nucl Med Mol Imaging. 2008;35(11):1989-99. 6. Okubo M, Nishimura Y, Nakamatsu K, Okumura
M, Shibata T, Kanamori S, et al. Static and moving phantom studies for radiation treatment planning in a positron emission tomography and computed tomography (PET/CT) system. Ann Nucl Med. 2008;22(7):579–86.
Yangchun Chen et al AOJNMB Delineation of Internal Tumor Volumes on PET
M, Sun X, et al. Target definition of moving lung tumors
in positron emission tomography: correlation of optimal activity concentration thresholds with object size, motion extent, and source-to-background ratio. Med Phys. 2010;37(4): 1742-52.
8. Townsend DW. Dual-modality imaging: combining anatomy and function. J Nucl Med. 2008;49(6):938-55.
9. Chen Y, Chen X, Ji-An L, Li F. Estimation of internal tumor volume: a phantom study based on semiautomatics standardized uptake value of the background. Chinese J Med Imaging. 2015;23:91-5. 10. Chen Y, Chen X, Li F, Ji-An L. Gross target volume
delineation on PET images by a numerical approximation method–phantom studies. Nucl Electron Detect Technol. 2014;34:1463-8.
11. Chen Y, Chen X, Li F, Ji-An L. Delineation gross tumor volume based on positron emission tomography images by a numerical approximation method. Ann Nucl Med. 2014;28(10):980-5.
12. Meirelles GS, Kijewski P, Akhurst T. Correlation of PET/CT standardized uptake value measurements between dedicated workstations and a PACS-integrated workstation system. J Digit Imaging. 2007;20(3):307–13.
13. Townsend DW. Dual-modality imaging: combining anatomy and function. J Nucl Med. 2008;49(6):938-55.
14. Chen Y, Zhang C, Xu H, Chen P, Fan M. Registered error between PET and CT images confirmed by a water model. Nucl Technique. 2012;35:619-23. 15. Park SJ, Ionascu D, Killoran J, Mamede M, Gerbaudo
VH, Chin L, et al. Evaluation of the combined effects of target size, respiratory motion and background activity on 3D and 4D PET/CT images. Phys Med Biol. 2008;53(13):3661-79.