"
セfundaᅦᅢo@
"
GETULIO VARGAS
EPGE
Escola de Pós-Graduação em Economia
-
-SE\II'\ \RIOS
DF
pfセH@>l
jセ@\
"
rCU,\()\lJC \
"Global Capital Markets: Integration,
Crisis and Growth"
•
•
Prof. Alan Taylor (Northwestem University/NBER)
(co-autoria com
Maurice Obstfeld)
LOCAL
Fundação Getulio Vargas
Praia de Botafogo, 190 - 10° andar - Auditório
DATA
12/11/98 (53 feira)
HORÁRIO
16:00h
fH3c1Jd C'it){2-- 5
BIBLIOTECA
'. MARIO HENR'QlJE SIMONSEN
FUNJAÇAO G::OU; VARGAS
'( < ;.': ;
J ( _ _ \ \
r _
-
I )
U ').
•
•
Global Capital Markets
Integration, Crisis, and Growth
This book presents an economic history of intemational capital
mobility since the late nineteenth century. The book begins with a
preamble that introduces the major issues and examines developments
in the eighteeneth century and before, important historical
preconditions that set the stage for a global market in the nineteenth
century. We then discuss the theory and empirical evidence
surrounding the falI and rise of integration in the global market. A
discussion of institutional developments focuses on the use of capital
controls and the pursuit of macroeconomic policy objectives in the
context of changing monetary regimes. A fundamental
macroeconomic
policy trilemma has forced policymakers to trade off beteween
conflicting goals, with natural implications for capital mobility.
Understood this way, the present era of globalization can be seen, in
part, as merely the resumption of a liberal world order that had
previously been established in the years from 1880 to 1914. Marking a
reaction against that order, the Great Depression emerges as the key
tuming point in the recent history of intemational capital markets, and
offers important insights for contemporary policy debates.
MAURICE OBSTFELD
is Class of 1958 Professor of Economics at the
University of Califomia at Berkeley and a Research Associate of the
National Bureau of Economic Research.
ALAN M. TAYLOR
is Assistant Professor ofEconomics at
Northwestem University and a Faculty Research Fellow of the
National Bureau of Economic Research .
NWOTECA IlARIO HENRIQUE _ _
Global Capital Markets
Integration, Crisis, and Growth
MAURICE OBSTFELD ALA'; ;"1. TAYLOR
Contents
Foreword
Acknowledgements
Part one: Preamble
Global Capital Markets: Overview and Origins
1.1 Theoretical Benefits
1.1.1 Intemational Risk Sharing 1.1.2 Intertemporal Trade 1.1.3 Discipline
page Xl
X 111
4
5 5 8 9
1.2 Problems of Supranational Capital Markets in Practice 10
1.2.1 Enforcement of Contracts and Informational Problems 10
1.2.2 Loss of Policy Autonomy II
1.2.3 Intemational Aspects of Capital-Market Crises 12
1.3 The Emergence of World Capital Markets 14
1.3.1 Early Modem FinanciaI Development 15
1.3.2 Technological and Institutional Changes 17
1.3.3 The Rise of Global Finance 21
IA Stylized Facts for the Twentieth Century 23
1.5 Trilemma: Capital Mobility, the Exchange Rate, and
Monetary Policy 1.6 Summary
26
28
Vll1 Contents
Part two: Global Capital in Modero HistoricaI Perspective 31
2 Globalization in Capital Markets: The Long-Run Evidence 34
2.1 Introduction 34
.., ..,
Overview 362.3 Quantity Cri teria 41
2.3.1 The Stocks of Foreign Capital 41
2.3.2 The Size ofFlows 52
2.3.3 The Saving-Investment Relationship 59
2.3.4 Caveats: Quantity Cri teria 68
2.4 Price Criteria 71
2.4.1 Covered Interest Parity 72
2.4.2 Real Interest Parity 76
2.4.3 Purchasing Power Parity 79
2.4.4 Caveats: Price Cri teria 85
2.5 Summary 86
3 Globalization in Capital Markets: A Long-Run Narrative 88
3.1 Capital Without Constraints: The Gold Standard, 1870-1931 88
3.1.1 The Classical Gold Standard Era 88
3.1.2 Rebuilding the Gold Standard 91
3.2 Crisis and Compromise: Depression and War, 1931-46 97
3.2.1 Capital Markets and the Great Depression 97
3.2.2 Policy Response: A Consensus on Capital Mobility 103
3.2.3 World War II and its Aftermath 107
3.3
Containment Then Collapse: Bretton Woods, 1946-71 1133.3.1 Stability Without Integration? 113
3.3.2 Leakage, then Deluge 119
3.4 Crisis and Compromise II: The Floating Era, 1971-99 121
3 A.1 Integration Without Stability? 121
•
Contents IX
Part three: Lessons for Today 125
4 Open Capital Markets: Worth the Risk? 127
4.1 Introduction 127
4.1.1 Open Capital Markets in Historical Perspective 127
4.1.2 Open Capital Markets Today 127
4.2 Evidence on Benefits versus Costs 127
4.2.1 Convergence 127
4.2.2 Growth 128
4.2.3 Portfolio diversification 128
4.2.4 Consumption smoothing 4.2.5 Output volatility
128 128
4.2.6 Corrleation versus Causation 128
4.3 Implications for Today's Global Economy 128
4.3.1 The Menu of Policy Choices 128
4.3.2 The Perpetuai Choice: Intervention versus Markets 128
Appendix:
An InternatÍona{ Macroeconomic Database 129
References 130
•
2
Globalization in Capital Markets:
The Long-Run Evidence
2.1 Introduction
In theory and practice, the extent of intemational capital mobility can have profound implications for the operation of individual and global economies. With respect to theory, the applicability of various classes of macroeconomic models rests on many assumptions, and not the least important of these are
axioms linked to the closure of the model in the capital market. The predictions
of a theory and its usefulness for policy debates can revolve critically on this part of the structure.
The importance of these issues for policy is not surprising at <lll' a moment's refteclion on practical aspects of macroeconomic policy choice underscores the impact lhat capital mobility can have on the efficacy of various interventions:
trivially, if capital is perfectly mobile, this dooms to failure any attempts to
manipulate local asset prices to make them deviate from global prices,
includ-ing the most criticai macroeconomic asset price, the interest rate. Thus, the feasibility and relevance of key policy actions cannot be judged absent some
informed position on the extent to which local economic conditions are in any
way separable from global conditions. This means an empirical measure of market integration is implicitly, though rarely explicitly, a necessary adjunct to any policy discussion. Although recent globalization trends bave brought this issue to the fore, we show in this chapter how the experience of longer-run rnacro-:conomic history can clarify and inform these debates.
In attacking the problem of measuring market integration, economists have no universally recognized criterion to tum to. For example, imagine the simple expedient of examining price differentials: prices would be identical in two identical neighboring economies. being determined in each by the identical structures of tastes. technologies, and endowments; but if the two markets were physically separated by an infinitely high transaction-cost barrier one could
2.1 /ntroduction 35
hardly describe them as being integrated in a single market, as the equality of prices was merely a chance event. Or consider looking at the size of ftows between two markets as a gauge of mobility; this is an equally ftawed criterion, for suppose we now destroyed the barrier between the two economies just mentioned. and reduced transaction costs to zero; we would then truly have a single integrated market, but, since on either side of the barrier prices were identical in autarky, there would be no incentive for any good or factor to move after the barrier disappeared. Thus, convergence of prices and movements of goods are not unambiguous indicators of market integration. One could run through any number of other putative criteria for market integration. examining perhaps the leveIs or correlations of prices or quantities, and discover essentially the same kind of weakness: alI such tests may be able to evaluate market integration. but only as a joint hypothesis test where some other maintained assumptions are needed to make the test meaningful.
Given this impasse, an historical study such as the present chapter is poten-tially valuable in two respects. First, we can use a very large array of data sources covering different aspects of international capital mobility over the last one hundred years or more. Without being wedded to a single criterion, we can attempt to make inferences about the path of global capital mobility with a bat-tery of tests. using both quantity and price cri teria of various kinds. As long as important caveats are kept in mind about each method, especially the auxiliary assumptions required for meaningful inference, we can essay a broad-based approach to the evidence. Should the different methods all lead to a similar conclusion we would be in a stronger position than if we simply relied on a single test.
Historical work offers a second benefit in that it provides a natural set of benchmarks for our understanding of today's situation. In addition to the many competing tests for capital mobility, we also face the problem that almost every test is usually a matter of degree. of interpreting a parameter or a measure of dispersion or some other variable or coefficient. We face the typical empirical conundrums (how big is big:' or how fast is fast?) in placing an absolute meamng on these measures. An historical perspective allows a more nuanced view, and places all such inferences in a relative context: when we say that a parameter for capital mobility is big, this is easier to interpret if we can say that by this we mean bigger than a decade or a century ago. The historical focus
of this chapter will be directed at addressing just such concerns. I We examine
36 Globalization in Capital Markets: The Long-Run Evidenee
the broadest range of data over the last one-hundred-plus years to see what has
happened to the degree of capital mobility in a cross section of countries. 2
The empirical work begins by looking at the extent of international capital movements over a century or more, employing data on both stocks and fiows of foreign capital. We then develop more refined quantity criteria by looking at the correlations of saving and investment in individual economies over the long run. In principie, more open economies should be better able to de-link saving and investment decisions via externai finance. An important discussion of caveats ends this section.
The next empirical section focuses on price-based criteria for capital market integration, and looks at three parity relations: covered interest parity (CIP), real interest parity (RIP), and purchasing power parity (PPP). In principie, ali three relations should come c10ser to equality the more integrated markets are. An examination of long-run price and interest rate series since the late nineteenth century affords a test ofthese relations. Once again, an important section details the caveats with this approach.
The conclusion conjectures some reasons why international capital mobility might have varied from time to time in the international economy over the last century or so. Important constraints on policy makers included a fundamental tradeoff between monetary policy choice, policies as regards capital mobility, and the desire for activist domestic monetary policy. We have termed this the
maeroeeanomie palie)' trilemma3 Consideratio!'! ofthe trilemma illustrates the tensions facing policymakers during the interwar period, a major turning point in the evolution of markets in the twentieth century, and helps us understand the changing commitments of governments to monetary regimes, their attempts at sterilization, and their confiict over adherence to the previously sacrosanct "rules of the game" under the orthodoxy of the gold standard. In this political economy context, the empirical evidence appears consistent with the stylized facts of twentieth-century social, political, and economic history.
2.2 Overview
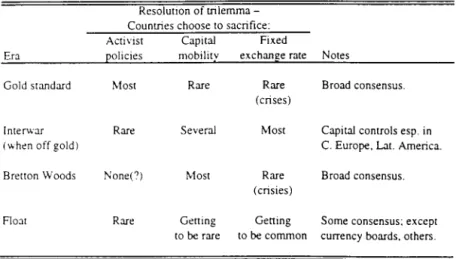
The broad trends and cycles in the world capital market that we will document refiect changing responses to the fundamental trilemma. Before 1914, each of
セ@ Given the limitations of the data. we will frequently be restricted to looking at between a dozen and twenty countries for which long-run macroeconomic statistics are available. and this sample will be dominated by today's developed countries. including most of the OECD countries. However, we a1so have long data series for some developing countries such as Argentina. Brazil. and Mexico: and in some criteria. such as our opening look at the evolution of the stock of foreign investments, we can examine a much broader sample.
2.2 Overview 37
the world's major economies pegged its currency's price in terrns of gold, and thus. implicitly, maintained a fixed rate of exchange against every other major country's currency. Financiai interests ruled the world of the classical gold
standard and financiai orthodoxy saw no alternative mode of sound finance.4
Latin American interludes of floating exchange rates were viewed from the main financiai centers with "fascinated disgust," to use the words of Bacha and Dlaz Alejandro (1982). Thus the gold standard system met the trilemma by opting for fixed exchange rates and capital mobility, sometimes at the expense of domestic macroeconomic health. Between 1891 and 1897, for example, the United States Treasury put the country through a harsh deflation in the face of persistent speculation on the dollar's departure from gold. These policies were hotly debated; the Populist movement agitated forcefully against gold, but lost. The balance of political power began to change only with the First World War, which brought a sea-change in the social contract underlying the industrial democracies. Organized labor emerged as a political power, a counterweight
to the interests of capital5
Although Britain's return to gold in 1925 led the way to a restored interna-tional gold standard and a limited resurgence of internainterna-tional finance, the system helped propagate a worldwide depression after the 1929 New York stock mar-ket crash. Following (and in some cases anticipating) Britain's example, many countnes abandoned the gold standard in the early 1930s and depreciated their
currencies: many also resorted to trade and capital controls in order to manage
independently their exchange rates and domestic policies. Those countries in the "gold bloc," which stubbornly clung to gold through the mid-1930s, showed the steepest output and price-Ievel declines. But eventually in the 1930s, ali countries jettisoned rigid exchange-rate targets and or open capital markets in
favor of domes ti c macroeconomic goals.6
Thcse decisions reflected the shift in political power solidified by the First World \Var. They also signaled the beginnings of a new consensus on the role of economic policy that would endure through the inflationary 1970s. As an im-mediate consequence. howevcr. the Great Depression discredited gold-standard orthodoxy and brought Keynesian ideas about macroeconomic management to the fore. It also made financiai markets and financiai practitioners unpopular. Their supposcd ex cesses and attachment to gold became identified in the public mind as causes of the economic calamity. In the United States. the New Deal brought a Jacksonian hostility toward eastern (read: New York) high finance back to Washington. Financiai products and markets were banned or more
.1 See Bordo and Schwartz (198.1): Eichengreen (1996).
セN@ See Temm ( 1989)
38
Globalization in Capital Markets: The Long-Run Evidenceclosely regulated, and the Federal Reserve was brought under heavier Treasury influence. Similar reactions occurred in other countries.
Changed attitudes toward financiai activities and economic management un-derlay the new postwar economic order negotiated at Bretton Woods, New Hampshire, in July 1944. Forty-four allied countries set up a system based on fixed, but adjustable, exchange parities, in the belief that floating exchange rates would exhibit instability and damage international trade. At the center of the system was the International Monetary Fund (IMF). The IMF's prime function was as a source of hard-currency loans to governments that might
oth-erwise have to put their economies into recession to maintain a fixed exchange
rate. Countries experiencing pennanent balance-of-payments problems had the
option of realigning their currencies, subject to IMF approval.7
Importantly, the IMF's founders viewed its lending capability as primarily a
substitute for, not a complement to, private capital inflows. Interwar experience
had given the latter a reputation as unreliable at best and, at worst, a dangerous source of disturbances. Encompassing controls over private capital movement, perfected in wartime, were expected to continue. The IMF's Articles of Agree-ment explicitly empowered countries to impose new capital controls. Article VIII of the IMF agreement did demand that countries' currencies eventually be made convertible - in effect. freely saleable to the issuing central bank, at the of-ncial exchange parity, for dollars or gold. But this privilege was to be extended
only to ;;:nresidents (not a country's own citizens), and only if the country's
currency had been earned either through merchandise sales or as à return on
past lending. Convertibility on capital account, as opposed to current-account convertibility, was not viewed as mandatory or desirable.
Unfortunately, a wide extent even of current-account convertibility took many
years to achieve. In the interim, countries resorted to bilateral trade deals
that required balanced or nearly balanced trade between every pair of trading partners. IfFrance had an export surplus with Britain, and Britain a surplus with Germany, Britain could not use its excess marks to obtain dollars with which to pay France. Germany had very few dollars and guarded them jealously for criticai imports from the Americas. Instead, each country would try to divert import demand toward countries with high demand for its goods, and to direct its exports toward countries whose goods were favored domestically.
Convertibility gridlock in Europe and its dependencies was ended through a regional multilateral clearing scheme, the European Payments Union (EPU).
The clearing scheme was set up in 1950 and some countries reached de facto
2.2 Overv/ew 39
convertibility by mid-decade. But it was not until December 27, 1958 that Europe officially embraced convertibility and ended the EPU.
Although most European countries still chose to retain extensive capital con-trols (Germany being the main exception), the retum to convertibility, important as it was in promoting multilateral trade growth, also increased the opportuni-ties for disguised capital movements. These might take the form, for example, of misinvoicing and accelerated or delayed merchandise payments. Buoyant growth encouraged some countries in further financialliberalization, although the U.s.. worried about its gold losses, raised progressively higher barriers to capital outftow over the 1960s. Eventually, the Bretton Woods system 's very successes hastened its collapse by resurrecting the "inconsistent trinity"
or tr/lemma.
Key countries in the system, notably the U.S. (fearful of slower growth) and Germany (fearful of higher inftation), proved unwilling to accept the domestic policy implications of maintaining fixed rates. Even the limited capital mobility of the early 1970s proved sufficient to allow furious speculative attacks on the major currencies, and after vain attempts to restore fixed dollar exchange rates, the industrial countries retreated to ftoating rates early in 1973. Although viewed at the time as a temporary emergency measure, the ftoating-dollar-rate regime is still with us a quarter-century on.
Floating exchange rates have allowed the explosion in intemational financiai markets experienced over that same quarter-century. Freed from one element of the trilemma - fixed exchange rates - countries have been able to open their capital markets while still retaining the ftexibility to deploy monetary policy in
pursuit of national objectives.8
There are several valid reasons for countries to fix their exchange rates -for example. to keep a better lid on inflation or to counter exchange-rate
insta-bility due to financial-market shocks. However, few countries that have tried
have succeeded for long; eventually, exchange-rate stability tends to come into conflict with other policy objectives. the capital markets catch on to the gov-ernment's predicament. and a crisis adds enough economic pain to make the authorities give in. In recent years only a very few major countries have ob-served the discipline of fixed exchange rates for at least five years, and most
of those were rather special cases.9 One puzzling case, Thailand, has dropped
off the list - with a resounding crash. Even Hong Kong, which operates as a
8. Aksma. Grilli. and セゥャ・ウゥMf・イイ・ョゥ@ (1994) and Grilli and Milesi-Ferreni (1995) report on panel studles of the incidence of capital controls (for 20 industrial countries over the years 1950 to 1989. and for 61 industrial and developing countries over the years 1966 to 1989). They find that more tlexible exchange rate regimes and greater central bank independence lower the probability of capnal controls.
,
40
Globalization in Capital Markets: The Long-Run Evideneecurrency board supposedly subordinated to maintaining the Hong Kong-U.S. dollar peg, suffered repeated speculative attacks in 1997. Another currency-board country, Argentina, has now held to its 1: 1 dollar exchange rate since April 1991, and so joins the exclusive five-year club. To accomplish this feat, the country has relied on IMF credit and has suffered unemployment higher than many countries could tolerate. The European Union members that have maintained mutually fixed rates have been aided by market confidence in their own planned solution to the trilemma, a full currency merger due to be con-summated in J anuary 1999. The trend toward greater financiai openness has been accompanied - inevitably, we would argue - by a declining reliance on pegged exchange rates in favor of greater exchange rate flexibility.
In short, the limitations that open capital markets place on exchange rates and monetary policy are summed up by the idea of the "inconsistent trinity" or,
as we term it, the maeroeeonomie poliey trilemma: a country cannot
simultane-ously maintain fixed exchange rates and an open capital market while pursuing a monetary policy oriented toward domestic goals. Governments may choose only two of the above. If, monetary policy is geared toward domestic consid-erations, capital mobility or the exchange-rate target must go. If instead, fixed exchange rates and integration into the global capital market are the primary desiderata, monetary policy must be entirely subjugated to those ends.
The details of this argument form the core of this book, based on empirical
evidence and the historical イセ」ッイ、L@ but we can already pinpoint lhe ke:' turning
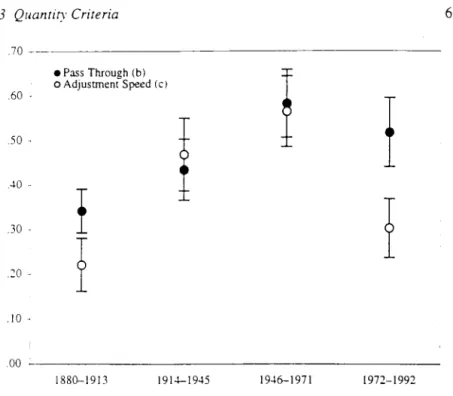
2.3 QlIantiry Criteria 41
Table 2.1. The Trilemma and Major Phases of Capital Mobility
Resolutlon of tnlemma -Countries choose to sacrifice: Activist Capital Fixed
Era Eolicies mobilitv exchange rate Notes
Gold standard Most R are Rare Broad consensus. (crises)
lnterv.·ar Rare Several Most Capital controls esp. in
(when off goldl C. Europe. La!. America.
Bretton Woods None(O) Most R are Broad consensus. (crisies)
Float Rare Gening Gening Some consensus; except to be rare to be common currency boards. others.
2.3 Quantity Criteria
This section employs data on the stocks and ftows of capital between coun-tries. that is. quantity data. to examine how the extent of capital mobility has changcd o\'cr the last hundred or so years. We begin by looking at long-term capital mobility. and we first discuss the size of foreign investment stocks and
flows. Ceteris pariblls. a greater degree of capital mobility should lead to larger
tlows ando with cumulation over time, larger stocks of foreign investment. We then relate the size of ftows to saving and investment pattems, to see to what extent the externaI ftows mattered in terms of the overalI composition of saving and in\cstment. \Ve next consider the saving-investment correlation. an oft-employed test that asks whether saving and investment activities lean toward being dc-Ilnked. as in a theoretically open economy, or tend in the direction of equallty. as in a closed economy.
2.3.1 The Stocks of Foreign Capital
In this section we examine the extant data on foreign capital stocks to get some sense of the evolution of the global market. AIthough the concept is simple, the measurement is not. Perhaps the simplest measure of the activity in the global capital market is obtained by looking at the total stock of overseas investment at
a point In time. Suppose that the total asset stock in country or region i, owned
by country or region j, at time tis Aij/' lncluded in here is the
domestically-, '.
42
Globali:.atioll in Capital Markets: The Long-Rull Evidenceowned capital stock Aiit. Of interest are two concepts: what share of lhe total
assets of country
j
are held overseas? and what share ofthe Iiabilities of countryi are held overseas? Essentially, we are interested in the measures
ForeignAssetsShareit = LAjir!LAjit; (2.1 )
j#1 j
Foreign Liabilities Shareit LAijr!LAijt. (2.2)
j#i j
Note that here we are concerned with net wealth and asset measures, since we want to identify the extent to which the net wealth of a country is held in its own versus others' portfolios. There is, then, a complication to our measures, since, over the long-run timescales we are dealing with, there has been a vast multiplication in the ratio oftotal assets to net weath and total assets to GDP. This is because financiai development, and the increasing sophistication of national capital markets, has allowed the capital stock of each economy to be packaged and repackaged in various asset bundles, which may be held by a chain of assets and Iiabilities in various financiai intennediaries between the physical asset itself and the ultimate net wealth owner. At the international levei, we also need to keep the net wealth question in perspective, but the problem is somewhat simpler in the sense that ali net foreign claims are true net c1aims on a natIonal economy: should ali creditors show up demanding paymenl, lhen, even after a country Iiquidates its own foreign holdings, it will still need to hand over an amount of its own net wealth equal to the net c1aim. In that sense, net foreign Iiabilities represent a claim on an economy's net wealth. Thus, in ali
that follows we must be careful to keep this distinction in mind.10
A relatively easy hurdle to surmount concerns nonnalization of the data; foreign investment stocks are commonly measured at a point in time in current nominal terms, in most cases U.S. dollars. Obviously, both the growth of the national and international economies might be associated with an increase in such a nominal quantity, as would any long run inflation. These trends would
have nothing to do with market integration per se. To overcome this problem,
we elected to normalize foreign capital at each point in time by some measure of the size of the world economy, dividing through by a nominal size indexo
The ideal denominator. given that the numerator is the stock of foreign-owned capital, would probably be the total stock of capital. However,
construct-ing long-run time-series for national capital stocks is fraught with difficulty. 11
10. For cross-country evidence on the evolution of financia! assets as a fraction of output see Gold-smith (1985).
2.3 Quantity Criteria 43
Given these problems we chose a simpler and more readily available measure
of the size of an economy, namely the levei of output
Y
measured in currentprices in a common currency unit.12 Over short horizons, unless the
capital-output ratio were to move dramatically, the ratio of foreign capital to capital-output should be adequate as a proxy measure of the penetration of foreign capital in any economy. Over the long run, difficulties might arise if the capital-output ratio has changed significantly over time - but we have little firm evidence to
suggest that it has.13 Thus. our analysis focuses on capital-to-GDP ratios of
the form
Foreign Assets-to-GDP Rati0it
Foreign Liabilities-to-GDP Rati0it
L
Ajir/Yit ; UiL
Aijr/Yi!. Ui(2.3)
(2.4)
A still irksome empirical problem, however, arises for the numerator. It is in fact very difficult to discover the extent of foreign capital in an economy using both contemporary and historical data. For example, the IMF has always
reported balance-of-payments ftow transactions in its lnternationai Financiai
Statistics. It is straightforward for most of the recent postwar period to discover
the annual flows of equity, debt, or other forms of capital account transactions
fram these accounts. Conversely, it was only in 1997 that the IMF began
reporting the corresponding stock data, namely, the international investment
position of each country. This data is also more sparse, beginning in 1980 for
less than a dozen countries. and expanding to about 30 countries by the
mid-estlmates are accurate only at benchmark censuses. and in between census dates they rely on comblnations of interpolation and estimation based on investment fiow data and depreciation assumpttons. Most ofthese esttmares are calculared in real (constanr price) rather than nominal (current pnce) rerrns. which makes them incommensurate with the nominally measured foreign caflital data. At the end of the day. we would be unlikely to find more than a handful of countries for whlch thls technique would be feasible for the entire twentierh century. and certainly nothing lik.: global coverage would be posslble even for recent years.
12 For the GDP data we rely on Maddison's (1995) constant price 1990 U.S. dollar estimares of output for the period from 1820. These figures are then "reflared" using a U.S. price deflator to obtaln estimates of nominal USo dollar "World" GDP at each benchmark date. This approach is crude. stnce. in particular. it relies on a PPP assumption. Ideally we would want historical series on nominal GDP and exchange rates. to estimate a common (U.Sdollar) GDP figure at various hlstoncal dates. This is possible for a small sample of countries. notably the main creditor nattons In the disrant pasr; it is also possible for the last few decades for almost alI countries. \Ve follow this route when applying our method to a smaller sample group of countries. 13 But for exactly the reasons just mentioned. since we have no capital stock data for many countries.
44 Globalization in Capital Markets: The Long-Run Evidence
1990s. The paucity of data is understandable, since the collection burden for this data is much more significant: knowing the size of a bond issue in a single year reveals the tlow transaction size; knowing the implications for future stocks requires, for example, tracking each debt and equity item, and its tluctuating market value over time, and maintaining an aggregate of these data. The stock data is not simply a temporal aggregate of fiows: the stock value depends on past tlows, capital gains and losses, and any retirements ofprincipal or buybacks of equity, and a host of other factors. Not surprisingly this kind of data is hard to collect and rarely seen. Just as the IMF has had difficulty assembling this data, so toa have economic historians. Looking back over the nineteenth and twentieth centuries an exhaustive search across many different sources yields only a handful of benchmark years in which estimates have been made, an effort that draws on the work of dozens of scholars in official institutions and
numerous other individual efforts.14 It is based on these efforts that we can put
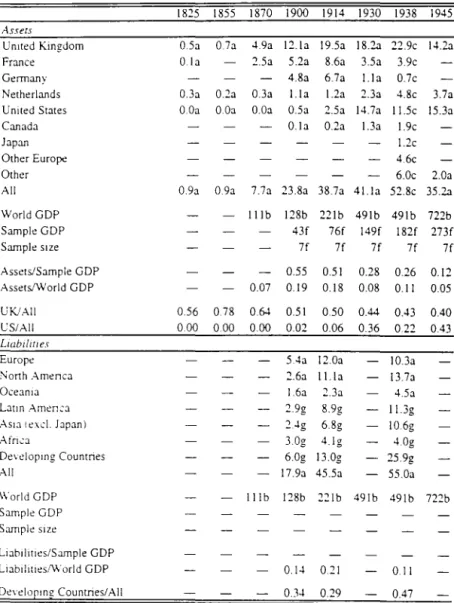
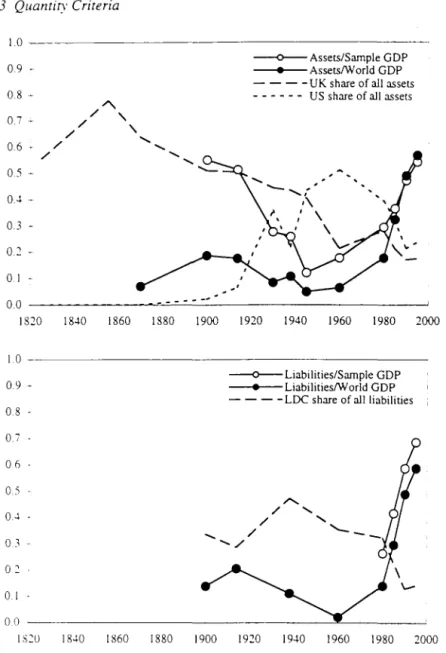
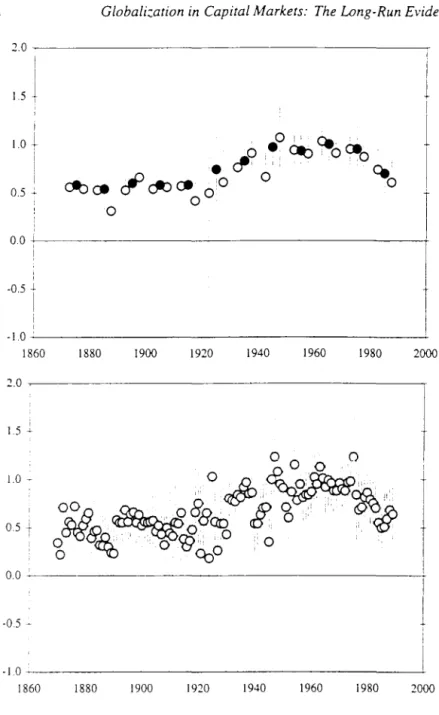
together a fragmentary, but still potentially illuminating, historical description in Table 2.2 and Figure 2. I. Displayed here are nominal foreign investment and output data for major countries and regions, grouped according to assets and Iiabilities. Many cells are empty because data is unavailable, but where possible summary data have been derived to illustrate the ratio of foreign capital to output, and the share of various countries in foreign investment activity.
What do the data show? On the asset side it is immediately apparent that for alI of the nineteenth century, and until the intcrwar period, the British werc rightly terrned the'bankers to the worId"; at its peak, the British share of total glob::d foreign investment was almost 80 perccnt. This is far above the current U.S. share of global foreign assets, a mere 24 percent in 1995, and still higher than the maximum U.S. share of 50 percent circa 1960. The only rivais to the British in the early nineteenth century were the Dutch, who according to these figures held perhaps 30 percent of global assets in 1825. This comes as no surprise given what we know of Amsterdam's early preeminence as the first global financiai center before London 's rise to dominance in the eighteenth and
nineteenth centuries.IS By the late nineteenth century both Paris and Berlin had
also emerged as major financiaI centers, and, as their own economies grew and industrialized. French and German holdings offoreign capital rose significantly, each ecIipsing the Dutch position. In this era the United States was a debtor rather than a creditor nation, and was only starting to emerge as a major lender and foreign asset holder after 1900. European borrowing from the United States in WorId War One then suddenly made the United States a big creditor. This
14. See. for example. Paish (19xx), Staley (19xx), Woodruff (19xx), and Twomey (19xx). 15. Indeed, the Amsterdam market was an important source of externai finance for Britain during
2.3 Quantity Criteria 45
Table 2.2. Foreign Capital Stocks
1825 1855 1870 1900 1914 1930 1938 1945
Assers
Umted Kingdom 0.5a 0.7a 4.9a 12.la 19.5a 18.23 22.ge 14.23 Franee O.la 2.5a 5.2a 8.6a 3.5a 3.ge
Germany 4.8a 6.7a l.la 0.7e
Netherlands 0.3a 0.2a O.3a l.la l.2a 2.3a 4.8e 3.7a United States O.Oa O.Oa O.Oa O.5a 2.5a 14.7a 11.5e 15.3a
Canada O.la 0.2a 1.3 a l.ge
Japan l.2e
Other Europe 4.6c
Other 6.0c 2.0a
Ali 0.9a 0.9a 7.7a 23.8a 38.7a 4 1.1 a 52.8e 35.13
World GDP Illb 128b 221b 491b 491b 722b
Sample GDP 43f 76f 149f 182f 273f
Sample slze 7f 7f 7f 7f 7f
Assets/Sample GDP 0.55 0.51 0.28 0.26 0.12 Assets/World GDP 0.07 0.19 0.18 0.08 0.11 0.05
UKJAII 0.56 0.78 0.64 0.51 0.50 0.44 0.43 0.40 CS/AII 0.00 000 0.00 0.02 0.06 0.36 0.22 0.43
Lwbilules
Europe 5.4a 12.0a 10.3a
North Amenca 2.6a I !.la 13.7a
Oceanla l.6a 2.3a 4.5a
LatIn aュ・ョセ。@ 2.9g 8.9g l1.3g
ASla lexd. Japan) 2.4g 6.8g 10.6g
Afn.:a 3.0g 4.lg 4.0g
Developlng Countries 6.0g 13.0g 25.9g
Ali 17.9a 45.5a 55.0a
World GDP Illb 128b 221b 491b 491b 722b Sampk GDP
Sampk slze
LiabIlIlles/Sample GDP
LiabIlltIes/World GDP 0.14 0.21 0.11
Developlng Counuies/AII 0.34 0.29 0.47
--46
Globalization in Capital Markets: The Long-Run EvidenceTable 2.2. (Continued)
1960 1971 1980 1985 1990 1995
AsseIS
United Kingdom 26.4a 551d 857d l.757d 2 .. セXY、@
Franee 736d 1.105d
Germany 1.2a 257d 342d 1.I00d 1.672d
N etherlands 27.6a 178d 418d
United States 63.6a 775d 1.296d 2.178d 3,353d
,
Canada 129d 227d 302dJapan 160d 437d 1.858d 2.725d
Other Europe
Other 5.9a
All 124.7a 1.963d 4.025d 10.321d 14.25ld
World GDP 1.942b 4.733b 11.118e 12.455e 21.141e 25.llOe SampleGDP 67lf 5.922d 8.873d 17.584d 21.479d
Sample size 7f 10d 19d 28d 29d
AssetslSample GDP 0.18 0.29 0.37 0.47 0.54 Assets!World GDP 0.06 0.18 0.32 0.49 0.57
UKlAIl 0.21 0.28 0.21 0.17 0.17
US/AIl 0.51 0.39 0.32 0.21 0.24
Liabilitles
Europe 7.6a
N orth Ameriea 12.5a
Oeeania 2.2a
Latin Ameriea 9.2a Uセg@ '", 250g 505g 768g
Asia lexel. Japan) 2.7a 29g 129g 524g 960g
Afriea 2.23 199 124g 306g 353g
Developing Countries 14.la 107g 506g 1.338g 2.086g All 39.9a 1.569d 3.685d 10.311d 1".735d
World GDP 1.942b 4.733b 11.118e 12.455e 21.141e 25.11Oe
Sample GDP 5.922d 8.873d 17.584d 21.479d
Sample size 10d 19d 28d 29d
Liabilities/Sample GDP 0.26 0.42 0.59 0.69 Liabilities/World GDP 0.02 0.14 0.30 0.49 0.59
Developing Countries/All 0.35 0.32 013 0.14
Notes and Sources:
VOlts for foreign investment and GDP are billions of eurrent U.S. dollars. a
=
from Woodruff(1967. 150-159).b
=
from t\laddlson (1995): sample of 199 eountries: 1990 US dollars converted to eurrent dollars using US GDP deflator: some interpolation.e
=
from Lewis (1945. 292-97).d
=
from lFS (9/97). Maximum 40 eountry sample 1980-1997. Sample size varies. e=
from World Bank (1994).f
=
excludes "Other Europe" and "Other": GDP data from appendix. g=
from Twomey (1998: unEublished worksheets).2.3 Quantity Criteria
1.0
0.9 0.8 セ@ 0.7 セ@
0.6
-0.5 セ@
0.4 セ@ 0.3
0.2 -0.1
/
/
'"
/
,
/
,
/
-<>--AsselS/Sample GDP
• AsselS/World GDP - - - - UK share of ali asseIS - - - US share of ali assets
0.0 MMMMMMMセセ]MM]MMZ]MMMMMMMMMMMMMMMMM
1820
1.0
0.9 セ@
0.8
0./
06
0.5
OA
0:1
02 0.1 00
IS20
1840 1860
18.\0 1860
1880 1900 1920 1940 1960 1980 2000
-<>--Liabilities/Sample GDP
• Liabilities/World GDP - - - - LDC share of allliabilities
1880
"'-/
"-/
"-... /
'-... /
1900 1920 1940 1960
Fig. 2.1. Foreign capital stocks
\....-1980 2000
47
:;
48 Globa/ization in Capital Markets: The Long-Run Evidence
carne at a time when she was ready, if not altogether willing, to assume the mantle of "banker to the world," following Britain 's abdication of this position under the burden of war and recovery in the 1910s and 1920s.16 But the dislocations of the interwar years were to postpone the United States' nse as a foreign creditor, and New York's pivotal role as a financiai center. After 1945, however, the United States decisively surpassed Britain as the major international asset holder, a position that has never been challenged. 17
How big were nineteenth century holdings of foreign assets? In 1870 we estimate that foreign assets were just 7 percent of World GDP; but this figure rose quickly, to just under 20 percent in the years 1900-14 at the zenith of the classical gold standard. During the interwar penod, the collapse was swift, and foreign assets were only 8 percent of world output by 1930, 11 percent in 1938, and just 5 percent in 1945. Since this low point, the ratio has climbed, to 6 percent in 1960, 18 percent in 1980, and then climbing drarnatically to 57 percent in 1995. Thus, the 1900-14 ratio of foreign investment to output in the world economy was not equaled again until 1980, but has now been approximately doubled. 18
An alternative measure recognizes the incompleteness of the data sources: for many countries we have no information on foreign investments at ali, so a zero has been placed in the numerator, although that country 's output has been included in the denominator as part of the World GDP estimate. This
is an unfortunate aspect of our estirr.:!t;:::;) procedure, and makcs セィ・@ above
ratio a likely an underestimate, or lower bound, for the true ratio of foreign assets to output. One way to correct this is to only include in the denominator the countries for which we actually have data on foreign investment in the numerator. 19 This procedure yields an estimate we term the ratio of foreign
16. This Anglo-American transfer of hegemonic power is discussed by Kindleberger (1986). 17. or course. lhis is lhe gross foreign inveslmenl position. nOllhe nel position. The Uniled Slales
is also now lhe world's number one debtor nalion. in bOI h gross and net lerms. She holds more liabililies lhan any olher country. ando since the early 19805, has been. on neto a debtor country. 18. However. even lhen we cannOl necessarily infer lhallhere has been an increase in foreign asseI ownership relalive 10 10lal asseIS. since lhe asseI 10 GDP ralio has risen across lhe twentielh century wilh financial developmenl (see Goldsmilh 1985). This is nOl a problem if we view ali foreign asseIs as "outside" - bUl allhough lhat mighl be reasonable for lhe nineleenth century. il mighl nOl be 50 reasonable now. In lhe pasl. mOSl assel-liabilily posilions were one way aI lhe national levei (examp!e: Brilain circa 1900). bUlloday lhe nel ftows are much less lhan lhe gross ftows (example: mOSl OECD countries loday). Hence. nOl ali foreign asseIs may be "outside" and 50 the multiplicalion of asseIs can be an issue lhal introduces biases even aI lhis levei - as when. say, a domeslic asseI is held overseas by an instilution lhal is in lum held by domestic investors. Given lhe macroeconomic aggregale dala we are dealing with here. however. lhe resolulion of lhis kind of dala problem seems impractical.
19. Thal sample of countries is much less lhan lhe entire world. as we have nOled. Unlil 1960. il inc1udes only lhe seven major credilor countries nOled in Table 2.2; after 1980. we rely on lhe
2.3 Quantity Criteria 49
assets to sample GDP. This is likely an overestimate, or upper bound, for the true ratio, largely because in historical data, if not in contemporary sources, attention in the collection of foreign investment data has usually focused on the principal players, that is, the countries which have significant foreign asset
holdings.20 Given ali these concerns, does the ratio to sample GDP evolve in a
very different way? No. It is, as expected, higher at most points, except 1985. The two ratios are very dose after 1980. But before 1945 they are quite far apart: from 1870 to 1914, the sample of seven countries has a foreign asset to GDP ratio of over 50 percent, far above the world figure of7 to 20 percent. Clearly, these seven major creditors were exceptionally internationally diversified in the late nineteenth century in a way that no group of countries is today. By this reckoning, in countries like today's United States, we still have yet to see a return to the extremely high degree of international portfolio diversification seen in, sal'. Britain in the 1900-14 period, a historical finding that sheds light
on the ongoing international diversification puzzle.21
Is the picture similar for liabilities as well as assets? Essentially, yes. The data is much more fragmentary here, with none in the nineteenth century, when the inforrnation for the key creditor nations was simpler to collect than data for a multitude of debtors, perhaps. Even so, we have some estimates running from 1900 to the present at a few key dates. The ratio of liabilities to World GDP follows a path very much like that of the asset ratio, which is reassuring: thel' are each approximations built from different data sources at certain time points. though, in principie, they should be equal. Again, the ratio reaches a local maximum in 1914 of 21 percent, collapsing in the interwar period to 11 percent in 1938, andjust 2 percent in 1960. By 1980 the ratio had risen to 14 percent. and by 1985 it had exceeded the 1914 levei and stood at 30 percent. By 1995, the ratio was 59 percent.
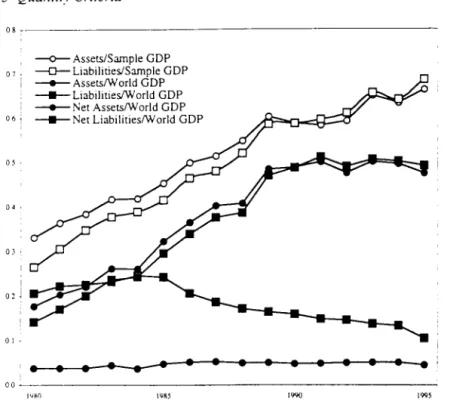
Finally, what about the distinction between net and gross stocks? A cursory glancc at the data reveals that this problem is very serious in recent decades, but relatively unimportant in the pre-1914 era of globalization. The reason is simple: in the late nineteenth century the principal ftows were long-terrn in-vestment capital, and virtually unidirectional at that. The key creditor nations,
20 tィセエ@ 15. we are probably restricted in these samples to eountries with individually high ratios of forelgn assets to GOP. For example. in the rest ofEurope eirea 1914. we would be unlikely to find countries with portfolios as diversified intemationally as the British. French. Germans. and Outch. If we included those other eountries it would probably bring our estimated ratio down. Howc'er. In the 19805 and 1990s IMF data the problem is much less severe sinee we observe
ュセョケ@ more countries. and both large and small asset holders. Sample selection might not be as biased in thls data set: for example. one of the biggest foreign investors in 1990 is France. but French data IS unavailable for most of lhe 1980s. This is interesting because it is only at the
50
Globali:ation in Capital Markets: The Long-Run Evidenceprincipally Britain, but also France and Gennany, engaged in the financing of other countries' capital accumulation, and in doing so, developed enonnous one-way positions in their portfolios. For example, circa 1914 the scale of Ar-gentine assets in Britain 's portfolio was very large, but the converse holding of British assets by Argentine 's was trivial by comparsion. Thus, the nineteenth century was an era of one-way asset shifts, leading to great portfolio diversifi-cation by the principal creditor/outftow nations like Britain, but relatively little diversification by the debtor/inftow nations. To a first approximation, the gross asset and liability positions were very c10se to net in that distant era. The 1980s and 1990s are obviously very different: for example, the United States became in this period the world's largest net debtor nation. But whilst accounting for
the biggest national stock of gross foreign liabilities, the United States also held
the largest stock of gross foreign assets.
Thus, our discussion of the stock data, and our inferences conceming the recovery of foreign asset and liabilities in the world economy after 1980 needs considerable modification to take into account this problem. And, indeed, it is a significant problem for ali of the countries concemed: the rank of countries by foreign assets in the IMF sample, is very highly correlated with the rank by foreign liabilites. Countries such as Britain, Japan, Canada, Germany, and the Netherlands are ali big holders of both foreign assets and liabilities. Strikingly, when we net out the data. the result is that, since 1980, there has been virtually
/lO change in the net foreign asset position (or liability) position in the wcdd
economy, as inàicatcd by Figure 2.2. Thus, for ali the suggestion that we have retumed to the pre-1914 type of global capital market, here is one major qualita-tive difference between then and now. Today's foreign asset distribution is much more about asset swapping by countries, than about the accumulation of large one-way positions. It is therefore more about hedging, portfolio diversifcation, and risk sharing than it is about long-term finance and the mediation of saving supply and investment demand between countries. In the latter sense, we have never come c10se to recapturing the heady times of the pre-1914 era, when a creditor like Britain could persist for years in satisfying half of its accumulation of assets with foreign capital, or a debtor like Argentina could simlarly go on for years generating liabilities of which one half were taken up by foreigners. Instead. still to a very great extent today, a country's net wealth will depend, for accumulation, on the pravision of financing from domestic rather than foreign sources. and issue we will shortly take up again in the discussion of long-run trends in capital ftows.
2.3 Quantity Criteria
PXセMMMMMMMMMMMMMMMMMMMMMMMMMMMMMMMMMMMMMMMMMMMMMMMMMMMMMMM
セ@ Assets/Sample GDP
07;
---o-
LiabilitieslSample GDPI _ Assets/World GDP
___ LiabilitiesIWorld GDP _ Net Assets/World GDP
06; _ _ _ Net Liabilities/World GDP
05 .
o' .
o:. '
02 j
OI •
....
..
--
• •
•
• •
• • • • セ@ I00---IQ!l5 1900 109\
Fig. 2.2. Foreign capital stocks
51
for 34 percent of global Iiabilities. The global capital market of the nineteenth century centered on Europe, especially London, extended relatively more credit to LDCs than does today's global capital market. Is this surprising? There are various interpretations for this observation. One is that capital markets are biased now, or were biased in the past; for example, did Britain, as an imperial power. favor LDCs within her orbit with finance? or, today, does the global capital market fail in the sense that there are insufficient capital flows to LDCs, and an excess of flows among developed countries (DCs)? These are hard c1aims to prove, as market failure could be a cause, as could a host of other factors including institutions and policies affecting the marginal product of
capital in different 10cations.22 Of course, this resultjust follows from the fact
that many of the top asset holders also figure in the top Iiability holders, and most of them are developed OECD countries. A rival explanation for the recent fali in the LDC share of liabilities, and the rise of DC Iiabilities, could be just a move toward greater - c10ser to optima!? - global portfolio diversification,
52 Globalization in Capital Markets: The Long-Run Evidence
and we might see this as an efficient rebalancing given the large weight that DC capital has in the global capital stock.
Figuring whether toa much or toa little diversification existed at any point must remain conjecturai, and conclusions would hinge on a calibrated and estimated portfolio model applied historically. This is certainly an object for future research. However, unless the global economy has dramatically changed in terms of the risk-return profile of assets and their global distribution, we have no prior reason to expect the efficient degree of diversification to have changed. For the present we can just say that, unless a massive such change did occur in
the 1914-45 period, and unless ir was then promptly reversed in the 1945-90
period, we cannot explain the time path of foreign capital stocks seen in Table 2.2 and Figures 2.1 and 2.2 except as a result of a dramatic decline in capital mobility in the interwar period, and a very slow recovery of capital mobility thereafter.
2.3.2 The Size of Flows
In contrast to the previous discussion of stocks, this section now attempts an analogous historical survey of global foreign investment ftows since the late
nineteenth century. 23 The stock data suggested a amrked diminution of foreign
investment activity in the middle of the twentieth century, with recovery to the 1900--14 leveis only seen as recently as the 1980s and 1980s. Can the fiow data detect a similar historical evolution?
Some basic definitions and notation will now prove useful. To simplify, we
may define gross domestic product
Q
as the sum of goods produced, which, withimports M, may be allocated to private consumption C, public consumption G,
investment 1, or export X, so that
Q
+
M
=
C+
1+
G+
X. Rearranging,GDP is given by
GDP
==
Q
= C+
I
+
G+
NX,
(2.5)\vhere N X = X - M is net exports. If the country's net credit (debt) position
vis-a-vis the rest of the world is B (-B), and these claims (debts) earn (pay)
interest at a world interest rate r, then gross national product is GDP plus
(minus) this net factor income from (to) the rest of the world,
GNP
==
Y
=
Q
+
rB
=
C+
I
+
G+
NX
+
rB.
(2.6)
It is then simple to show that the net balance on the current account is
C A
==
N
X+
r B
=(Y
-
C - G) - 1 = S - 1, (2.7)2.3 Quantity Criteria 53
where 5
==
Y -
C - G is gross national saving. Finally, the dynamic structureof the current account and the credit position is given by the equality of the
current account surplus (C A) and the capital account deficit (-K A), so that
t::,.B I = BI - BI_I
==
CAI = -K AI' (2.8)This section, and some that follow, will focus on the patterns of saving (5),
investment (I), and the current account (C A) as defined above. The basic
identity (2.7), C A =
5 -
I, is central to the analysis. In terrns of historicaldata collection, it proves essential to utilize the identity to measure saving
residually, as 5
=
1+
C A. because no national accounts before the 1940ssupply independent saving estimates; rather, we have access only to investrnent and current-account data.
A sense of the changing patterns of international financiai ftows can be gleaned by examining their trends and cycles. However, a norrnalization is again needed. Measurement traditionally focuses on the size of the current
account balance C A, equal to net foreign investment, as a fraction of national
income Y. Thus (C A / n/I becomes the variable of interest, for country i in
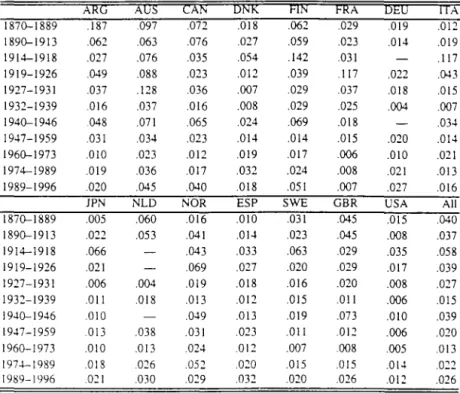
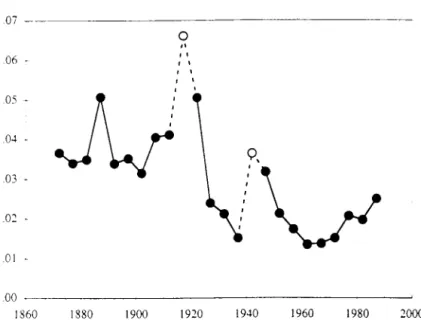
period t. a convention we follow here. Table 2.3 and Figure 2.3 present some
basic trends in foreign capital ftows. We measures the extent of capital ftows
with the mean absolute value I'lICA/Yi.I' The average size of capital ftows in
this sample was often as high as 4 to 5 percent of national income before World
\Var I. At its first peak it reached 5.1 percent in the overseas investment boom
of the late 1880s. This fell to around 3 percent in the depression of the 1890s. The figure approached 4 percent again in 1905-14, and wartime lending pushed the figure over 6 percent in 1915-19. Flows diminished in size in the 1920s, however. and international capital ftows were less than 2 percent of national in come in the late 1930s. Again. wartime loans raised the figure in the 1940s, but in the 19505 and 1960s, the sizc of international capital ftows in this sample declincd to an ali time low. around 1.3 percent of national income. Only in the late 19705 and 1980s have ftows increased. though not to leveis comparable to
those of a century ag024
Indl\idual country data supply some detail to fill in this general picture. Some countries were clearly very dependent on foreign capital inftows before 1914, including the well-known cases of the settler economies, Argentina, Australia,
and Canada. セャ。ョケ@ of these countries had typical capital inftows in excess of
5 percent of GDP, and in some years in excess of 10 percent. The Argentine figure beforc 1890 is inaccurate and surely an overstatement, as it derives from
54 Globalization in Capital Markets: The Long-Run Evidence
Table 2.3. Si::.e of Capital Flows: Average Absolute Value of CA/Y, By
Country, Selected Periods, Annual Data
ARe
AOS i:ANIJ1'lK
t:11'l
t:RA
IJEO
IrA
1870-1889 .187 .097 .072 .018 .062 .029 .019 .012 1890-1913 .062 .063 .076 .027 .059 .023 .014 .019 1914-1918 .027 .076 .035 .054 .142 .031 .117 1919-1926 .049 .088 .023 .012 .039 .117 .022 .043 1927-1931 .037 .128 .036 .007 .029 .037 .018 .015 1932-1939 .016 .037 .016 .008 .029 .025 .004 .007 1940-1946 .048 .071 .065 .024 .069 .018 .034 1947-1959 .031 .034 .023 .014 .014 .015 .020 .014 1960-1973 .010 .023 .012 .019 .017 .006 .010 .021 1974-1989 .019 .036 .017 .032 .024 .008 .021 .013 1989-1996 .020 .045 .040 .018 .051 .007 .027 .016
lPN
NLD NORESP
SWE
GBRUSA
AlI
1870-1889 .005 .060 .016 .010 .031 .045 .015 .040 1890-1913 .022 .053 .041 .014 .023 .045 .008 .037 1914-1918 .066 .043 .033 .063 .029 .035 .058 1919-1926 .021 .069 .027 .020 .029 .017 .039 1927-1931 .006 .004 .019 .018 .016 .020 .008 .027 1932-1939 .011 .018 .013 .012 .015 .011 .006 .015 1940-1946 .010 .049 .013 .019 .073 .010 .039 1947-1959 .013 .038 .031 .023 .011 .012 .006 .020 1960-1973 .010 .013 .024 .012 .007 .008 .005 .013 1974-1989 .018 .026 .052 .020 .015 .015 .014 .022 1989-1996 .021 .030 .029 .032 .020 .026 .012 .026
the rather poor quality data from this era. Even so it reveals the extent to which
foreign finance was willing to fuel an investment boom before the Baring crash
in 1890. AIso. note that. unlike the settler economies, the U.S. economy had matured by the tum of the century, and was on the verge of becoming a capital exporter. with saving and investment almost in balance.
The major capital exporter was obviously Britain. with between 5 percent and 10 percent of GDP devoted to overseas investment in a typical year before 1914. This coincided with the years of so-called "Edwardian failure" at home, and
the increasingly promising ventures for capital within and beyond the empire.25
This extraordinary net ftow of capital as a share of output has never been matched since by any overseas investing country. AlI countries shared in the collapse of capital ftows in the interwar period, and few have recovered the pre-1914 leveI
of ftows as a share of output. 26
2.3 QlIarztity Criteria
.07
06
05
-.Oo! .
.02
.0 I
-00
1860 1880 1900
o
"
I II '
I , I
1920
9,
I
19o!O 1960 1980 2000
Fig. 2.3. Slze af capital ftaws: average absolute value of CNY, 15 cauntries.
quinquennia. annual data
55
Gi\en that the size of flows is still smaller then a century ago, we would have to take this data as indicative of an incomplete recovery of global capital markets relative to their levei of integration in 1914. There still cou1d be other explanations for this path of capital flows over time, but. as in the caveats for the stock data, we would have to posit some large shock that made countries more alike. reducing the incipient flows after 1914. This is potentially
plau-sibk \\ithin the group of most developed OECD countries where productivity
convergence has taken place: but it stillleaves out the potential flows betweerz
core to periphery that. given the still large development gap between rich and poor countries today.
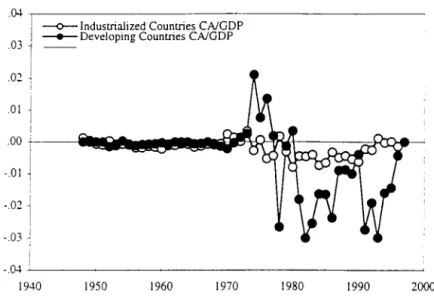
In order to confront that questiono Figure 2.4 examines the same kind of flow
data on the time series of C A / Y for the postwar period, but expanding the
samplc to encompass developed and developing countries.27 We here divide
the world into two samples. and look at the size of flows in each as a share of
from the l:nited States to Europe. inftated the size of intemational transactions. For clarity . .... anlme qumquennia (1914-18 and QYッAセVI@ are shown as open circles in the chart: note that in these penods the averages are based on incomplete samp1es.
Rセ@ We dra .... on data from the lr"vrFs InrernarlOIlQ1 Financiai Srarisrics here and in Figure 2.6. Note that because of errors and omissions it seems tha! planet earth is usually running a current account Imbalance.
"
56 Globalization in Capital Markets: The Long-Run Evidence
.w'I---{)-- Industrialized Countries CNGDP I - Developing Countries CNGDP
.03
1
I .02
セ@
-.02 セ@
I
I
-.03 J
i
-.04 - ' - - - ' 1940 1950 1960 1970 1980 1990 2000
Fig. 2.4. Size of capital ftows, postwar: CA/Y, developed and developing country samples. annual data
each region 's output. It is apparent that there has been a surge in capital flows to devclopir.g countries in the 1930s and 1990s, far exceeding any previous flows in the preceding fifty years. At peak times this flow has amounted to about 3
to -+ percent of dcvloping country GDP. and a very much smaller fraction of
developed country GDP. However,judged next to the size offlows see in the late nineteenth century, one is struck by two features of this postwar data: first. how small even the large flows in the 1990s are as a fraction of the receiving region 's output. as compared to similar receiving region in the 1890s and 19OOs; second, one is struck by the fact that this surge in inflows was not witnessed sooner in the postwar period. taking about thirty to forty years to overcome whatever impediments to capital movement there were between core and periphery. Thus, even expanding to a global sample, we argue that, most likely, the U-shape in the long-run flow data reflect the considerable shifts in the transactions costs for capital arising from policy environments which became more inimical to capital movements after 1914, and especially so after 1929. This phase of relative capital immobility has perhaps only just disappeared in the last decade or so.
2.3 Quantity Cri te ria
.60
.50 -40 セ@
.30 セ@
:0 . 10 セ@
00
- 10
(a) Ratio of capital inflows to investment for periphery economies
1 78
ARG FIN AUS CAN NOR SWE
01870-1889 1111890-1913
DNK ESP
(b) Ratio of capital outflows to saving for core economies
40
-.30 セ@
10
-00
10
-01870-1889 1111890-1913
2 0 -GBR NLD FRA DEU USA lPN
57
Fig.2.5. CapItal flows in relation to saving and investment, 1870--1913: 15 countries, quinquennia, annual data
Some natural questions to ask are: how important are the inftows as a fraction of total capital forrnation in recipient countries? and how important were outftows as a fraction of total saving for source countries?
Let us look first at the data for the late nineteenth century. Figure 2.5 displays the ratio of average capital inftows to average investment for periphery countries in our l5-country sample, and the ratio of capital outftows to saving for core countries. looking at subperiods 1870-89 and 1890-1913. Once again, the Argenune figure pre-1890 must be taken with a pinch of salt, but in several cases, especially the settler economies, we see the remarkable importance of capital
inftows for capital formation. In several economies foreign capital supplied
up to half of investment demando This squares with well-known data on the stocks of foreign capital in some of the settler economies: by 1914 about 50 percent of the Argentine capital stock was in the hands offoreigners: for Canada
,
.
58 Globa/i;:ation in Capital Markets: The Long-Run Evidence
.15 , ,
-.10
.05
-.05
-.10 ,
--o--Industrialized Countries CNS
_ Developing Countries -CM
-.15
MGMiMMMMMMMMMMMMMMMMMMMMMMセ@
1940 1950 1960 1970 1980 1990 2000
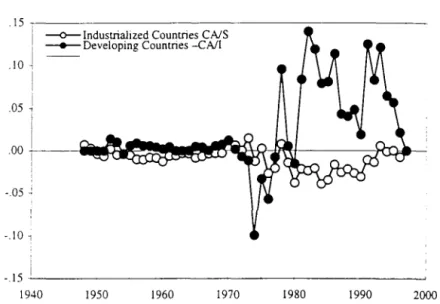
Fig. 2.6. Capital flows in relation to saving and investment, postwar: developed and developing country samples, annual data
and Australia the figure was in the range 20 percent to 30 percent. 28 Clearly
these large ftows cumulated over time into a vcry strong foreign (read, mostly British) interest in the total capital stock of many nations before 1914. On the sending side. the British dominance is readily apparent in the figure: about one third of total British saving was devoted to overseas investment in the 1870-1914 period; moreover, it is acknowledged that in some periods, for example
1900-13, this fraction crept as high as one half. 29 In contrast, few other capital
exporters in the core could register anything like so high a fraction of foreign investment relative to total savings, with France, Germany, and the Netherlands each registering less than 10 percent of domestic savings as destined for foreign countries in the 1890-1913 era.
Next. we again make a comparison to the contemporary era with this type of measure. Using our long run database we would find postwar ftows much lower relative to saving and investment as compared to the pre-1914 era, just as we did relative to output. But clearly we cannot satisfactorily use our existing long-run database for this question, or we open ourselves to the criticism that in focusing on our long-run fifteen-country sample we are missing the heart of the action in today's global capital market. Instead we should tum our attention to