A Work project, presented as part of the requirements of the Award of a Master Degree in Finance from the NOVA – School of Business and Economics.
Covered Interest Parity
Inês Isabel Sequeira de Freitas Serra, 318
A Directed Research project carried out with the supervision of:
Pedro Lameira
Abstract
This report aims to study the evolution of the Covered Interest Rate Parity (CIP) over the course of the last years. With the 2007 financial crisis many fundamental relationships changed, and CIP was not an exception. To infer whether or not this was an isolate event, the behaviour of the CIP during the European Sovereign debt crisis was studied. Currency pairs such as EURUSD showed significant CIP deviations during both crises. This work shows that currently, spreads are mostly explained by counterparty risk and market sentiment factors, which are extremely different factors from the ones explaining the spread during 2003-06.
1. Introduction
The Foreign Exchange Market is undoubtedly the largest and most liquid market amongst the trading markets, accounting for an average $4 trillion daily turnover, BIS (2010). This is a global market as cross-border transactions account for 65% of the overall transactions while local transactions are only 35%. The Spot market turnover embodies 37% of the Foreign Exchange market overall turnover, while the outright forward turnover is $475 billion. Even though the forward turnover is lower than the spot market, it grew 31% since 2007, and the outright forward market will be the focus of our thesis.
Expectations are key drivers of the Foreign Exchange market. An investor that is willing to hedge risk is able to know today what foreign exchange rate he will pay in a certain date, engaging on a forward exchange rate contract. This forward exchange contract can be replicated by using the spot exchange rate and the two currencies’ interest rates and even though it should give the same price, under the Covered Interest Rate Parity, it can be misaligned. If one trades on this price discrepancy he is arbitraging it, making a risk-free profit (Griffoli and Ranaldo, 2011; Baba, 2009). Arbitrage acts as the glue of financial markets, Griffoli and Ranaldo (2011), correcting the discrepancies and enhancing market efficiency, Akram et al (2007).
securities, Acharya and Merrouche (2010). The sophistication and rapid expansion of bank’s balance sheet contributed to the liquidity constraints and in the foreign exchange market it was notable that as appetite for US dollar denominated assets grew the needs for cross-currency funding increased as well, creating a US dollar funding gap (bank’s needs of US dollar short term funding), McGuire and von Peter (2009).
With this study we would like to analyse what happened to the Covered Interest Rate Parity (CIP) during the 2007-2009 financial crisis and the fairly recent European Sovereign Debt Crisis.
Baba (2009) and Griffoli and Ranaldo (2011) recognized that the CIP broke between 2007 and 2008 though it has not been tested in the recent crisis.
We will firstly go through what is the Covered Interest Rate Parity, its implications and the 2008 and 2011 crises, what is different and what is alike. Then we will have a more empirical approach to the Covered Interest Rate Parity, trying to explain its behaviour amongst a selection of currencies.
2. Covered Interest Rate Parity
Behind the pricing of outright forwards we have two main rules, being the Law of One Price and the Covered Interest Rate Parity, Akram et al (2007). The former states, “In an efficient market, all identical goods must have only one price”, while the Covered Interest Rate Parity gives a more insightful approach to the Foreign Exchange Market. The CIP illustrates the relationship between the interest rates of two distinct currencies and the underlying spot and forward exchange rates – Equation 1 –, where 𝐹!,!
!
is the rate one is willing to exchange currency x for currency y at time t and 𝑆!,! is
the current exchange rate, 𝑖!! and 𝑖!! are the returns (interest rates) of holding currencies
(1)
(2)
(3) 𝐹!,!
!
=𝑆!,!×(!!!!
! )
(!!!!! )
In order to have the same price on both sides of equation 1 there is the No-arbitrage rule, Griffoli and Ranaldo (2011). This rule implies that an investor cannot profit when borrowing a domestic asset and lending a similar foreign asset, hedging the exchange rate risk by engaging in a forward contract. Thus, whenever z1,t equals zero
Equation 2 holds.
𝑧!,!=
!!!,! !!,! 1
+𝑖!! − 1+𝑖!!
However, this rule has some limitations, amongst them not taking into account transaction costs, which can be captured by using bid and ask quotes, as illustrated in the third equation, where B represents a bid quote and A an ask quote, Griffoli and Ranaldo (2011).
0=!!,! !,!
!!, ! !,! 1+𝑖!
!,!
− 1+𝑖!!,!
Despite mitigating the transactions costs there are still some building blocks of the Covered Interest Rate Parity that might have become problematic with the recent crises, Baba et al (2009). Risks such as liquidity, counterparty and measurement are not supposed to go beyond the trivial risks of a standard transaction. So, whenever market perceives these risks, they should be priced on the financial instruments. When it is not priced correctly then we might observe some deviations to the CIP. The next topic will analyse what changed in order to make these risks more important when pricing outright forwards.
3. Market turmoil in 2008 and 2011
financial distress. Therefore, it is interesting to understand what happened in the 2007-2009 financial crisis and in the 2011 European Sovereign Debt crisis.
3.1. 2007 – 2009 Financial Crisis
“The functioning of money markets was severely impaired in the summer of 2007, and even more so following the failure of Lehman Brothers in September 2008. What
had begun as a deterioration in a relatively limited segment of the US subprime
mortgage sector quickly spread to other markets, especially those of credit and
securitized products” (BIS, 2008; IMF, 2008)
Melvin and Taylor (2009) found that the FX market was the last market to suffer from this crisis, as the rates market started to be more volatile in the early summer of 2007 and the equities market in July. Only in August 2007 the financial crisis had finally an impact in the FX market, with the unwinding of many carry trades leading to major losses to numerous investors.
Since August 2007 several indicators showed a different behaviour enlightening the volatility and uncertainty that the market was experiencing. Baba et al (2008) concluded that the reluctance to lend to other financial institutions, especially European financial institutions increased the liquidity needs at an uninterrupted pace.
On August 9th, 2007 3-months Libor OIS spreads soared 25 bps above the average spread up until that date, representing a 7 standard deviation movement. However, on March 20, 2008, the unlikely event of a 16-sigma movement occurred, identified in Taylor and Williams (2008) work. Fender and Gyntelberg (2008) acknowledged that during Lehman’s collapse this spread exploded by a factor of 3 to 5 times.
embedded in the rates of one currency versus the other. Taking the 1-year USD cross currency basis swap as an example, one could see that it averaged 2 to 3 bps before 2007. During Lehman’s collapse this exploded from -20 bps to -130 bps, after this event the swap value never got back to the previous average, stabilizing around -30 bps.
Moreover, the FX swap market was also experiencing some disruptions. Baba et al (2008) identified spreads between the FX swaps implied rate and dollar Libor reaching 45 bps when funding is in euros. In both cases the spreads did not return to the previous averages representing a persistent dislocation of the short-term Covered Interest Rate Parity.
Fears of counterparty risk towards European financial institutions were aggravated by rumours of several cuts of US dollar financing lines to European banks. European banks then tried to build up reserves of US dollars which associated with US dollar’s safe haven status and the unwinding of carry trades culminated in the FED being forced to introduce USD swap lines as Fender and Gyntelberg (2008) concluded.
Sometimes, this type of policy intervention has unpredictable results, which may create difficulties when measuring the funding costs and can be the origin of some CIP deviations.
3.2 2010-2011 European Sovereign Debt Crisis
Shortly after the 2007-2009 global financial crisis Europe started to show evidences of a possible European Sovereign Debt crisis. On May 2010, Greece’s crisis culminated on a joint bail out from the European Union and the International Monetary Fund. Despite Europe’s effort to contain this bail out and make it an isolate event, Ireland and Portugal also had to be bailed out. Furthermore, several European countries such as Italy and Spain are implementing strict austerity plans in order to avoid similar fate.
Despite the fact that this is more a sovereign counterparty risk driven and local crisis, the Euro has been affected by it, trading heavily on rumours and news. Even though it is not clear that this is a liquidity crisis, on December 2nd, 2011 there was a joint intervention of several central banks regarding the extension of swap lines. Markets started to head towards 2008 values, for instance when 1-year EURUSD cross currency basis reached -100 bps investors started to be worried about the funding liquidity and this intervention might have worked as a reassurance to investors about the normal functioning of financial institutions. We expect that this crisis created some deviations of the CIP at least on EURUSD, which we will study later on.
(4)
4. Methodology
To address our objective of analysing the evolution of the Covered Interest Rate Parity over the course of years, four approaches were used. In each scenario the underlying forward is constructed using forward points (market forward exchange rate), which are then compared to forward rates assembled with Libor rates, Deposit Rates, Overnight Index Swaps and Futures for International Money Market dates. Each comparison will yield a time series of spreads, which will be the base of our results. From that time series we want to know if it is stable across time, what is the percentage of significant spreads, the recurrence of that type of events and what is the relationship with the tenors.
Hence, the first step will be to find the market forward exchange rate. The outright forward is priced using the spot exchange rate that is in the market when the contract is booked with an adjustment, the “forward points”, representing the interest rate differential between the two currencies – Equation 4 –, Microfinance Currency Risk Solutions. “Forward points”, which can be found on Bloomberg, are usually quoted in pips that go until the fourth decimal place, although this depends on the convention of the underlying currency (if it is quoted with only two decimal places then pips will represent also two decimal places, as it happens with the Japanese Yen)1.
𝐹!,! !
=𝑆!,!+ !!!,!
!
!".!!!
Since this is the type of forward used in the market the remaining representations will be a more theoretical approach (following Equation 1), being good replications of the contract when attempting to arbitrage the Covered Interest Rate Parity.
1
a. Forward vs. Libor Forward
The first approach will be comparing the market outright forward with a forward constructed using Libor Rates (London Interbank Offered Rate). A Libor rate is issued by the British Bankers’ Association and represents the average rate at which a contributing institution2 can obtain unsecured funding for a given period of time in a given currency in the London money market, Smith (2010).
Despite the fact that transactions may not be booked with this offered rate, Libor rates are the benchmark for several financial instruments such as futures, swaps and currencies as they reflect the most accurate cost of borrowing, echoing risks accessed by each bank. Unlike the Fed funds rate that is an overnight rate this is a term rate3.
b. Forward vs. Deposit Rate Forwards
As having an indicative rate might not be enough to replicate an outright forward exchange rate contract, a deposit rate represents a real rate, which is quoted through the day and is the rate at which transactions occur.
Smith (2010) defined Liquidity risk as the premium asked by banks/investors that compensates the fear of having illiquid assets that might not trade easily, insuring that this will not affect the remaining portfolio when unwinding positions.
A Deposit Rate reflects the interest rate that a bank charges over lending or pays when borrowing a currency for a specific tenor. This rate will once again reflect a risk assessment from banks, mostly on liquidity risks, thus this rate is supposed to be accurate.
2
Each institution is asked the following question: “At what rate could you borrow funds, were you to do sob y asking for and then accepting interbank offers in a reasonable Market size just prior to 11 am London time?”
3
c. Forward vs. Overnight Index Swap Forward
Likewise, we want to test the Covered Interest Rate Parity under a scenario where banks do not have direct intervention and counterparty risk is better accessed. Smith (2010) defined counterparty risk premium as the compensation needed to counterweigh potential losses in an event of default if the probability of default of a major financial institution surges.
Unlike the previous two term rates, an Overnight Index Swap is a swap where a counterparty swaps its term rate by an overnight rate or vice-versa4. The two counterparties agree to exchange at maturity the difference between the interest accrued on the fixed rate and the interest accrued on the floating rate, without ever exchanging the notional amount. This increases banks’ liquidity without being tied to the term interest rate as they are paying overnight rates. The counterparty risk decreases since the exposure in this transaction is only to the profit and loss of the difference between the two interest rates as Cooper et al (2001) concluded.
Thus, we suppose this rate is a better proxy for the theoretical forward as it tries to mitigate liquidity risk and counterparty risk as much as possible, being closer to the CIP definition.
d. IMM Dates (Forward vs. Future)
Besides the traditional market one can also trade on the International Money Market. This market is inside the Chicago Mercantile Exchange and it represents the standardized market for trading of currency and interest rates futures and options. These standardized contracts have specific maturity dates, which are always on the third Wednesday of March, June, September and December.
4
(5)
(6)
A currency future is a contract where it is agreed to exchange one currency for another at a specific date at the future price, fixed when this is purchased. These futures have physical delivery unless they are contracts for difference as it happens with Brazilian Real (BRL) or Chinese Yuan (CNY).
It is interesting to explore this side of the market as in principle the forward and future prices should be different due to the daily resettlement of the future as Harvey and Huang (1991) acknowledged, but Cornell and Reinganum (1981) and Hodrick and Srivastava (1987) studies evidenced that these should move closely together. Thus with this approach besides testing the Covered Interest Rate Parity, we will be able to see if both contracts remain to move closely in our sample.
e. Constructing the Spread
Once all forwards are computed according the CIP equation (1), the two forwards will be compared using a spread (in basis points) calculated according to the following equation (5) where 𝐹!,!
!
is the Market Forward and 𝐹!,!! ,!
is the theoretical forward.
𝑆𝑝𝑟𝑒𝑎𝑑= 𝐹!,!
! −𝐹!,!!
,!
𝐹!,!! ×
10.000
This spread can also be seen as the profits from arbitraging the CIP as one is taking into account the difference between the two forwards weighted by the market forward.
However, the spread is not significant at all times as sometimes it represents only brief deviations that are quickly corrected. Then, it is important to define an interval where the spread is significant, and dislocations of the CIP are profitable, shattering all transaction costs. Equation 6 defines this interval, where 𝑆! is the daily Spread, 𝑆 the
subgroup of significant observations, 𝜇 the sample average and 𝜎 the standard deviation.
5. Empirical Application
In this section we aim to explain the more practical aspects of this study, like the currencies and maturities used, the data sample and frequency and sources of the data used.
Amongst the wide range of currencies we chose to study the Covered Interest Rate Parity in G10 currencies (developed market currencies), taking as examples the following crosses: EURUSD, GBPUSD, AUDUSD, USDCHF and USDJPY. The reasoning behind these currencies is associated with their liquidity, which in theory should be higher than in emerging market pairs, as investors and banks more often use these currencies. Thus, associated instruments will be also more liquid and easier to trade on. Griffoli and Ranaldo (2011) concluded that this was a US Dollar driven effect explaining why all pairs are against the US dollar.
We focused our study on short-term maturities, as we believe that the deviations would be more frequent in shorter tenor contracts and once again these are traded more often, favouring liquidity, therefore we used maturities between 1 month and 12 months. However, for the sake of brevity we focused our results on 1, 2, 3, 6 and 12 months maturities (the remaining results can be provided upon request).
Our sample was between 17/11/2003 and 30/11/2011, as we wanted to capture the deviations before, during and after both crises, whenever possible.
apart from the futures, forward points, spot exchange rates and interest rates all have the same closing time5.
All data was retrieved from Bloomberg although Bloomberg resorts to ICAP to provide a time series of the forward points.
6. CIP deviations – Results
The previous sections explained how to test the Covered Interest Rate Parity. This section will now focus on the results of our method.
As expected, across all currencies and maturities we saw that before 2007 the spread (Equation 5) was close to zero and relatively stable. During 2007 there were already some disruptions in the spread. However, in 2008, after the Lehman’s collapse, in September, the spread soared 40 basis points in many cases. Shortly after the beginning of 2009 the spreads plummeted, though in three pairs we could see that the spread did not go back to the previous average, staying above/below the zero average incessantly. As expected the EURUSD is the currency that showed more the effects of the European Sovereign Debt Crisis, presenting an increasing spread for the past months – Appendix 1.
Whenever the base currency6 is not the US Dollar as it happens with EURUSD one could see that the spread is positive most of the times – Appendix 1. In such pairs it is as if we were long US Dollar (USD) as we want to exchange the base currency for USD, therefore we want to buy USD. When the base currency is the US Dollar, in currencies such as USDCHF, the spread has a negative value and it is like we are short
5
Libor rates only have one data point a day at 11am London Time or 11am Brussels time for Euribor.
6
USD. These results confirm Griffoli and Ranaldo’s (2011) conclusion that this is a US Dollar driven event.
Turning now towards the results by currency we decided that a reasonable way to present it was to analyse the percentage of exceptions, in spread observations that were significant (Equation 6), on a first stage, and thenceforth if there were two or three consecutive significant spreads gathering the currencies that have US dollar as a base currency and the ones that have other currency as a base currency in another group. As this is a daily data sample and thinking from a trading perspective, it is important that these opportunities of arbitrage are not too shortly lived so that it is possible to act on them. Beside analysing the full sample (2003-2011) we will then focus on the subsamples that incorporate each financial crisis, one between 2007 and 2008 and the other between 2010 and 2011 and in these two samples we will use a more robust volatility filter, with a two times wider band of standard deviation.
a. EURUSD, GBPUSD, AUDUSD
A first look at the results of the three currencies in the full sample showed that Spreads based on OIS rates presented a lower frequency of significant spreads, which was according to our line of thought, decreasing the risks as much as possible would also minimize the dislocations – Tables 1a to 1c. Surprisingly, the Deposit Rates based spreads yielded the highest number of significant spreads in most cases, which could be due to idiosyncrasies in data. Libor based spreads did not present a consistent behaviour as tenors increased and on average the 3-months spread was the one presenting the lowest frequency of significant spreads.
always below 70%, and this percentage increased on average with the increasing tenors, being as high as 89% for the 12-months, which can be explained by the higher liquidity of shorter maturities that leads to fastest corrections of pricing dislocations.
Table 1a, 1b and 1c – Summary of Significant Spreads Frequency in EURUSD, GBPUSD and AUDUSD (2003-2011)
Focusing now on the two described crises and on the OIS spread one could find evidence of very significant discrepancies of the Covered Interest Rate Parity – Table 2a to 2c. Once again the frequency of significant spreads increased with the tenors, across all three currencies. However, it was interesting to notice that unlike the full sample, where the recurrence was more likely in longer tenors, in turbulent times the shortest tenor presented on average the highest probability of recurrence, around 72%. This could bring several interpretations, though one that might fit this case is the fact that investors/banks were more worried with the very short run as they wanted to assure the Profit and Loss of their portfolio and that might lead to some measurement error disregarding the high liquidity of the 1-month maturity. While, in GBPUSD and
% Outside interval
Twice in a row
Three x in a row
% Outside interval
Twice in a row
Three x in a row
% Outside interval
Twice in a row
Three x in a row
1 Month 12,49% 10,92% 10,10% 15,11% 10,34% 8,06% 4,00% 3,19% 2,72% 2 Months 10,82% 9,34% 8,48% 14,59% 9,68% 7,63% 5,00% 4,29% 3,96% 3 Months 9,63% 8,34% 7,72% 14,16% 10,10% 8,58% 5,67% 4,77% 4,24% 6 Months 13,06% 11,73% 10,92% 16,21% 12,25% 10,15% 9,63% 8,67% 8,01% 12 Months 13,68% 12,25% 11,15% 18,16% 14,25% 12,01% 12,11% 11,34% 10,82%
EURUSD
Forward vs. Libor Forward Forward vs. Deposit Rate Forward Forward vs. OIS Forward
% Outside interval
Twice in a row
Three x in a row
% Outside interval
Twice in a row
Three x in a row
% Outside interval
Twice in a row
Three x in a row
1 Month 9,91% 7,24% 6,15% 13,49% 7,39% 4,58% 5,39% 3,67% 2,91% 2 Months 10,25% 8,67% 8,01% 13,58% 8,58% 6,48% 3,38% 3,00% 2,91% 3 Months 10,01% 9,06% 8,48% 13,73% 9,63% 7,58% 3,53% 3,24% 3,15% 6 Months 6,86% 5,39% 4,67% 18,49% 14,59% 12,11% 6,86% 5,86% 5,48% 12 Months 14,68% 13,01% 11,96% 25,12% 20,83% 18,49% 12,20% 10,63% 9,82%
GBPUSD
Forward vs. Libor Forward Forward vs. Deposit Rate Forward Forward vs. OIS Forward
% Outside interval
Twice in a row
Three x in a row
% Outside interval
Twice in a row
Three x in a row
% Outside interval
Twice in a row
Three x in a row
1 Month 16,68% 9,77% 6,82% 18,83% 10,82% 7,48% 13,01% 7,91% 5,58% 2 Months 11,44% 7,24% 5,58% 16,30% 9,29% 6,43% 8,48% 5,96% 5,05% 3 Months 9,49% 6,05% 5,20% 16,83% 9,58% 6,39% 8,87% 6,96% 6,10% 6 Months 9,15% 8,25% 7,72% 17,68% 11,01% 7,39% 9,29% 7,77% 7,01% 12 Months 13,49% 10,77% 9,34% 20,35% 13,92% 10,58% 14,59% 12,54% 11,49%
AUDUSD we saw that the frequency of significant spreads was higher in the latter sample, the same was not true for EURUSD where there were more significant spreads in the sample concerning the 2007-2009 crisis. Coincidently GBPUSD and AUDUSD were the currencies that after the first crisis were closer to the previous average.
Likewise, it was more likely to have persistent significant spreads in the first sample than in the second, on average. This could be explained by the higher awareness towards the existence of CIP deviations; hence traders act on it sooner, correcting the disruption quicker.
Table 2a, 2b and 2c – Summary of Significant Spreads Frequency in EURUSD, GBPUSD and AUDUSD (2007-2008 & 2010-2011)
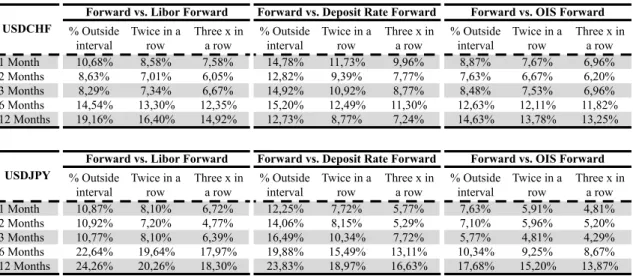
b. USDCHF, USDJPY
Once again the OIS spread disclosed the lower frequency of significant spreads on the full sample - Table 3a and 3b. Also, the Deposit rates presented a higher number of significant spreads, as seen before. In most cases the frequency of spreads increased with tenor, and the previous reasoning would be applicable here as well. One cannot forgo that the central banks of Switzerland (SNB) and Japan (BoJ) intervene more frequently in the FX market. As an example the SNB imposed a floor of the EURCHF of 1,20 last September, in order to prevent further appreciation of the Swiss Franc against Euro, likewise the BoJ printed money on a large scale after the earthquake in March 2011. The BoJ has a relatively more active role than the SNB and coincidently
% Outside interval
Twice in a row
Three x in a row
% Outside interval
Twice in a row
Three x in a row
1 Month 3,82% 3,63% 3,44% 2,40% 1,60% 1,00%
2 Months 5,16% 4,21% 3,44% 3,41% 3,01% 2,61%
3 Months 6,31% 5,74% 5,16% 3,41% 2,61% 2,20%
6 Months 7,07% 6,31% 5,54% 3,01% 2,61% 2,20%
12 Months 9,18% 8,41% 7,84% 3,01% 2,61% 2,20%
EURUSD OIS Spread 2007-2008 2010-2011 % Outside interval
Twice in a row
Three x in a row
% Outside interval
Twice in a row
Three x in a row
1 Month 4,97% 4,21% 3,63% 7,21% 6,61% 6,41%
2 Months 5,93% 5,16% 4,59% 6,41% 6,21% 6,01%
3 Months 5,93% 4,78% 4,21% 7,21% 6,81% 6,61%
6 Months 6,69% 5,54% 4,97% 7,01% 6,81% 6,61%
12 Months 8,41% 7,84% 7,27% 7,21% 6,61% 6,21%
GBPUSD OIS Spread 2007-2008 2010-2011 % Outside interval
Twice in a row
Three x in a row
% Outside interval
Twice in a row
Three x in a row
1 Month 4,78% 4,40% 4,02% 6,41% 4,41% 3,81%
2 Months 6,50% 5,35% 4,21% 6,61% 3,21% 1,80%
3 Months 6,12% 4,97% 4,02% 4,61% 2,00% 0,80%
6 Months 7,65% 6,31% 4,97% 2,61% 0,40% 0,00%
12 Months 8,41% 7,27% 6,31% 7,82% 5,61% 4,61%
AUDUSD OIS Spread
there is lower probability of having three significant spreads in a row in USDJPY than in USDCHF, 73% vs. 85% on average.
Table 3a and 3b – Summary of Significant Spreads Frequency in USDCHF and USDJPY (2003-2011)
When analysing the subsamples referring to the crisis one could see that the results were more in line with the EURUSD and like the EURUSD CIP spread these two currencies did not went back to the close-to-zero average after the 2007-2009 crisis. Thus, the frequency of significant spreads increased with tenors and its recurrence was higher in the first crisis, as it happened with EURUSD. As an example in the one-month tenor, the probability of three events in a row in USDCHF decreases from 74% to 56% from the first crisis to the latter one, and in USDJPY decreases from 88% to 52%.
Table 4a and 4b – Summary of Significant Spreads Frequency in USDCHF and USDJPY (2007-2008 & 2010-2011)
c. IMM dates (Forwards vs. Futures)
The results yielded from this comparison were not in line with what was expected and when analysing the closing hour of both contracts one could see a two-hour gap that might explain the peculiar results.
% Outside interval
Twice in a row
Three x in a row
% Outside interval
Twice in a row
Three x in a row
% Outside interval
Twice in a row
Three x in a row
1 Month 10,68% 8,58% 7,58% 14,78% 11,73% 9,96% 8,87% 7,67% 6,96% 2 Months 8,63% 7,01% 6,05% 12,82% 9,39% 7,77% 7,63% 6,67% 6,20% 3 Months 8,29% 7,34% 6,67% 14,92% 10,92% 8,77% 8,48% 7,53% 6,96% 6 Months 14,54% 13,30% 12,35% 15,20% 12,49% 11,30% 12,63% 12,11% 11,82% 12 Months 19,16% 16,40% 14,92% 12,73% 8,77% 7,24% 14,63% 13,78% 13,25%
USDCHF
Forward vs. Libor Forward Forward vs. Deposit Rate Forward Forward vs. OIS Forward
% Outside interval
Twice in a row
Three x in a row
% Outside interval
Twice in a row
Three x in a row
% Outside interval
Twice in a row
Three x in a row 1 Month 10,87% 8,10% 6,72% 12,25% 7,72% 5,77% 7,63% 5,91% 4,81% 2 Months 10,92% 7,20% 4,77% 14,06% 8,15% 5,29% 7,10% 5,96% 5,20% 3 Months 10,77% 8,10% 6,39% 16,49% 10,34% 7,72% 5,77% 4,81% 4,29% 6 Months 22,64% 19,64% 17,97% 19,88% 15,49% 13,11% 10,34% 9,25% 8,67% 12 Months 24,26% 20,26% 18,30% 23,83% 18,97% 16,63% 17,68% 15,20% 13,87%
USDJPY
Forward vs. Libor Forward Forward vs. Deposit Rate Forward Forward vs. OIS Forward
% Outside interval
Twice in a row
Three x in a row
% Outside interval
Twice in a row
Three x in a row
1 Month 5,93% 4,97% 4,40% 5,01% 3,61% 2,81%
2 Months 6,69% 5,74% 4,97% 5,21% 3,61% 2,81%
3 Months 7,46% 6,88% 6,31% 4,81% 2,81% 1,80%
6 Months 7,27% 6,31% 5,54% 4,41% 3,01% 2,20%
12 Months 9,37% 8,03% 6,88% 4,41% 3,01% 1,80%
USDCHF OIS Spread 2007-2008 2010-2011 % Outside interval
Twice in a row
Three x in a row
% Outside interval
Twice in a row
Three x in a row
1 Month 4,59% 4,21% 4,02% 4,61% 3,21% 2,40%
2 Months 5,74% 4,97% 4,40% 5,41% 4,61% 4,21%
3 Months 5,54% 5,16% 4,78% 4,81% 4,01% 3,61%
6 Months 6,50% 5,93% 5,35% 3,61% 3,01% 2,61%
12 Months 7,27% 6,31% 5,54% 3,61% 3,01% 2,81%
USDJPY OIS Spread
Overall, one can conclude that the OIS is the least noisy measure, not only from the graphs but also from the number of exceptions itself. In most currency pairs there was a positive correlation between the frequency of significant spreads and the tenors and the probability of having significant spreads for several days was higher during the 2007-2009 financial crisis.
7. Explaining the CIP deviations
After seeing how the Covered Interest Rate Parity evolved in the past years we believe that it is important to try to explain at least some of these movements.
Our approach will be of defining the variables we will use, applying them to the spread time series and try to withdraw some conclusions. In this case we will focus on the one-month spread based on forwards constructed with the Overnight Index Swaps, (the results for the remaining maturities are available upon request). Applying the same full sample as before, we then subdivided the samples in two subsamples, one comprising the period between 2003 and 2006 and another after 2006, as we believed that the factors that explained the spreads of the Covered Interest Rate Parity were different before the two crises. The ultimate goal is to find if there are common and significant factors to some of the currencies, thus all factors will be the same for all currencies except the ones that are currency specific. We did two types of models, the first is a static regression model, where variables are contemporaneous, and the second is a finite distributed lag model, where factors have a one-day lag relative to the explained variable, the spread. As the results were similar, we opted to present the ones from the finite distributed lag model.
into the same groups, being some of them coincident to the ones used by Griffoli and Ranaldo (2011). However we subdivided the liquidity factors into funding liquidity (y) and market liquidity (z).
To assess the counterparty risk (x), as we defined it by the risk associated to financial institutions default risk, one used the average Credit Default Swap rate of a selection of financial stocks7 and the financial sub-indices of STOXX 500 (SX7E) and S&P500 (BKX), which comprises the major European Financial Stocks and the American Financial Stocks, respectively. Even though both are related to financial institutions it is important to distinguish the two effects on the CIP spread as CDS’ are more related to the bond market and the indices are from the stock market, thus we can filter which market affects most the CIP spread or if both affect similarly. As market sentiment proxy variables we decided to include the VIX, as this index of the volatility of S&P500 options reflects mostly what the market expects of volatility over the following thirty days; Gold since this commodity is seen as an alternative currencies that investors resort to when the market is facing turbulent times; Oil as this commodity is very sensitive to changes in expectations of global economic growth; The respective currency pairs one-month implied volatility (volatility quoted for options); and 1-month Libor-OIS Spread because OIS is based on rates set by the central banks and if we subtract it from the Libor rate, which is the rate charged between banks, one obtains the actual interest rate that is being charged for the credit risk.
When considering funding liquidity one should think about the simplicity of an investor/bank to obtain funding while market liquidity concerns how easily and
7
(7)
instrument is traded as defined by Brunnermeier and Pedersen (2009). We considered as factors associated to funding liquidity, the size of FED Swap Lines as these were introduced in the market to ease the interbank funding stress; the one-month – one-week OIS spread because this can be a proxy of the rollover risk reflecting the difference between unwinding a position after one week instead of the plan of one month (Griffoli and Ranaldo (2011)); and TED Spread8 as Brunnermeier and Pedersen (2009) and Griffoli and Ranaldo (2011) believed that in tempestuous times capital migrates to high quality government bond markets.
Regarding market liquidity, we used the bid-ask spreads from both instruments reflected in theoretical forwards, the spot exchange rate and the Overnight Index Swap rate. A liquid instrument should have a lower bid-ask spread so in turbulent times when liquidity is depleted from the market the spread should increase.
Below we present the regression results using the same groups as in the previous analysis and in Appendix 2 there is a summary of the significant variables9 for each regression, which according to the regression presented in Equation 7.
𝑆! = 𝛼+ 𝛽
!,!×𝑥!,!+
!
!!! 𝛽!,!×𝑦!,!+ !
!!! 𝛽!,!×𝑧!,!+
!
!!! 𝜀
10
a. EURUSD, GBPUSD and AUDUSD
If we analyse the results from these three regressions presented in Table 5, one can see that EURUSD and GBPUSD regressions have a good adjusted R2 in the full sample and in the subsample comprising the financial crises, which leads us to infer that the results of the full sample are influenced by the latter sample. The adjusted R2s from
8
TED Spread is the difference between the 3 month interbank interest rate and the currency 3 month generic bill, this was more used in for US rates, however and in order to have a TED Spread for each currency we decided to use the equivalent interest rate swap as some countries do no have a 3 month bill.
9
Significant variable: a factor is significant if its t-statistic (coefficient divided by the standard error) is above 1,96 (in absolute value) corresponding to the threshold for a 95% confidence interval of a Normal distribution
10
the 2006-2011 samples are fairly close to the results obtained by Griffoli and Ranaldo (2011) even though some variables are different. Unlike these two currencies, AUDUSD has a low adjusted R2 across all samples, being always below 50%.
Most of the currencies that are significant are related to counterparty risk and market sentiment, as expected. Gold, Oil, and Average CDS are factors significant in the three regressions and VIX is also significant in the EURUSD and GBPUSD regression for the full sample and the 2006-2011 sample. Moreover the swap lines seem to have also explanatory power in the 2006-2011 sample across all currencies, which is in line with our expectations, as well as the bid ask spread for the Overnight Index Swap Rate. Noteworthy is the shift of significant factors from 2003-2006 to 2006-2011, as in the first sample predominated market and funding liquidity factors and in the second counterparty risk and market sentiment. In all samples the F-statistic is significant so the model is deemed appropriate.
Table 5 – Summary of Significant Statistics for the Regressions on EURUSD, GBPUSD and AUDUSD
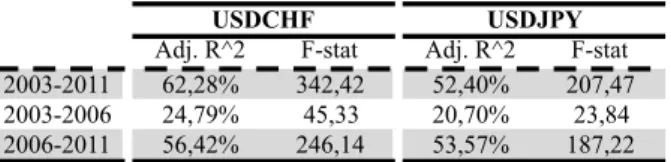
b. USDCHF and USDJPY
As seen in the previous case, the adjusted R2 is higher in the full sample and in the sample between 2006 and 2011 – Table 6. Standing out as common factors one has counterparty risk factors such as and Oil, BKX, VIX and implied volatility of the currency. As happened previously, the Swap Lines and the bid-ask spread for the OIS have explanatory power over the spread of both currencies. For both currencies the F-statistic is significant for a 95% confidence interval.
Adj. R^2 F-stat Adj. R^2 F-stat Adj. R^2 F-stat
2003-2011 60,30% 224,61 54,51% 225,81 46,45% 179,92
2003-2006 39,60% 71,99 29,99% 33,47 24,69% 60,22
2006-2011 57,59% 187,37 53,54% 141,44 45,64% 159,63
GBPUSD AUDUSUD
Table 6 – Summary of Significant Statistics for the Regressions on USDCHF and USDJPY
One can then conclude that across all currencies counterparty risk and market sentiment proxies are the most significant factors to explain the CIP deviations. Factors such as VIX, FED Swap lines and OIS bid ask spreads are significant in all regressions between 2006 and 2011.
8. Conclusion
With this analysis we can conclude that there were significant Covered Interest Rate Parity deviations across all currencies, mostly in turbulent times such as 2008. After 2008, some Covered Interest Rate Parity spreads went back to the previous average, however others such as EURUSD stabilized above the zero average and have been especially active during the European sovereign debt crisis. Thus, we can then conclude that the deviations of the financial crisis of 2007-2009 were not an isolated event as when faced with a new crisis there are again significant pricing dislocations.
From all the instruments analysed and compared to the forward market, the Overnight index swap was the one that showed more relevant and less noisy results. The frequency of significant CIP deviations is slightly high and it increases with longer tenors. From 2008 to 2011 we could see that the recurrence of these deviations decreased, which can be explained by the awareness of the mispricing, allowing traders to act on them at an earlier stage.
When we tried to explain the CIP profits, we saw that across all currencies counterparty risk and market sentiment factors dominated the regressions, and factors
Adj. R^2 F-stat Adj. R^2 F-stat
2003-2011 62,28% 342,42 52,40% 207,47
2003-2006 24,79% 45,33 20,70% 23,84
2006-2011 56,42% 246,14 53,57% 187,22
such as VIX, FED Swap lines and OIS bid ask spread for US dollar rates were significant for all currencies in the 2006/2011 sample.
9. References
• Acharya, V., Merrouche, Q., 2010, “Precautionary Hoarding of Liquidity and Inter-Bank
Markets: Evidence from the Sub-prime Crisis”, NBER Working Paper Series, Vol. w16395
• Annual Report, 2008,Bank for International Settlements (BIS)
• Akram, Q., Rime, D., Sarno, L., 2007, “Arbitrage in the Foreign Exchange Market: Turning on
the Microscope”, Journal of International Economics, 76(2), 237 – 253
• Baba, N., Nagano T., Packer F., 2008, “The spillover of money market turbulence to FX swap
and cross-currency swap markets," BIS Quarterly Review, 73-86
• Baba, N., Packer, F., 2009a, “From turmoil to crisis: dislocations in the FX swap market before
and after the failure of Lehman Brothers", BIS Working Paper no. 285
• Brunnermeier, M., Pedersen, L.H., 2009, “Market liquidity and funding liquidity”, Review of
Financial Studies, 22(6), 2201-2238
• Cooper et al, 2001, “Overnight Indexed Swaps”, Credit Suisse First Boston, Research Paper
• Cornell, B. and M. R. Reinganum, 1981, “Forward and Futures Prices: Evidence from the
Foreign Exchange Markets”, Journal of Finance, 36, 1035-1045
• Fender, I., Gyntelberg, J., 2008, “Overview: Global Financial Crisis Spurs Unprecedented Policy
Actions”, BIS Quarterly Review, 1-24
• Griffoli, T., Ranaldo, A., 2011, “Limits to arbitrage during the Financial Crisis: funding liquidity
constraints and covered interest rate parity”, NBER Working Paper Series, Vol. w16395
• Harvey, C.R., Huang R.D., 1991, “Volatility in the Foreign Currency Futures Market", Review
of Financial Studies, 4, 543-569
• Hodrick, R. J. and S. Srivastava, 1987, “Foreign Currency Futures”, Journal of International
• McGuire, P., von Peter, G., 2009, “The US dollar shortage in global banking," BIS Quarterly
Review, 47-63
• Melvin, M., Taylor, M. P., 2009, “The crisis in the foreign exchange market," CEPR Discussion
Paper 7472
• Monetary and Economic Department, 2010, “Foreign Exchange and derivatives market activity
in April 2010 - Preliminary Results”, Triennial Bank Survey, Bank of International Settlements
• Smith J., 2010, “The Term Structure of Money Market Spreads during the Financial Crisis”,
Unpublished Working Paper, NYU Stern
• Taylor, J., Williams, J., 2009, “A Black Swan in the Money Market”, American Economic
Journal: Macroeconomics, American Economic Association, Vol. 1(1), 53-83
• “Understanding FX Forwards”, A guide for microfinance practitioners, Microfinance currency
risk solutions
• Weighters, T, 2006, Foreign Exchange: A practical guide to the FX market, New Jersey, Wiley
Finance
Appendixes
Appendix 1
!10$ 0$ 10$ 20$ 30$ 40$ 50$
17/11/03$ 17/11/04$ 17/11/05$ 17/11/06$ 17/11/07$ 17/11/08$ 17/11/09$ 17/11/10$ 17/11/11$ EURUSD&Spread&
!10$ 0$ 10$ 20$ 30$ 40$ 50$ 60$
17/11/03$ 17/11/04$ 17/11/05$ 17/11/06$ 17/11/07$ 17/11/08$ 17/11/09$ 17/11/10$ 17/11/11$ GBPUSD'Spread'
!10$ !5$ 0$ 5$ 10$ 15$ 20$ 25$ 30$ 35$
17/11/2003$ 17/11/2004$ 17/11/2005$ 17/11/2006$ 17/11/2007$ 17/11/2008$ 17/11/2009$ 17/11/2010$ 17/11/2011$
Appendix 211
11
✓means that the variable is significant in the regression; ✗ means that the variable is not significant in the regression !50$ !40$ !30$ !20$ !10$ 0$ 10$
17/11/2003$ 17/11/2004$ 17/11/2005$ 17/11/2006$ 17/11/2007$ 17/11/2008$ 17/11/2009$ 17/11/2010$ 17/11/2011$ USDCHF'Spread' !70$ !60$ !50$ !40$ !30$ !20$ !10$ 0$ 10$
17/11/03$ 17/11/04$ 17/11/05$ 17/11/06$ 17/11/07$ 17/11/08$ 17/11/09$ 17/11/10$ 17/11/11$
USDJPY'Spread'
2003/2011 2003/2006 2006/2011 2003/2011 2003/2006 2006/2011 2003/2011 2003/2006 2006/2011
Implied.Volatility
VIX
Average.CDS
SX7E
BKX
Gold
Oil
Swap.Line
Libor.OIS.1mF1w.US
Libor.OIS.1mF1w.currency
TED.Spread.US
TED.Spread.currency
OIS.Bid.Ask.US
OIS.Bid.Ask.currency
Spot.Bid.Ask.Spread
AUDUSD
EURUSD GBPUSD
2003/2011 2003/2006 2006/2011 2003/2011 2003/2006 2006/2011
Implied.Volatility
VIX
Average.CDS
SX7E
BKX
Gold
Oil
Swap.Line
Libor.OIS.1mF1w.US
Libor.OIS.1mF1w.currency
TED.Spread.US
TED.Spread.currency
OIS.Bid.Ask.US
OIS.Bid.Ask.currency
Spot.Bid.Ask.Spread