Improving intellectual capital model using
analytic network process
Ratapol Wudhikarn #1, Nopasit Chakpitak #2, Pitipong Yodmongkol #3 #
College of Arts, Media and Technology, Chiang Mai University 239 Huay Kaew Road, Muang District, Chiang Mai, Thailand, 50200
1
Abstract—This study proposes a new approach to prioritize the key company’s indicators and relative elements following process model of intellectual capital (IC). The IC is improved by the application of analytic network process (ANP). The ANP provides the weights and priorities to all focused key performance indicators (KPIs) serving to the business concept. These obtained weights can also be passed to other relative elements, those of key success factors (KSFs) and IC categories, in the process model of IC. These prioritized KPIs, KSFs and IC categories assist the managers and decision-makers to focus on the crucial elements that mostly affect the business concept.
Keyword-Intellectual capital, Skandia model, Knowledge management, Analytic network process, Multi-criteria decision making
I. INTRODUCTION
Under current circumstance, the business model is not focusing on quality differentiation strategy and low-cost strategy anymore. One of critical up-to-date strategies is knowledge-intensiveness or knowledge management (KM), because knowledge has played an important role in the organization operations. It could deliver several competitive advantages, including asset development, continuous improvement, capability enhancement and so on. One of crucial theoretical constructions in KM is a concept of intellectual capital (IC) since the IC is a measurement method for evaluating company’s performance, especially for KM achievement [1].
In the past business model, the organizations almost completely revolved around the tangible asset management whereas in current business operation, an intangible asset is now being considered as another critical concentration as important as the tangible asset. Moreover, in several current situations, intangible assets are much greater than the tangible assets. The intangible resources constitute the method of IC, and the IC must be appropriately managed in order to deliver the highest competitive advantages. As previously mentioned, the IC is a critical path of KM. Therefore, the concentration on the IC issue is unavoidable in current business operations.
The structure of IC typically involves with the candidate indicators similar to other methods such as balanced scorecard (BSC), SWOT analysis and so on. The indicators of IC can be classified into several dimensions such as human, customer, financial, structural capital and etc. Nevertheless, the indicators of IC measurement model originally do not include the weights, so this characteristic makes the IC measurement model to lack the priority among those candidate IC indicators, and the managers have difficulties in making decision especially when they consider on the various indicators. Therefore, to correctly allocate resources and to focus on the important indicators, the prioritization among these considered indicators is critically required.
In this study, a roof tile manufacturer was facing with the decreasing revenue because of the old business model. Therefore, to improve the business performance, the company decided to apply the IC measurement by initiating at the new product selection process. This remainder of this paper is divided into five parts that are literature review, methodology, research application, discussion and conclusion, respectively.
II. LITERATURE REVIEW
accounting reports [7]. Moreover, there were attempts to reduce value of current financial accounting, and there had been endeavours to propose the alternatives of financial information via R&D effect, advertising expenditures and consumer-related indicators on the market value of organization (e.g., [8], [9], [10], [11], [12]). Moreover, some studies identified that there was the relevance between organization’s discretionary expenditures and the market value (e.g., [8], [10], [13]).
Another approach mainly focuses on the structure of the IC, practical development and adaptation of IC reports. Several studies propose various schemes and indicators for IC (e.g., [2], [3], [4], [5], [6]). These models suggest that the IC model should consist of relational capital, structural capital and human capital [14]. Whether it is empirical study or IC development model, the theme of those studies revolves around the emerging importance of IC management and provides new financial report standard. Moreover, researches agree with the importance of the IC that considers on the priority analysis of indicators of IC measurements. Nevertheless, the IC indicator selection and its priority identification are still complicated, so they require an expertise to consider on the various criteria [15]. Generally, it is difficult for the experienced decision-maker to select various IC indicators appropriately. Without a proper decision method, the decision-makers are possibly misled to make the decisions only on the unimportant criteria relating to indicators without understanding their relative weights and interactions [16].
Although the original IC method does not provide the priority of its indicators, the IC still has been respected as a necessary management method in contemporary business, since the end of 1990s [17]. The IC was identified that it can bring the wealth to organizations [4]. Therefore, several IC measurement models were proposed in the last two decades including Skandia model, IC index, technology broker, intangible asset monitor, economic value added (EVA) and market value added (MVA), and citation-weighted patents. However, one of distinctive methods that is highly accepted by several researchers is the Skandia model. Most researchers (e.g., [18], [19], [20]) agree that the Skandia model leads to evaluate an organization’s intangible assets since it looks over the traditional measurement of organization. This model also proposes an extensive focus on process and renewal and development contributions to company which has not been considered before, and moreover, the Skandia model also includes structural capital which considers on databases, personal computers and etc. as generators of actual value of organization since this structural capital is directly worked by employees and they invest the knowledge into those structures that deliver the organization’s competitive advantage.
Because of several advantages of the Skandia model, therefore, this study focuses on this model. Nevertheless, the Skandia model has some weaknesses similar to other IC methods. This distinctive flaw that is highly noticed in several studies (e.g., [16], [21], [22]) is that the IC does not include the weights of indicator. This lack of priority leads management levels to have difficulties in focusing on candidate IC key performance indicators [23]. Therefore, several studies (e.g., [16], [21], [22]) develop the prioritization of considered IC indicators by using the analytical hierarchy process (AHP), one widespread applied MCDM, that can assist companies for focusing on the most important activities first. However, traditionally, AHP does not consider the interrelationship among the indicators of IC, and, generally, the IC indicators may involve with the dependence among themselves. Therefore, the AHP is not suitable for the dependency problems, a weakness that was understood by its founder who subsequently improved the ANP to overcome this problem. After the ANP was proposed, it was applied to various dependency problems. The ANP was applied in several domains, such as product planning, product development, performance measurement, project selection and others. Nevertheless, it has not been applied for prioritizing the IC indicators before. One of closest study used the ANP with the BSC indicators to assess companies’ competitiveness performance [24]. Nevertheless, the BSC is the typical business model that concentrates only on the tangible value and ignores the intangible value. Therefore, in this study, a new approach that applies the uniqueness and advantages of the ANP with the tangible assets and intangible assets following the Skandia model is proposed.
III.METHODOLOGY
As explained in the former section, this study aims to improve the IC model following the Skandia approach by identifying the priority of its indicators with an appropriate method that is ANP. First, the indicators and all relative data must be determined following a process model of the Skandia model. This process model can be constructed by identifying business concept or strategy at the beginning. Then the key success factors (KSFs) that serve to the business concept are determined, and the key performance indicators (KPIs) which relate to KSFs are then specified consecutively. Finally, the KPIs are classified to IC category in order to create the complete IC model. The overall described process model can be depicted as Fig.1.
Fig 1. Process model of intellectual capital of Skandia model [18].
After the KPIs are obtained, the ANP processes are performed in order to deliver the priorities of considered
KPIs. In this study, to obtain the final priorities, the ANP calculation processes can be divided into4steps as
follows:
Step 1: Determine clusters and elements and model the problem as a network
Generally, in this step, the KPIs which are formerly specified in IC process model will be assigned to criteria and sub-criteria of the network. Nevertheless, in this study, the criteria are already identified in the last step of IC process model. Thence, they are assigned to a cluster. Each cluster combines the elements that have similar characteristics, and, after that, the network can be constructed by indicating relationship among elements. The relationship between elements in one cluster connected to other nodes in any other cluster is called “outer dependence”, and “inner dependence” is indicated by the connection among elements within a cluster.
Step 2: Calculate priority among elements and constructe the supermatrix
In the problem of ANP, a network generally consists of several components as well as elements within the components. The priorities from these various components and elements are derived from pair-wise comparison, and the methods used to compute and obtain the eigenvectors or priorities of the ANP are similar to those of the AHP approach. The relative importance scores of the compared elements are specified using a 1-to-9 scale, as presented in Table I.
TABLE I
Scale of analytic network process preference [25]
Intensity of
importance Definition Explanation
1 Equal importance two activities contribute equally to the objective
3 Moderate importance experience and judgment slightly favour one over another 5 Strong importance experience and judgment strongly favour one over another
7 Very strong importance activity is strongly favoured and its dominance is demonstrated in practice 9 Absolute importance importance of one over another affirmed on the highest possible order 2, 4, 6, 8 Intermediate values used to represent compromise between the priorities listed above
the consistency ratio (CR), whenever the CR is greater than 10%, the comparison is unacceptable and the judgment must be revised.
Step 3: Calculate priorities among groups and calculate weighted supermatrix
After the supermatrix or unweighted supermatrix is completely checked and consistent, then it will be changed to the weighted supermatrix in which each column is summed to one. The weighted matrix can be obtained by determining a cluster comparison to acquire a priority vector. These comparisons indicate the relative importance of influences between each cluster. Subsequently, the perceived priority vector is multiplied with related segments of the unweighted supermatrix.
Step 4: Calculate limit supermatrix and obtain the final result
In this step, the final transformed matrix, the limit supermatrix, is acquired by raising the powers on the weighted supermatrix obtained from previous step until all entries converge; at the end, all columns are the same and their values show the finial priority of each element of the network. The obtained outcomes at this stage can be used to specify the priority of considered KPIs that is the objective of this study.
As described, this research mainly focuses on two major methods including IC and ANP. In this section, the approaches to deal with those subjects are obviously described. Therefore, these identifications will be a key operation applied in the coming section.
IV.RESEARCH APPLICATION
This research was conducted following the methodology as described in the former section. The mentioned methods were applied in a real manufacturer, producing the building material product in Thailand. According to confidential data and an agreement between the researcher and the company, only permitted data can be disclosed. The focused company of this study manufactures various types of building materials including corrugated roof tiles, synthetic wood plank, ceiling and boarding. Nevertheless, in the past few years, the revenue of new customers has only slightly increased. Therefore, the company needed to increase more sales by replacing old products with a new product. Since this company had never considered the IC model before, moreover, the company was focusing with the new product selection process, therefore, this study specified the scope of IC only focusing on product selection process instead of the whole business model similar to typical IC model.
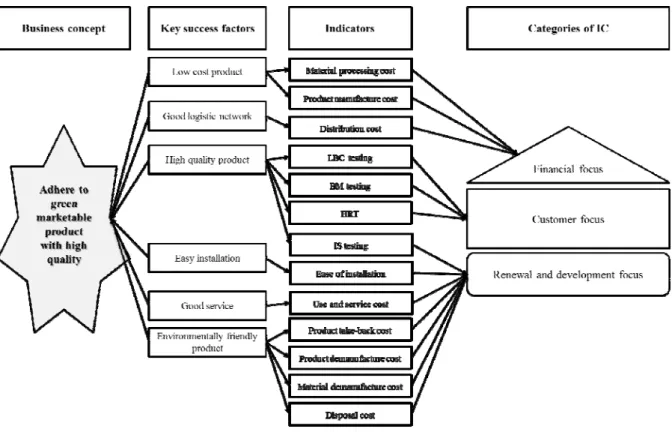
In the first part, the study focused on the process model of IC. At first, the managements were asked to identify the business strategy that directly related to the product selection. They had the consensus that the considered policies can be concluded as a strategy, that is “adhere to green marketable product with high quality”. After that the KSFs that matched to the business concept were specified by the managements, and they identified 6 KSFs including high quality product, easy installation, low cost product, good logistic network, good service and environmentally-friendly product. After the KSFs were completely identified, the relative KPIs were then also established. First, 4 KPIs consisting of load-bearing capacity (LBC) testing, bending moment (BM) testing, impact strength (IS) testing and heat rain testing (HRT) were assigned to the KSF of high quality product. Second, the serviceability or ease of installation represented another KSF that was easy installation. Third, low cost product that was one of KSFs focusing on cost dimension represented by 2 KPIs including material processing and product manufacture. Next, the good logistic factor could be represented by distribution cost indicator. Fifth, use and service indicator was assigned to respond the good service factor. Finally, 4 KPIs including product take-back, product demanufacture, material demanufacture and disposal were identified to indicate the KSF of environmentally-friendly product. After all KPIs were completely identified, then they were grouped into categories of Skandia model. Nevertheless, since this study focuses on the specific area that is product selection process, therefore, all KPIs were categorized into three groups including financial capital, customer capital and structural capital. The first category is financial capital that relates to 3 typical financial KPIs; those of material processing cost, product manufacture cost and distribution cost. The second category, customer focus, consists of 3 KPIs that are LBC testing, BM testing and HRT. Finally, the remaining KPIs including IS testing, ease of installation, use and service cost, product take-back cost, product demanufacture cost, material demanufacture cost and disposal cost can be categorized into renewal and development focus. In the last category, some of quality KPIs and cost KPIs were included, so there would be a doubt that why these KPIs were not assigned to customer focus or financial focus. Since, these 7 KPIs were firstly developed in the organization, therefore, they were classified into the renewal and development category. In conclusion, the overall process model of this study can be depicted as in Fig. 2.
Fig. 2 The process model of IC of this research
After all KPIs were obtained and categorized, then the ANP calculation was consecutively conducted through the Super Decisions software version 8.5. The ANP calculation processes formerly can be executed and explained as follows:
Step 1: Determine clusters and elements and model the problem as a network
In the process model of IC, all related elements that are the KPIs were completely declared and categorized to clearly conclude all related elements and their abbreviation symbols, Table II is constructed.
TABLE II
Considered elements and their abbreviation symbols and clusters
Elements Abbreviation symbol Cluster
Material processing cost F1 Financial focus Product manufacture cost F2 Financial focus
Distribution cost F3 Financial focus
LBC testing C1 Customer focus
BM testing C2 Customer focus
HRT C3 Customer focus
IS testing R1 Renewal and development focus
Ease of installation R2 Renewal and development focus Use and service cost R3 Renewal and development focus Product take-back cost R4 Renewal and development focus Product demanufacture cost R5 Renewal and development focus Material demanufacture cost R6 Renewal and development focus
Disposal cost R7 Renewal and development focus
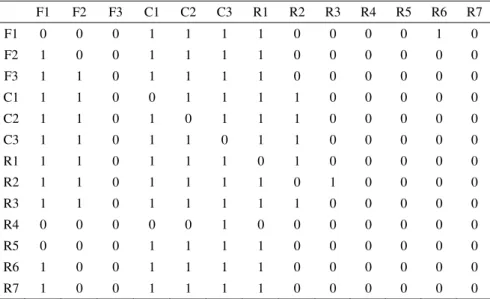
values are 0, 0, 0, 1, 1, 1, 1, 0, 0, 0, 0, 1 and 0, respectively. It implies that F1 influences on C1, C2, C3, R1 as well as R6, and, moreover, there are outer dependences between financial focus cluster and customer focus cluster as well as between financial focus cluster and renewal and development focus cluster.
TABLE IIII Influence matrix
F1 F2 F3 C1 C2 C3 R1 R2 R3 R4 R5 R6 R7
F1 0 0 0 1 1 1 1 0 0 0 0 1 0
F2 1 0 0 1 1 1 1 0 0 0 0 0 0
F3 1 1 0 1 1 1 1 0 0 0 0 0 0
C1 1 1 0 0 1 1 1 1 0 0 0 0 0
C2 1 1 0 1 0 1 1 1 0 0 0 0 0
C3 1 1 0 1 1 0 1 1 0 0 0 0 0
R1 1 1 0 1 1 1 0 1 0 0 0 0 0
R2 1 1 0 1 1 1 1 0 1 0 0 0 0
R3 1 1 0 1 1 1 1 1 0 0 0 0 0
R4 0 0 0 0 0 1 0 0 0 0 0 0 0
R5 0 0 0 1 1 1 1 0 0 0 0 0 0
R6 1 0 0 1 1 1 1 0 0 0 0 0 0
R7 1 0 0 1 1 1 1 0 0 0 0 0 0
Step 2: Calculate priority among elements and construct the supermatrix
After the influences among the elements and the clusters were identified in the former step, then, the ANP calculation process was performed. First, the priorities of element level were computed by a pairwise comparison process. The pairwise comparisons were executed only between an element and its relative elements, and the relationships can be obtained from a value in Table III. All pairwise comparisons were performed concurrently with the consistency check. After all the comparisons were done and consistent, then all the priorities were obtained. Thence, the obtained priorities were subsequently identified into the matrix termed the unweighted supermatrix as shown in Table IV.
TABLE IV Unweighted supermatrix
F1 F2 F3 C1 C2 C3 R1 R2 R3 R4 R5 R6 R7
F1 0.0000 0.0000 0.0000 0.7071 0.7071 0.7071 0.7071 0.0000 0.0000 0.0000 0.0000 1.0000 0.0000
F2 0.8333 0.0000 0.0000 0.2227 0.2227 0.2227 0.2227 0.0000 0.0000 0.0000 0.0000 0.0000 0.0000
F3 0.1667 1.0000 0.0000 0.0702 0.0702 0.0702 0.0702 0.0000 0.0000 0.0000 0.0000 0.0000 0.0000
C1 0.4000 0.4000 0.0000 0.0000 0.3333 0.7500 0.4000 0.4000 0.0000 0.0000 0.0000 0.0000 0.0000
C2 0.2000 0.2000 0.0000 0.3333 0.0000 0.2500 0.2000 0.2000 0.0000 0.0000 0.0000 0.0000 0.0000
C3 0.4000 0.4000 0.0000 0.6667 0.6667 0.0000 0.4000 0.4000 0.0000 0.0000 0.0000 0.0000 0.0000
R1 0.0629 0.1666 0.0000 0.0439 0.0439 0.0418 0.0000 0.1250 0.0000 0.0000 0.0000 0.0000 0.0000
R2 0.1108 0.0938 0.0000 0.0914 0.0914 0.0983 0.0851 0.0000 1.0000 0.0000 0.0000 0.0000 0.0000
R3 0.4946 0.7396 0.0000 0.4931 0.4931 0.4561 0.5384 0.8750 0.0000 0.0000 0.0000 0.0000 0.0000
R4 0.0000 0.0000 0.0000 0.0000 0.0000 0.0385 0.0000 0.0000 0.0000 0.0000 0.0000 0.0000 0.0000
R5 0.0000 0.0000 0.0000 0.0914 0.0914 0.0928 0.0946 0.0000 0.0000 0.0000 0.0000 0.0000 0.0000
R6 0.2118 0.0000 0.0000 0.1775 0.1775 0.1707 0.1820 0.0000 0.0000 0.0000 0.0000 0.0000 0.0000
R7 0.1198 0.0000 0.0000 0.1026 0.1026 0.1018 0.0999 0.0000 0.0000 0.0000 0.0000 0.0000 0.0000
Step 3: Calculate priorities among groups and calculate weighted supermatrix
and checked. The outcomes of comparisons were assembled to become the overall cluster priorities, as shown in Table V.
TABLE V
Weighting of the cluster matrix
Quality LCC Product
Quality 0.2000 0.2000 0.3333
LCC 0.4000 0.4000 0.0000
Product 0.4000 0.4000 0.6667
The values in each section of Table V were then used to multiply with the relative segments of Table IV, and this process delivers the weighted supermatrix, as shown in Table VI.
TABLE VI Weighted supermatrix
F1 F2 F3 C1 C2 C3 R1 R2 R3 R4 R5 R6 R7
F1 0.0000 0.0000 0.0000 0.3953 0.3953 0.3953 0.3214 0.0000 0.0000 0.0000 0.0000 1.0000 0.0000
F2 0.3788 0.0000 0.0000 0.1245 0.1245 0.1245 0.1012 0.0000 0.0000 0.0000 0.0000 0.0000 0.0000
F3 0.0758 0.4545 0.0000 0.0392 0.0392 0.0392 0.0319 0.0000 0.0000 0.0000 0.0000 0.0000 0.0000
C1 0.1818 0.1818 0.0000 0.0000 0.1174 0.2641 0.1818 0.3333 0.0000 0.0000 0.0000 0.0000 0.0000
C2 0.0909 0.0909 0.0000 0.1174 0.0000 0.0881 0.0909 0.1667 0.0000 0.0000 0.0000 0.0000 0.0000
C3 0.1818 0.1818 0.0000 0.2348 0.2348 0.0000 0.1818 0.3333 0.0000 0.0000 0.0000 0.0000 0.0000
R1 0.0057 0.0152 0.0000 0.0039 0.0039 0.0037 0.0000 0.0208 0.0000 0.0000 0.0000 0.0000 0.0000
R2 0.0101 0.0085 0.0000 0.0081 0.0081 0.0087 0.0077 0.0000 1.0000 0.0000 0.0000 0.0000 0.0000
R3 0.0450 0.0672 0.0000 0.0438 0.0438 0.0405 0.0490 0.1458 0.0000 0.0000 0.0000 0.0000 0.0000
R4 0.0000 0.0000 0.0000 0.0000 0.0000 0.0034 0.0000 0.0000 0.0000 0.0000 0.0000 0.0000 0.0000
R5 0.0000 0.0000 0.0000 0.0081 0.0081 0.0082 0.0086 0.0000 0.0000 0.0000 0.0000 0.0000 0.0000
R6 0.0193 0.0000 0.0000 0.0158 0.0158 0.0152 0.0166 0.0000 0.0000 0.0000 0.0000 0.0000 0.0000
R7 0.0109 0.0000 0.0000 0.0091 0.0091 0.0090 0.0091 0.0000 0.0000 0.0000 0.0000 0.0000 0.0000
Step 4: Calculate limit supermatrix and obtain the final result
To obtain the final result, the overall priorities were calculated by raising the powers of the weighted supermatrix declared in previous step. The matrix was increased its powers until all columns of the matrix were completely similar, as presented in Table VII, and, to easily perceive the final priorities, Fig. 3 is depicted. These final priorities could be applied to identify the ranking of the considered KPIs as the objective of this study. Moreover, to clearly realize the importance among the entire process model of IC, Fig. 4 is also presented.
0.1970
0.1427
0.1089 0.1566
0.0854 0.1614
0.0071 0.0664
0.0518
0.0006 0.00380.0116 0.0067
0.0000 0.0500 0.1000 0.1500 0.2000 0.2500
F1 F2 F3 C1 C2 C3 R1 R2 R3 R4 R5 R6 R7
Weighting
TABLE VII Limit supermatrix
F1 F2 F3 C1 C2 C3 R1 R2 R3 R4 R5 R6 R7
F1 0.1970 0.1970 0.0000 0.1970 0.1970 0.1970 0.1970 0.1970 0.1970 0.0000 0.0000 0.1970 0.0000
F2 0.1427 0.1427 0.0000 0.1427 0.1427 0.1427 0.1427 0.1427 0.1427 0.0000 0.0000 0.1427 0.0000
F3 0.1089 0.1089 0.0000 0.1089 0.1089 0.1089 0.1089 0.1089 0.1089 0.0000 0.0000 0.1089 0.0000
C1 0.1566 0.1566 0.0000 0.1566 0.1566 0.1566 0.1566 0.1566 0.1566 0.0000 0.0000 0.1566 0.0000
C2 0.0854 0.0854 0.0000 0.0854 0.0854 0.0854 0.0854 0.0854 0.0854 0.0000 0.0000 0.0854 0.0000
C3 0.1614 0.1614 0.0000 0.1614 0.1614 0.1614 0.1614 0.1614 0.1614 0.0000 0.0000 0.1614 0.0000
R1 0.0071 0.0071 0.0000 0.0071 0.0071 0.0071 0.0071 0.0071 0.0071 0.0000 0.0000 0.0071 0.0000
R2 0.0664 0.0664 0.0000 0.0664 0.0664 0.0664 0.0664 0.0664 0.0664 0.0000 0.0000 0.0664 0.0000
R3 0.0518 0.0518 0.0000 0.0518 0.0518 0.0518 0.0518 0.0518 0.0518 0.0000 0.0000 0.0518 0.0000
R4 0.0006 0.0006 0.0000 0.0006 0.0006 0.0006 0.0006 0.0006 0.0006 0.0000 0.0000 0.0006 0.0000
R5 0.0038 0.0038 0.0000 0.0038 0.0038 0.0038 0.0038 0.0038 0.0038 0.0000 0.0000 0.0038 0.0000
R6 0.0116 0.0116 0.0000 0.0116 0.0116 0.0116 0.0116 0.0116 0.0116 0.0000 0.0000 0.0116 0.0000
R7 0.0067 0.0067 0.0000 0.0067 0.0067 0.0067 0.0067 0.0067 0.0067 0.0000 0.0000 0.0067 0.0000
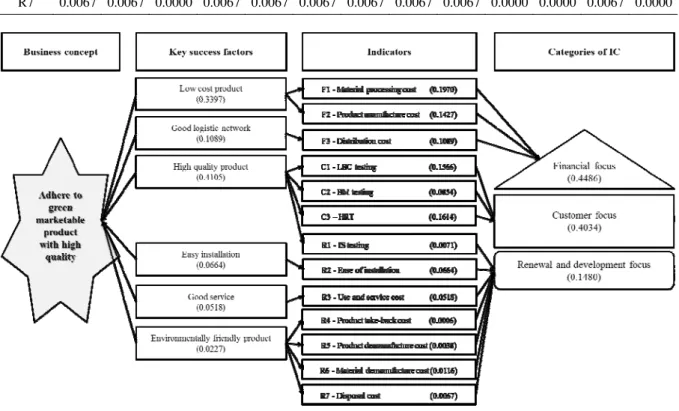
Fig. 4 Process model of IC with weights
V. DISCUSSION
As previously presented in the former section, the ANP could improve the original IC by delivering the weighting or importance of the IC measurement indicators. First, the IC relating to the new product selection process was identified and depicted in the form of typical process model as shown in Fig 2. The chart ensured that management level would have the same understanding and direction on the new product selection. Nevertheless, since the original process model of IC does not provide the priority among the focused KPIs, therefore, the ANP was then used to identify the weights for all elements as presented in Fig. 3. These acquired weights could enhance the capability of the process model by providing the importance of KPIs. Moreover, they could also be linked and combined to relative KSFs and IC’s categories as shown in Fig. 4. This improved IC model can enhance the potential of decision-making by identifying the weights for all elements that relate to the business concept. This can help the managers and decision-makers know that which area of KPIs, KSFs and IC they should focus on.
Fig. 3 and 4 indicated that the most critical KPI came from the financial element that was material processing cost (F1). Then, there were 4 KPIs from 2 categories of IC; those of financial focus and customer focus that still had high weights. These KPIs could be ranked in order as HRT (C3), LBC testing (C1), product manufacture cost (F2) and distribution cost (F3) respectively. The remainder KPIs which were less important than the previously-mentioned KPIs included BM testing (C2), IS testing (R1), ease of installation (R2), use and service cost (R3), product take-back cost (R4), product demanufacture cost (R5), material demanufacture cost (R6) and disposal cost (R7).
The developed IC model also delivered the weights among the considered KSFs. The most success factor to business concept was the high quality product, and the low cost product was the second most crucial factor. Other remaining KSFs including good logistic network, easy installation, good service and environmentally- friendly product had very low importance on business strategy since their summed weight was lower than 0.25.
Moreover, the results of improved model also suggested the focused IC on the product selection process. The most of the concentration with the new product selection process mostly depended on the financial perspective. The weight of financial concentration was 0.4486, that was considerably greater than the customer focus and renewal and development focus that were 0.4034 and 0.1480, respectively. These outcomes implied that when the organization would launch new product into the market, the critical concentration mainly relied on the costs of product. Although this process mostly focused on the financial capital, however, the customer focus and renewal and development focus were not ignored from the new product selection process. The high concentration on the financial perspective was generally found in the organizations of developing country [26]. Nevertheless, if the company wants to become the world class organization similar to other global companies, it must improve the concentration on both customer focus as well as renewal and development focus.
A crucial point of this research was the contribution of the ANP to IC. The ANP could enhance the IC measurement by considering on the relationship or dependency among the indicators, and then providing the priorities among the considered KSFs, KPIs as well as IC categories. Although, the collaboration between MCDM and IC had been formerly applied with several studies considering on university performance, telecommunication industry and organizational capital measurement, nevertheless, all of the mentioned studies only applied the AHP method which does not account for the dependency characteristic among the considered KPIs. Therefore, this study could facilitate the understanding of what indicators are crucial for the overall performances as former studies had indicated (e.g., [16], [21], [22]) and, moreover, it also improved the IC measurement over those previous studies by considering on the dependency issue among the considered indicators by using the ANP.
VI.CONCLUSION
Nowadays, IC has become another critical business model. It is widely applied as a measurement method for evaluating company’s performance. However, typically, the process model of IC consists of several and various KSFs, KPIs and IC categories which serve the business concept. From a number of these elements, the company cannot realize what element is important and which one should be concentrated on first. Since the AHP which is an improved method of ANP is identified that it can enhance the capability of IC measurement model by providing the weight or priority along with the KPIs of IC, however, the AHP does not consider on the relationship among the considered KPIs. Similar to the decision-making part, AHP cannot account on the dependency among the considered KPIs but the focused KPIs generally depend on each other. Therefore, from the mentioned reason, this study proposes a new approach to assess the company’s competitiveness following the IC measurement model. In this study, the ANP is applied to deliver the priority to the KPIs and elements, and it can better improve the capability of the IC measurement model than the AHP. The application of ANP with IC measurement model identifies the importance of KSFs, KPIs and also IC category. 6 KSFs, 13 KPIs and 3 IC categories of the product selection process are ranked, and, from these outcomes, the managements and decision-makers can perceive the priority of KPIs, KSFs and IC. These obtained priorities can be applied to better improve the company by focusing on the most important elements affecting to business strategy first.
REFERENCES
[1] G. Roos and J. Roos, “Measuring your company’s intellectual performance,” Long Range Plann, vol. 3, pp. 413–426, 1997.
[2] A. Brooking, Intellectual capital, London: Thomas Business Press, 1996.
[3] L. Edvinsson, “Developing intellectual capital at Skandia,” Long Range Plann, vol. 3, pp. 366–373, 1997.
[4] T.A. Stewart, Intellectual Capital: The new wealth of organizations, London: Nicholas Brealey, 1997.
[5] K.E. Sveiby, The new organizational wealth: Managing and measuring knowledge based assets, California: Berrett Koehler, 1997.
[10] B. Lev and T. Sougiannis, “The capitalization, amortization, and value-relevance of R&D,” J Account Econ, vol. 21, pp. 107-138, 1996.
[11] C.D. Ittner and D.F. Larcker, “Are nonfinancial measures leading indicators of financial performance? An analysis of customer
satisfaction,” J Accounting Res, vol. 36, pp. 1–35, 1998.
[12] C.D. Ittner and D.F. Larcker, “Innovations in performance measurement: Trends and research implications,” J Manage Account Res,
vol. 10, pp. 205–238, 1998.
[13] M. Klock and P. Megna, “Measuring and valuing intangible capital in the mobile communications industry,” Q Rev Econ Finance, vol.
4, pp. 519–532, 2000.
[14] R. Petty and J. Guthrie, “Intellectual capital literature review,” J Intellect Cap, vol. 2, pp. 155–176, 2000.
[15] P.N. Bukh, H.T. Larsen and J. Mouritsen, “Constructing intellectual capital statements,” Scand J Manage, vol. 1, pp. 87–108, 2001.
[16] D. Han and I. Han, “Prioritization and selection of intellectual capital measurement indicators using analytic hierarchy process for the
mobile telecommunications industry,” Expert Syst Appl, vol. 4, pp. 519–527, 2004.
[17] N. Bontis, “Managing an Organizational Learning System by Aligning Stocks and Flows of Knowledge: An empirical examination of
intellectual capital, knowledge management and business performance,” Ph.D. dissertation, Richard Ivey School of Business, University of Western Ontario, Canada, 1999.
[18] L. Edvinsson and M.S. Malone, Intellectual Capital: Realizing Your Company’s True Value by Finding its Hidden Brainpower, New
York: Harper Business, 1997.
[19] L.E. Lynn, The Management of Intellectual Capital: The issues and the practice, Ontario: Society of Management Accountants of
Canada, 1998.
[20] R. Huseman and J. Goodman, Leading with Knowledge, London: Sage, 1999.
[21] F.T. Bozbura and A. Beskese, “Prioritization of organizational capital measurement indicators using FAHP,” Int J Approx Reason, vol.
2, pp. 124–147, 2007.
[22] S.H. Lee, “Using fuzzy AHP to develop intellectual capital evaluation model for assessing their performance contribution in a
university,” Expert Syst Appl, vol. 37, pp. 4941-4947, 2010.
[23] J. Mouritsen, P.N. Bukh, H.T. Larsen and M.R. Johansen, “Developing and managing knowledge through intellectual capital
statements,” J Intellect Cap, vol. 1, pp. 10-29, 2002.
[24] R. Poveda-Bautista , D.C. Baptista and M. García-Melón, “Setting competitiveness indicators using BSC and ANP,” Int J Prod Res,
vol. 50, pp. 4738-4752, 2012.
[25] T.L. Saaty, The analytic network process: decision making with dependence and feedback, RWS Publications: Pittsburgh,
Pennsylvania, 2001.
[26] G. Jones, “Multinational strategies and developing countries in historical perspective,” Harvard Business School, Working paper,
10-076, 2010.
![Fig 1. Process model of intellectual capital of Skandia model [18].](https://thumb-eu.123doks.com/thumbv2/123dok_br/16469025.198909/3.892.152.742.103.462/fig-process-model-intellectual-capital-skandia-model.webp)