Original Article
http://dx.doi.org/10.4322/rbeb.2013.045*e-mail: [email protected]
Received: 16 August 2013 / Accepted: 19 November 2013
Medical equipment classiication according to corrective maintenance
data: a strategy based on the equipment age
Natália Ferreira Oshiyama, Ana Carolina Silveira, Rosana Almada Bassani, José Wilson Magalhães Bassani*
Abstract Introduction: Decision-making on medical equipment management is a daily task for clinical engineers, but it may prove dificult to easily extract relevant information from the large amount of data from computerized maintenance management systems. This article describes a simple method of medical equipment classiication
based on corrective maintenance indicators. Methods: Three indicators were calculated based on the number
of events, duration and cost of corrective maintenance. Three classes were deined according to the indicator values of different equipment ages: class A for 0-4 years, class B for 5-9 years, and class C for equipment older than 10 years. The method was applied to 2,134 pieces of equipment from the Health Service system
of the University of Campinas. Results: From the total, 51.7% of the equipment were classiied as C, 4.2%
as B and 44.1% as A. The infusion pump for general use was the type of equipment of which most units were in the C class (84.7%), even though almost 50% of them were acquired within less than 9 years, and would thus be expected to be classiied as A and B. Among the pumps in class C, 39.5% were from a single
manufacturer, although the equipments were acquired recently. Conclusion: The developed classiication
may be an important tool for raising alerts about equipment more prone to maintenance problems, as well as for identiication of equipments with acceptable maintenance history, supporting decision-making on equipment replacement.
Keywords Clinical engineering, Database, Indicators, Medical equipment classiication, Decision-making.
Introduction
The healthcare system has become dependent on new technologies developed to facilitate patient care.
According to data from the World Health Organization,
US$ 8,233 were spent per capita on health in the USA in 2010 (World ..., 2013), of which it is estimated that
approximately US$ 412 were destined to medical
equipment, assuming that the latter sum corresponds to
5-6.2% of the total health expenditure (Pammolli et al., 2005). The importance and considerable cost of
medical devices emphasize the need of effective
technology management toward diminishing costs,
while augmenting quality, eficiency and safety of the services provided (Bronzino, 1992).
A good management practice includes planning, acquisition, incoming inspection, inventory, installation, commissioning and acceptance, training of users and operators, monitoring of use and performance, maintenance, and replacement or disposal of equipment. Thus, collecting information on the equipment performance and maintenance constitutes a good basis for planning new acquisitions (Cheng and Dyro, 2004). This can be done by accessing the equipment
history, usually found in the databases of computerized
maintenance management systems (CMMS) available in most healthcare systems (Cohen and Cram, 2004).
Yet, due to the large amount of stored data, relevant information may not be readily accessible.
Classiication may be a useful tool in data analysis.
In order to classify items, it is necessary to establish some criteria to identify groups (classes) with similar
elements. Once the classes are deined, the items can be classiied according to the description of
the attributes of each class (Hastie et al., 2009). In this study, equipment age was chosen as the criterion for establishment of classes because, with constant use, replacement of parts tends to occur more often, and preventive maintenance may be required more frequently. This is an important criterion, since equipment reaches a point in its life-cycle at which frequent failure leads to greater downtime and
diminished cost-beneit ratio (Clark, 2004). It was hypothesized, therefore, that corrective maintenance
data (i.e., frequency, duration and cost of services,
which can be easily extracted from the database)
would provide suitable indicators for the establishment of age-based classes, on the assumption that older equipment usually fails more often than recently acquired ones. Equipment was then divided into three classes (A, B and C), in which the best maintenance performance, compatible to that of newly-acquired
equipment, characterizes class A, and the poorest
performance characterizes class C. This medical equipment classiication can help clinical engineers
identify the need for equipment replacement and manufacturer-dependent frequent equipment failure, as well as the need of training of the maintenance group or users.
Methods
A database (Microsoft ExcelTM spreadsheet) containing
information on the equipment (identiication number,
location of use, manufacturer, model, acquisition date and cost of acquisition) and corrective maintenance data (number of events, total time and total cost) was produced with data from the CMMS of the Center for Biomedical Engineering of the University of Campinas, which is responsible for the maintenance of the medical equipment of the university’s healthcare area. The data used in this study were collected from 2004 to 2009.
From the corrective maintenance data, three primary indicators were calculated: number of corrective maintenance events (NM), total time spent on corrective maintenances (TM) and corrective maintenance cost (CM), as follows.
( )
( )
= i
i
t otal Annual Number NM
median Number (1)
( )
( )
= i
i
total Annual Time TM
median Time (2)
( ) 0.06 ( _ )
= × i
i Annual Cost CM
Acquisition Cost (3)
The index i corresponds to the individual equipment
analyzed (I = 1, 2, …, n), for a total of n equipments. In order to calculate the indicator NM, the number of maintenance events for a given item was considered as
the annual average of the six years (Annual(Number)i). This value was then divided by the median of the annual number of corrective maintenances performed by the same maintenance group for all the equipments in the database (Numbertotal). The latter step makes it possible to compare the indicator values obtained from different maintenance groups, which, however, was not the case here. The same was done to calculate the indicator for total time of maintenance (TM). The cost (CM) was calculated by dividing the average annual cost of corrective maintenance (Annual(Cost)) by 6% of the equipment acquisition cost. This percentage
is within the expected range of expenditure with
corrective maintenance (3-15% of the acquisition
cost; Cruz et al., 2002) and was calculated by the straight-line depreciation method (Albrecht et al., 2010) assuming a minimum equipment lifetime of
15 years. Because the age range of the equipment in
this study was 0-14 years, the maximum depreciation
would be 6.7 % per year.
It has been accepted that, as the equipment gets older, failures become more frequent, which increases the downtime and the cost of the corrective maintenance
(Bronzino, 1992; Dondelinger, 2003, 2004). Since
this is an intrinsic characteristic of equipment in the general, it was assumed that age would be a good parameter for establishing limits for the calculation and
identiication of the maintenance proile. Three classes were then deined according to the proile of equipment
of different age ranges: A (0-4 years), B (5-9 years)
and C (>10 years). The proile was characterized by
the means
(
NM TM CM, ,)
and respective standard error (SEM) values of the indicators for the three age ranges, i.e.,(
± , ± , ±)
,j
NM SEM TM SEM CM SEM
where j corresponds to one of the three age ranges. The indicators were compared among classes with one-way analysis of variance. As it can be seen
in Figure 1, and further explained in the Results
section, the initial assumption was supported by the observation that the values of the indicators
signiicantly increased with the equipment age,
Oshiyama NF, Silveira AC, Bassani RA, Bassani JWM
indicating that the maintenance performance was the best in class A and the worst in class C.
As the standard behavior of the whole equipment
population was identiied, individual pieces of equipment could be classiied according to the values of their indicators and the ranges deined by the
mean ± SEM of each class. If, however, the value of an indicator was between the range limits of two classes, the equipment was considered to belong to the class to which the equipment’s indicator value had
greater proximity. Classiication was determined for each of the 3 indicators. The equipment was classiied
as C if at least one of its maintenance indicators were compatible with the C class. On the other hand, the
condition for the equipment to be classiied as A
was that all the 3 indicators were compatible with the A class. In all other cases, the equipment was
classiied as B. An example of the spreadsheet with the classiication of individual indicators and the inal equipment classiication is shown in Table 1.
By iltering a particular entry from the spreadsheet
(e.g. equipment type, model, age, manufacturer, location of use), scores of each individual piece of equipment may be available for post-hoc analysis,
allowing the clinical engineer to search for speciic reasons for possibly unexpected results, e.g. score
C for most of the items of a recently acquired batch of devices. The apparently “poor maintenance performance” indicated by this score might be due to several factors that would require further investigation. As the number of equipment in the database grows, robustness of the analysis increases, as it would be the limit case of large healthcare conglomerates or a nation-wide system.
Results
As shown in Figure 1, a signiicant difference between
the age ranges was observed for all corrective maintenance indicators calculated. The NM values for classes A, B and C were, respectively, 0.40 ± 0.03, 0.64 ± 0.04 and 0.78 ± 0.06 (F = 21.25; degrees of freedom = 391, p < 0.001). The values of the TM indicator were 0.38 ± 0.04, 0.69 ± 0.07 and 0.83 ± 0.09 for classes A, B and C, respectively (F = 12.51; p < 0.001), while for CM, the mean values were 0.24 ± 0.03 for class A, 1.97 ± 0.24 for class B and 2.81 ± 0.42 for class C (F = 31.03; p < 0.001). These results support the initial assumption of a positive relationship between equipment age and the occurrence of corrective maintenance problems.
From the total of 2134 equipment, 51.7% were
classiied as C, 4.2% as B and 44.1% as A. The elevated number of medical devices classiied as C
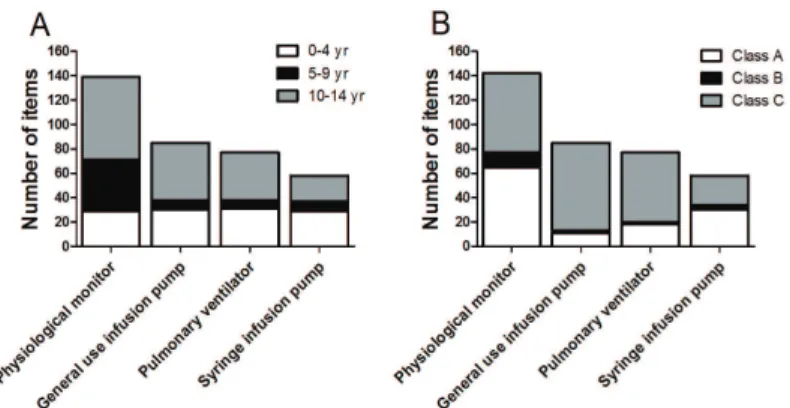
should raise alerts for further investigation, which was carried on, in this case, by the detailed analysis of four equipment types: 123 physiological monitors, 84 general use infusion pumps, 77 pulmonary ventilators, and 50 syringe infusion pumps. These types of equipment are usually located at intensive care units and operating rooms, and they are considered as high-risk devices because their failure might have
marked impact on the patients’ well-being (Melendez
and Rane, 2004; Miodownik, 2004).
Among all equipment, the general use infusion
pumps were the type with more items classiied as C (84.7%). Pulmonary ventilators also showed a
considerable trend to come under class C: 57 out of 77 units (74%) (Figure 2).
Even though almost 50% of the general use infusion pumps and pulmonary ventilators were
0-9 year-old (Figure 2B), and would thus be expected
to come under classes A and B, only 15.3% of the
pumps and 23% of the ventilators were classiied as
such (Figure 2A). This means that not always does new equipment need less corrective maintenances,
as well as that equipment classiied as C may have the maintenance proile similar to that of recently
acquired devices. This becomes more evident from the analysis of general use infusion pumps: for instance, all devices from manufacturer M54 were in the age
range of 0-9 years, yet 83.3% were classiied as C (Figure 3). This observation points out a speciic
problem concerning equipment from this manufacturer, which may be due to the equipment itself, to problems in its usage and/or its maintenance.
Discussion
The method developed in this study for the classiication
of medical equipment is simple and can be easily implemented. It is only necessary to have the corrective maintenance data from a CMMS and a program that allows the preparation of spreadsheets, such
as Microsoft ExcelTM. In developing countries, it is
common the existence of medical equipment with age greater than 10 years, which would be expected to fail
more frequently. In this case, the availability of an
equipment classiication tool to facilitate management
becomes especially valuable.
In the present method, once the equipment classes are established based on the average age, any particular device of the same equipment pool is again checked against the value ranges of the indicators for its
individual classiication. This means that it may happen that an old piece of equipment can be classiied as A
and a new one as C. The greater the equipment pool Rev. Bras. Eng. Bioméd., v. 30, n.1, p. 64-69, mar. 2014
Braz. J. Biom. Eng., 30(1), 64-69, Mar. 2014
Medic
al equipmen
t classific
ation
Id Type Local Manufact. Model Serial Age AC NM NM Class TM TM Class CM CM Class ClassiicationAge
Id1 4 6 12 24 SN1 14 2,612.01 2.5 C 0.65 B 22.95 C C
Id3 7 6 6 12 SN3 14 18,495.90 1.5 C 2.62 C 2.83 C C
Id10 7 1 33 69 SN10 14 104,980.10 0.33 A 0.00 A 0.06 A A
Id13 7 6 24 47 SN13 13 139,799.00 0.67 B 0.41 A 0.40 A B
Id22 7 6 9 17 SN22 12 17,429.40 1.5 C 1.72 C 4.62 C C
Id23 4 6 1 1 SN23 12 1,800.00 0.17 A 0.03 A 0.82 A A
Id48 7 1 18 36 SN48 11 9,886.44 0.67 B 0.07 A 0.41 A B
Id52 5 1 22 43 SN52 11 15,526.97 1.17 C 0.65 B 0.39 A C
Id89 4 1 1 2 SN89 10 1,595.60 0.83 C 0.80 C 3.96 C C
Id91 4 1 1 2 SN91 10 1,595.60 1.00 C 0.71 B 4.99 C C
Id92 6 1 7 13 SN92 10 443.34 0.17 A 0.01 A 1.50 B B
Id97 4 6 8 16 SN97 9 1,398.35 0.33 A 0.04 A 1.10 A A
Id118 7 6 6 10 SN118 9 21,941.42 1.17 C 0.79 C 4.08 C C
Id140 1 7 21 41 SN140 9 4,150.48 0.17 A 0.63 B 0.60 A B
Id145 7 6 24 45 SN145 8 11,897.00 0.5 A 0.12 A 0.19 A A
Id166 2 6 19 39 SN166 8 1,815.60 0.83 C 1.7 C 15.59 C C
Id178 3 6 13 25 SN178 7 3,867.25 0.33 A 1.31 C 2.53 C C
Id202 4 1 8 15 SN202 7 5,419.40 0.17 A 0.20 A 0.08 A A
Id205 7 6 31 64 SN205 6 4,977.87 0.33 A 1.99 C 1.32 B C
Id222 1 6 32 67 SN222 5 1,530.85 0.67 B 0.44 A 0.95 A B
Id254 3 6 28 58 SN254 3 12,138.62 0.33 A 0.03 A 0.05 A A
Id258 7 6 18 35 SN258 3 8,538.85 1.00 C 1.32 C 0.74 A C
Id266 4 1 8 15 SN266 2 5,165.86 0,00 A 0.00 A 0.00 A A
Id267 4 1 8 15 SN267 2 5,165.86 0.83 C 3.57 C 0.46 A C
Id268 4 1 8 15 SN268 2 5,165.86 0.5 A 0.09 A 0.15 A A
Id281 4 6 8 15 SN281 1 4,357.31 0.17 A 0.67 B 0.05 A B
Id312 5 6 34 71 SN312 1 25,151.95 1.00 C 1.42 C 0.06 A C
. B
ioméd
., v
. 30, n. 1, p
. 64-69, mar
. 2014
ng
., 30(1), 64-69, Mar
. 2014
Oshiyama NF, Silveira AC, Bassani RA, Bassani JWM
used to establish the classes, the more robust is the
classiication.
With the classiication results, many post-hoc
analyses could be made by the professionals responsible for technology management. The four types of equipment further investigated in the present study
were chosen due to the high percent of items classiied
as C. General use infusion pumps are important life support devices used for therapeutic and/or diagnosis purposes, but also carry considerable risk in the case of malfunction, as infusion rates different from those prescribed may be even lethal (Association..., 2010). Another reason to focus on this type of equipment is the observation of a typically high number of non-programmed service orders, i.e., corrective maintenance (Taghipour et al., 2010). When the manufacturers
were compared, M54 was identiied as one of the sources of a large percent of the pumps classiied as
C (39.5%), even though 94% of the equipment from
this manufacturer was 0-4 year-old. Possible reasons
for this atypical maintenance behavior might involve the equipment design, parts and/or assembly, as well as the clinical and maintenance teams.
It is important to identify individual devices or equipment (and their manufacturers) most prone to failure because they represent poor investment over time, and medical technology managers should have
quantitative data to justify the need to replace the equipment. But the equipment per se might not be the only possible cause of failure: error in the equipment use by the clinical staff and/or lack of adequate maintenance by the clinical engineering group may contribute to it. In the method presented here, the
classiication according to the corrective maintenance
data raises an alert for further investigation of the possible causes of a maintenance performance not
compatible with that expected for the equipment age.
Depending on how the information in the spreadsheet
is iltered, the main cause of the poor classiication could be identiied. For instance, if there is a type of
equipment of a given age range and from a certain
manufacturer that is classiied as C only at one place of use, this iltering could indicate the necessity of
better user training.
It should be stressed that the age-based classiication
presented here should not be used as the sole tool for support of administrative or regulatory decisions, but rather as source of alert for the clinical engineering and administrative teams on critical aspects that require more detailed investigation. Additional information may be necessary for a correct and robust decision (Oshiyama et al., 2012). In the daily, routine use, as it should be the case for all types of indicators, clinical engineers should monitor and investigate Figure 3. Number of general use infusion pumps from ive manufacturers categorized according to the equipment age (A) and to the classiication according to the corrective maintenance performance (B).
Figure 2. Number of items of four types of high-risk medical equipment in each age range (A) and in each class according to their corrective maintenance performance (B).
Rev. Bras. Eng. Bioméd., v. 30, n.1, p. 64-69, mar. 2014
Braz. J. Biom. Eng., 30(1), 64-69, Mar. 2014
each aspect, aiming at improving equipment choice and service delivery, as well as adequately training of the health care staff. If used in hospitals nationwide,
this classiication might even help raising lags for regulatory agencies, since these indicators are expected to be independent of the size of the hospital or the size and quality of the maintenance groups.
Acknowledgements
Authors are indebted to the Clinical Engineering and Informatics teams from the Center for Biomedical Engineering of the University of Campinas for their invaluable assistance during collection and analysis of equipment data. Financial support: Conselho Nacional
de Desenvolvimento Cientíico e Tecnológico (SAE/ UNICAMP, CNPq, Grant. N. 831346/1988-4, NFO,
Grant. N. 300632/2005-3, JWMB).
References
Association for the Advancement of Medical Instrumentation - AAMI. Infusing patients safely. Priority issues from the AAMI/FDA infusion device summit. Arlington: AAMI; 2010. 41 p.
Albrecht WS, Stice EK, Stice JD. Financial accounting. Ohio: Cengage Learning; 2010.
Bronzino JD. Management of medical technology - a primer for clinical engineers. Boston: Butterworth-Heinemann; 1992. PMid:1596745.
Cheng M, Dyro JF. Good management practice for medical equipment. In: Dyro JF, editor. Clinical engineering handbook. Burlington: Elsevier Academic Press; 2004. p. 108-10. http:// dx.doi.org/10.1016/B978-012226570-9/50035-1 Clark TJ. Health care technology replacement planning. In: Dyro JF, editor. Clinical engineering handbook. Burlington: Elsevier Academic Press; 2004. p. 153-4. http://dx.doi. org/10.1016/B978-012226570-9/50046-6
Cohen T, Cram N. Computerized maintenance management systems. In: Dyro JF, editor. Clinical engineering handbook. Burlington: Elsevier Academic Press; 2004. p. 124-30.
PMid:15316975. http://dx.doi.org/10.1016/B978-012226570-9/50040-5
Cruz AM, Denis ER, Villar MCS, Lic GLM. An event-tree-based mathematical formula for the removal of biomedical equipment from a hospital inventory. Journal
of Clinical Engineering, 2002; 27(1):63-71. http://dx.doi.
org/10.1097/00004669-200202710-00039
Dondelinger RM. A simple method of equipment replacement planning. Biomedical Instrumentation & Technology, 2003; 37(6):433-6.
Dondelinger RM. A complex method of equipment replacement planning. Biomedical Instrumentation
& Technology, 2004; 38(1):26-31. http://dx.doi.
org/10.2345/0899-8205(2004)38[26:ACMOER]2.0.CO;2 Hastie T, Tibshirani R, Friedman J. The elements of statistical learning: data mining, inference and prediction. New York: Springer; 2009. http://dx.doi.org/10.1007/978-0-387-84858-7 Melendez L, Rane R. Anesthesiology. In: Dyro JF, editor. Clinical engineering handbook. Burlington: Elsevier Academic Press; 2004. p. 384-91. http://dx.doi.org/10.1016/ B978-012226570-9/50099-5
Miodownik S. Operating room. In: Dyro JF, editor. Clinical engineering handbook. Burlington: Elsevier Academic Press; 2004. p. 376-84.
Oshiyama NF, Bassani RA, D’Ottaviano IML, Bassani JWM. Medical equipment classiication: method and decision-making support based on paraconsistent annotated logic. Medical & Biological Engineering & Computing, 2012; 50(4):395-402. PMid:22407498. http:// dx.doi.org/10.1007/s11517-012-0888-6
Pammolli F, Riccaboni M, Oglialoro C, Magazzini L, Baio G, Salerno N. Medical devices competitiveness and impact on public health expenditure. Luxembourg: Ofice for Oficial Publication of the European Communities; 2005. Taghipour S, Banjevic D, Jardine AKS. Reliability analysis of maintenance data for complex medical devices. Quality and Reliability Engineering International. 2010; 27(1):71-84. http://dx.doi.org/10.1002/qre.1084
World Health Organization - WHO. World Health Statistics 2013 [internet]. 2013 [cited 2013 June 08]. Available from: http://www.who.int/gho/publications/ world_health_statistics/2013/en/.
Authors
Natália Ferreira Oshiyama, Ana Carolina Silveira, José Wilson Magalhães Bassani*
Departamento de Engenharia Biomédica, Faculdade de Engenharia Elétrica e de Computação, Universidade Estadual de Campinas – UNICAMP, Rua Alexander Fleming, 105, Cidade Universitária Zeferino Vaz, CEP 13083-881, Campinas, SP, Brasil.
Rosana Almada Bassani, José Wilson Magalhães Bassani