SNAPSHOT VIEWS OF THE ROMANIAN ECONOMY ON REGIONAL
LEVEL USING INPUT-OUTPUT METHODOLOGY
BORÓKA-JÚLIA BÍRÓ
1, BÍBORKA-ESZTER BÍRÓ
2ABSTRACT – Our present paper proposes to give snapshot views on the status-quo of the Romanian economy at the level of development regions. From a methodological perspective, the study is based on the construction of an aggregated national Input-Output table from the more detailed one of the National Institute of Statistics, followed by the derivation of regional tables using the non-survey GRIT technique. Quantitative sectoral interrelationships are going to be analysed based on multipliers, backward and forward linkages in order to identify key sectors within regional economies. This could serve as a baseline for assessing the impact of several policies of the European Union on the Romanian economy, such as the Cohesion Policy and the Common Agricultural Policy. The lower territorial approach – i.e. the construction of regional Input-Output models – used within the present study is in accordance with the European Union’s NUTS2 level policy design and planning philosophy on the one hand. On the other hand, this analytic direction makes possible the use of the results as a base for regional economic development strategy design, highlighting structural specificities and discrepancies among regions of the same country.
Keywords: Input-Output methodology, regionalization, NUTS2 regions, GRIT technique, output backward and forward linkages, key sectors
INTRODUCTION
In terms of regional policy design, a “closer-than-national” view is absolutely necessary in order to depict local specificities, to identify specific economic structures, to highlight possible disparities on NUTS2 level that can occur in the structure of a nation’s economy. Examination of sectoral interrelationships within a region’s economy is essential when trying to capture the economic performance of the regional economy. Insight into the economic performance of the Romanian development regions are going to be given within the framework of present study by presenting quantitative sectoral relationships in every Romanian region’s economy. The paper consists of three main parts. Firstly, methodological aspects of Input-Output Analysis are discussed applied to the Romanian national economy for the year 2008. Secondly, regionalization procedure of the National Input-Output Table is being applied, using the non-survey GRIT method. In the third part of the study, output backward and forward linkages are derived from the regional models in order to identify the key economic sectors within each development region of Romania. Results obtained within the framework of the present paper could serve as a starting point for improved policy design, as well as for assessing the impact of several policies of the European Union on the Romanian economy, such as the Cohesion Policy and the Common Agricultural Policy.
1
Teaching Assistant, Ph.D., Babeş-Bolyai University, Faculty of Economics and Business Administration, 58-60 Teodor Mihali Street, Cluj-Napoca, Romania. E-mail: biro_boroka@yahoo.com
INPUT-OUTPUT FRAMEWORK
At the base of Input-Output analysis stays the general equilibrium theory – this condition being fulfilled with supply equals demand – studying the national economies through a series of indices, using as a starting point the matrix of sectoral relationships. Input-Output methodology was introduced to the scientific public by Wassily Leontief in the year 1936 by his pioneer work in the field entitled “Quantitative input-output relations in the economic system of the United States”. In one of his later works, he referred to his prior work in the following way: “An attempt to apply the economic theory of general equilibrium – or better, general interdependence – to an empirical study of interrelations among the different parts of a national economy as revealed through covariations of prices, outputs, investments and incomes” (Leontief, 1941). The Input-Output approach treats the national economy as an interdependent system of various sectors.
The last decade was characterised by growing interest in the field of economic analysis regarding Input-Output modelling. The method was mainly used as a methodological tool in the following broad research areas:
to rank sectors and/or subsectors in the view of determining their particular roles as well as to identify key or leading ones in within a national economy (Andreosso-O’Callaghan and Yue, 2004; Bekhet, 2011; San Cristóbal and Biezma, 2006), the role of agriculture in the Romanian national economy (Vincze et al., 2004; 2006a; 2006b)
to analyse the particular characteristics of a specific sector and its role in a national economic context: e.g. construction sector (Kofoworola and Gheewala, 2010), forestry sector (Dhubháin
et al., 2009), tourism (Beynon et al., 2009), real estate (Song and Liu, 2007); business process
outsourcing sector (Magtibay-Ramos, 2008), to capture structural characteristics (Tzimos et
al., 2007) as well as changes of structure over time on macroeconomic level (Bekhet, 2010;
Andreosso-O’Callaghan and Yue, 2004)
to analyse production structure on the international level, making possible the comparison of similar sectors in different countries (San Cristóbal and Biezma, 2006),
to analyse interindustry linkages on the regional level: for identification of key sectors on the regional level, for regional strategic planning (Dhubháin et al., 2009; Midmore et al., 2006; Vincze et al., 2004; 2006a; 2006b)
as well as for economic planning and to measure different kinds of policy impact analyses, such as tourism impact analysis (Cai et al., 2006), effects of water supply restrictions (González, 2011), informing regional development policy (Midmore et al., 2006), measuring the impact of Structural and Cohesion Funds as well as of those of the Common Agricultural and Rural Development Policies (Vincze et al., 2004; 2006a; 2006b).
Input-Output modelling was introduced by Wassily Leontief, and has become a powerful tool in economic planning since then (San Cristóbal and Biezma, 2006). There are three basic components of the Input-Output Table: the Transactions Table, the Direct Requirements Table and the Total Requirements Table. We considered as a starting point the Romanian national Input-Output table referring to the year 2008 (from the National Institute of Statistics), that served as a base for the derivation of the regional Input-Output tables referring to the economies of each Romanian development region. The 89 industries of the National Input-Output Table for 2008 (in its most disaggregated form according to NACE Rev.2) had been consolidated into ten sectors.
REGIONALIZATION OF THE NATIONAL INPUT-OUTPUT TABLE
In order to provide insight into the economic performance of the Romanian NUTS2 level regions, quantitative relationships between sectors of regional economies have been identified. From a methodological point of view, regional Input-Output models have been derived from the national one by applying the non-survey GRIT (Generation of Regional Input-Output Tables) technique (Mattas et
al., 2006). This method was used to assess output, income and employment implications of pre- and
on the Romanian economy – focusing on the analysis of the crop production of the North-West region, within the framework of the EU FP 6 CLAVIER project (Vincze et al., 2007; Bíró and Sz cs, 2009; Sz cs and Bíró, 2009a, 2009b, 2009c; Sz cs, 2011; Sz cs and Vincze, 2011). The GRIT technique was originally developed at the Department of Economics of Queensland University Australia by Jensen and others (Jensen et al., 1979; Hewings and Jensen, 1986).
When constructing a NUTS2 level regional Input-Output Table one should follow the next five broad steps: aggregate the sectors of the national economy; compute the aggregated National Input-Output Table (NIOT); compute the Regional Direct Requirements Matrix (AR); calculate the remaining parts of the regional IO table (other than the elements of AR); finish computation of the complete RIOT.
Aggregation of the sectors of the national economy
The aggregation process is first of all grounded on the lack of further additional data regarding employment, income and GVA values at the 89-levelled disaggregated form. Additional data needed in the forthcoming regional modelling process – existing on different levels justifies the necessity of setting the degree of aggregation at ten sectors (Table 1.). The ten sectors were defined in the view of additional data availability needed in the Input-Output modelling process, including data need of specific steps of the regionalisation procedure.
Table 1. The aggregation procedure applied to the sectors of the Romanian economy
Sectors before aggregation (NACE classification rev. 2)
Sectors after aggregation
01-03 Agriculture, forestry and fishing
05-09 Extracting industry
10-33 Processing industry (light, heavy)
35-39 Energy industry
41-43 Construction
45-47 & 55-56 Commerce, hotels, restaurants 49-53 & 58-63 Transport, communication
64-66 Financial intermediation and insurance
68 Real estate activities
69-99 Public administration and public services Source: own elaboration
Computation of the aggregated National Input-Output Table
Computation of the aggregated National Input-Output Table (NIOT) has been made along the aggregation procedure indicated in Table 1, resulting the ten sector dimensioned National Input-Output Table from the more detailed (89 sectors) one, referring to the year 2008. Elements of the National Direct Requirements Matrix (AN) were calculated as:
where:
- denoted the value of input i required to produce 1 unit of value of good j (or: the share of the product of sector i that is used as an input by sector j);
Computation of the Regional Direct Requirements Matrices (based on Mattas et al., 2006)
When starting the computation of a Regional Input-Output Table, we used as a starting point the national direct requirements matrix, which is also called matrix of the technical coefficients. Thus, intermediate flows of the regional tables have been calculated based on the national intermediate flows. Then, there are two types of quotients, namely: Cross-Industry Location Quotient (CILQ) and Flegg and Weber Location Quotient (FLQ), the computation of which was a prerequisite for the construction of the Regional Input-Output Tables (RIOT).
First, we calculated CILQ values as follows:
where:
– is a nxn matrix containing values;
– denotes the Gross Value Added of selling sector i in the region; - denotes the Gross Value Added of selling sector i on national level;
- denotes the Gross Value Added of purchasing sector j in the region;
- denotes the Gross Value Added of purchasing sector j on national level.
We mention here that several studies – this was the situation in the Romanian case studies within the REAPBALK (Vincze et al., 2004; 2006a; 2006b) and CLAVIER (Vincze et al., 2007; Bíró and Sz cs, 2009; Sz cs and Bíró, 2009a, 2009b, 2009c; Sz cs, 2011; Sz cs and Vincze, 2011) project as well – use the regional and national employment shares for the calculation of the CILQ. We constructed the CILQ statistical indicator based on GVA shares instead of employment shares –as we consider GVA superior to employment when reflecting the relative size of a region and as these data (GVA) were available on Romanian NUTS2 and sectoral level for the year 2008. We shall mention here that the complete regionalization procedure has also been accomplished using employment shares for the computation of the CILQ values, and this did not lead to significantly different results.
Secondly, we calculate FLQ using the CILQ calculated in the previous step:
where:
- is the nxn matrix of FLQij values;
- is a weighting factor reflecting the relative size of the region within the national economy; – is the weighting parameter based on the size of the region using GVA shares, reflecting the relative importance of the economic activity in the region.
less than 1 between any two selling and purchasing sector, we concluded that local demand cannot be covered by regional production, thus imports are needed in order to make up for this deficiency. Consequently, the respective technical coefficient had to be reduced by multiplying the one from the National Direct Requirements Matrix with the appropriate FLQij, thus eliminating the overestimation of regional inter-industry transactions. On the other hand, in cases when FLQij was larger than unity, we faced a situation when the supply offered by sector i is sufficient to meet the demand of purchasing sector j in the region, thus the national coefficient equals the regional coefficient in such cases. From a computational perspective this means that if FLQij>1, then FLQij has to be set as equal to 1. This way the multiplier – that of a unity – will enable national technical coefficients to keep their value in the regional coefficients’ matrix.
Thirdly – after adjusting FLQij where necessary – we calculated the elements of the Regional Direct Requirements Matrix in the following way:
where:
denotes the element of AR (nxn Regional Direct Requirements matrix) from the row i and column j;
- denotes the element of AN (nxn National Direct Requirements matrix) from the row i and column j;
- is the nxn matrix of adjusted FLQij values.
Calculation of the remaining parts of the regional IO table (other than the elements of AR) (based on Mattas et al., 2006)
In order to make possible the derivation of the remaining “output” (total output, final consumption expenditure and export values) and “input” sections (regional total inputs, compensation of employees and import values) and of the RIOT from the NIOT, above all we had to calculate the Simple Location Quotient (SLQ). SLQ values were calculated by multiplying the nxn diagonal matrix containing elements of regional sectoral GVA values with the inverse of the nxn diagonal matrix of national GVA values. Multiplying the result of the above procedure with the nx1 unity vector (i.e. a column vector which contains only elements of 1) we got the SLQ vector. After having calculated values of the SLQ vector (nx1), we executed a correction procedure. If the computed SLQij was larger than unity for any given sector, then we can assume that the shares used depict in a realistic way the regional situation regarding output. Thus, they shall be adjusted to 1. On the other hand, in cases when SLQij was less than unity, one can assume that the economic activity of the given sector is low in the
region’s economy, consequently its sectoral output should be adjusted. In such cases, SLQij values are being used as they are, while SLQij values larger than one are reduced to 1. After correcting SLQij
values along with the procedure presented above, by obtaining the diagonal matrix, we can compute using multiplication the values of regional sectoral inputs and outputs, final consumption expenditure, export and import, compensation of employees.
Computation finalization of the complete RIOT
of 1xn total intermediate flows from total input row, and by the substraction of nx1 total intermediate flows from total output column.
REGIONALIZATION OF THE NATIONAL INPUT-OUTPUT TABLE
As direct result of the regionalization procedure, we obtain the regional Input-Output tables for each Romanian development region. Every RIOT has the same structure with the NIOT, i.e. contains the regional (in case of RIOTs) transactional matrix, with primary inputs below and final demand components right next to intermediate flows. The last row and the last column of the RIOT contain the regional total input values and the total regional output (production) values by sectors. The equilibrium of the IO tables is ensured by the fact that these values are sector-wise equal (e.g. total input value of the agriculture, forestry and fishing sector equals its total output value expressed in million lei current prices). This statement is valid both within the framework of the NIOT and within the framework of every constructed RIOT, separately.
Figure 1. Total production of regions by economic sectors, 2008, million lei, current prices
Source: own calculations based on RIOTs
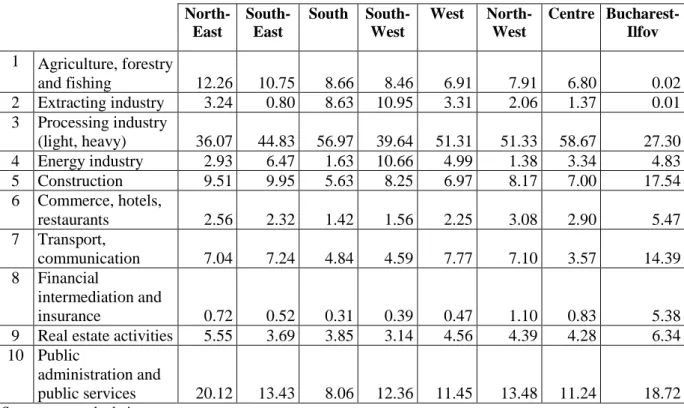
Table 2. Production structure of regions by sectors, 2008 (%)
North-East
South-East
South South-West
West North-West
Centre Bucharest- Ilfov
1 Agriculture, forestry
and fishing 12.26 10.75 8.66 8.46 6.91 7.91 6.80 0.02
2 Extracting industry 3.24 0.80 8.63 10.95 3.31 2.06 1.37 0.01 3 Processing industry
(light, heavy) 36.07 44.83 56.97 39.64 51.31 51.33 58.67 27.30 4 Energy industry 2.93 6.47 1.63 10.66 4.99 1.38 3.34 4.83 5 Construction 9.51 9.95 5.63 8.25 6.97 8.17 7.00 17.54 6 Commerce, hotels,
restaurants 2.56 2.32 1.42 1.56 2.25 3.08 2.90 5.47
7 Transport,
communication 7.04 7.24 4.84 4.59 7.77 7.10 3.57 14.39 8 Financial
intermediation and
insurance 0.72 0.52 0.31 0.39 0.47 1.10 0.83 5.38
9 Real estate activities 5.55 3.69 3.85 3.14 4.56 4.39 4.28 6.34 10 Public
administration and
public services 20.12 13.43 8.06 12.36 11.45 13.48 11.24 18.72 Source: own calculations
DERIVING MULTIPLIERS FROM THE REGIONAL INPUT-OUTPUT TABLES
Intersectoral relationships in an Input-Output framework can be detected with the use of various linkages. The term multiplier is frequently used as a synonym to linkages. One of the most frequently used multipliers is the one measuring the effects of exogenous changes on output of the sectors in the economy (Bekhet, 2011). They measure the total change in output resulting from a unit change in a sector’s output. It shows the overall increase in the economy’s production that is needed to satisfy a unit increase in the final demand of the sector under examination. Especially for a sector j, the multiplier estimates the total value of output that is needed by all sectors of the economy to cover a monetary unit increase in the final demand of sector j.
Over time, several researchers (among them pioneers: Chenery and Watanabe, 1958; Rasmussen, 1956; Hirschmann, 1958) suggested different approaches on how the above three linkages should be calculated using the Input-Output table as a starting point. Rasmussen-Hirschmann type linkages use as a starting point the Leontief inverse of the direct requirements matrix. If B denotes the Leontief inverse of the A matrix, then formally B = (I – A)-1. Sectoral interdependence relations in the view of Rasmussen and Hirschmann can be captured using the specific column and row-wise multipliers.
where:
denotes the Rasmussen-Hirschmann type output backward linkage coefficient of sector j
denotes the Rasmussen-Hirschmann type output forward linkage coefficient of sector i B is the nxn Leontief inverse of the direct requirements matrix A, i.e. B = (I – A)-1
bij denotes the element from row i and column j of the B matrix
CONCLUSION
Hirschmann (1958) was the one, who introduced the notion of key sectors. In his view, for the grounding of appropriate policy and development strategy formation, it is essential to identify leading sectors, i.e. those that have the potential to create above-average impact in an economy. We considered as a starting point the Romanian national Input-Output table referring to the year 2008 (from the National Institute of Statistics). The 89 industries of the National Input-Output Table for 2008 (in its most disaggregated form according to NACE Rev.2) had been consolidated into ten sectors. For the derivation of the RIOTs, the non-survey GRIT technique had been used – as suggested by the literature. As a result of the regionalisation procedure, eight regional input-output tables (RIOTs) have been obtained, each reflecting the economic structure of the Romanian development regions as they were in 2008. Afterwards, for each sector of each region: output backward (OBL) and forward linkages (OFL) have been calculated in the view of identifying key sectors in local economies, as well as capturing intersectoral relationships.
Table 3. Regional output backward and forward linkages and associated sector rankings for 2008
Source: own calculations based on RIOTs
forward capacity in different regions. However, one can also notice similarities: in all development regions the first position is occupied by the commerce, hotels, restaurants sector and the 10th position by the extracting industry according to OBL values. On the other hand, taking OFL rankings, the first position is occupied by the processing industry sector and the 10th by real estate activities – just as in the case of the national OFL ranking values. Significant difference is noticeable in the OBL position of the energy industry in the South-East region that –compared to other regions’ 2nd position – here it is placed on the 6th.
REFERENCES
ANDREOSSO-O’CALLAGHAN, B., YUE, G. (2004), Intersectoral Linkages and Key Sectors in
China, 1987-1997, in: Asian Economic Journal, Vol. 18, No. 2, pp. 165-183.
BEKHET, H. A. (2010), Ranking Sectors Changes of the Malaysian Economy: Input-Output
Approach, in: International Business Research, Vol. 3, No. 1, pp. 107-130.
BEKHET, H. A. (2011), Output, Income and Employment Multipliers in Malaysian Economy:
Input-Output Approach, in: International Business Research, Vol. 4, No. 1, pp. 208-223.
BEYNON, M., JONES, C., MUNDAY, M. (2009), The embeddedness of Tourism-related Activity: A
Regional Analysis of Sectoral Linkages, in: Urban Studies, No. 46, pp. 2123-2141.
BÍRÓ, B. J., SZ CS, E. (2009), A CLAVIER projekt bemutatása [Presentation of the CLAVIER Project], in: Economists Forum, Vol. XII, no. 90, pp. 66-68.
CAI, J., LEUNG, P., MAK, J. (2006), Tourism’s Forward and Backward Linkages, in: Journal of Travel Research, Vol. 45, pp. 36-52.
DHUBHÁIN, Á. N., FLÉCHARD, M. C., MOLONEY, R., O’CONNOR (2009), Assessing the value
of forestry to the Irish economy – An input-output approach, in: Forest Policy and Economics,
No. 11, pp. 50-55
GONZÁLEZ, J. F. (2011), Assessing the Macroeconomic Impact of Water Supply Restrictions
Through an Input-Output Analysis, in: Water Resource Management, Vol. 25, pp. 2335-2347
HEWINGS, G. J. D., JENSEN, R. C. (1986), Regional, Interregional and Multiregional Input-Output
Analysis, in: Nijkamp P. (ed.), Handbook of Regional and Urban Economics, Volume
I.,Elsevier Science Publishers BV, pp. 295-355.
http://www.usergioarboleda.edu.co/economia/Aniversario/LecturasRecomendadas/Papers_He wings/REGIONAL-INTERREGIONAL-AND-MULTIREGIONAL-INPUT-OUTPUT-ANALYSIS.pdf, retrieved on 01.08.2012.
JENSEN, R. C., MANDEVILLE, T. D., KARUNARATNE, N. D. (1979), Regional Economic
Planning, Croom Helm Ltd., London, http://books.google.ro/books?id=CMYOAAAAQAAJ&
printsec=frontcover#v=onepage&q&f=false, retrieved on 01.08.2012.
KOFOWOROLA, O. F., GHEEWALA, S. (2010), An input-output analysis of Thailand’s construction
sector, in: Construction Management and Economics, No. 26, pp. 1227-1240.
LEONTIEF, W. W. (1941), The Structure of American Economy, 1919-1929: an empirical
application of equilibrium analysis, Harvard University Press.
http://books.google.ro/books?id=cm_HAAAAMAAJ&dq=The%20Structure%20of%20Ameri can%20Economy%2C%201919-1929%3A%20an%20empirical&source=gbs_book_other_ versions, retrieved on 10.01.2012.
MAGTIBAY-RAMOS, N., ESTRADA, G., FELIPE, J. (2008), An Input-Output Analysis of the
Philippine BPO Industry, in: Asian-Pacific Economic Literature, Vol. 22, No. 1, pp. 41-56.
MATTAS, K. ET AL. (2006), Deriving regional I-O tables and multipliers, in: Bonfiglio, A., Esposti, R., Sotte, F., Rural Balkans and EU integration, FrancoAngeli, Milano, pp. 75-120.
MIDMORE, P., MUNDAY, M., ROBERTS, A. (2006), Assessing industry linkages using regional
SAN CRISTÓBAL, J. R., BIEZMA, M. V. (2006), The mining industry in the European Union:
Analysis of inter-industry linkages using input-output analysis, in: Resources Policy, No. 31,
pp. 1-6.
SONG, Y., LIU, C. (2007), An Input-Output Approach for Measuring Real Estate Sector Linkages, in: Journal of Property Research, 24(1), pp. 71-91.
SZ CS, E., BÍRÓ, B. J. (2009a), A klίmaváltozás növénytermesztésre gyakorolt hatásai az
Északnyugati régióban [Climate Change Impacts on Crop Production in the North-West
Region of Romania], in: Economist’s Forum, Vol. XII, No. 87, pp. 15-28.
SZ CS, E., BÍRÓ, B. J. (2009b), Termés-előrejelzések az Északnyugati régióban különböző
klímamodelleket használva [Crop-forecasts in Romania’s North-West Region Based on Different Climate Models], in: RODOSZ Conference, 13-15 November 2009, pp. 419-433. SZ CS, E., BÍRÓ, B. J. (2009c), Territorial Differences of Climate Change Impact on Romanian
Crop Production, in: Scientific Journal, SGGW, Problems of World Agriculture, Vol. 6.,
Warsaw University of Life Sciences Press, October 2009, pp. 74 – 87.
SZ CS, E. (2011), A klímaváltozás szántóföldi növénytermesztésre gyakorolt hatásának gazdasági
következményei Románia NUTS 2 fejlesztési regióiban [Economic Consequences of Climate
Change Impacts on Arable Crop Production in the Romanian NUTS2 Regions], Gazdasági és Üzleti Kihívások a Kárpát-medencében, Conference organized by Sapientia University, Editor: Lázár Ede, Ed. Status, Miercurea-Ciuc, 2011, pp. 165-183.
SZ CS, E., VINCZE, M. (2011), Regional differences of agricultural vulnerability, in: European Economic Recovery and Regional Structural Transformations, The 8th International Conference, Cluj-Napoca, 24-25 June, 2011, Risoprint, Cluj-Napoca.
TZIMOS, C., PAPADIMITRIOU, I., ADAMOU, N. (2007), The Measurement of Interindustry
Linkages with Data Analysis Methods, http://www.iioa.org/pdf/16th%20Conf/Papers/Tzimos
%20Inderindustry%20Linkages%20-%20Data%20Analysis.pdf, retrieved on 01.06.2012. VINCZE, M., GYÖRFY, L., KEREKES, K. (2006a), A romániai Északnyugati régió európai
fejlesztési forrásai és gazdaságának jövője [European Development Funds and Economic
Future of the Romanian North-West Region], in: Területi statisztika, KSH, No. 5, pp. 535-544.
VINCZE, M., GYÖRFY, L., VARVARI, Ş. (2006b), The impact of the European funds on the
Romanian National and Regional Economy, in: Bonfiglio, A., Esposti, R., Sotte, F. (ed.),
Rural Balkans and EU Integration. An Input-Output Approach, FrancoAngeli, pp. 194-227. VINCZE, M., GYÖRFY, L., VARVARI, Ş. (2004), Impact analysis of the European funds on total
output, households income and employment of North-West Development Region and Romania by sectors, in: Vincze M. (ed.), International seminar “Regional and rural development
interface”, Cluj-Napoca, Romania, 13-15 May, 2004.
VINCZE, M., PETE, I., SZ CS, E., BÍRÓ, B. J. (2007), The main factors influencing Romanian crop
production, in: Competitiveness and European Integration, Regional and Rural Economics,