Carlos Pestana Barros & Nicolas Peypoch
A Comparative Analysis of Productivity Change in Italian and Portuguese Airports
WP 006/2007/DE _________________________________________________________
João Carlos Lopes
High Employment Generating Industries
in Portugal. An Input-Output Approach
WP 24/2011/DE/UECE _________________________________________________________
Department of Economics
W
ORKINGP
APERSISSN Nº 0874-4548
School of Economics and Management
High Employment Generating Industries in Portugal: An Input-Output
Approach
João Carlos Lopes*
ISEG - School of Economics and Management, Technical University of Lisbon, and UECE - Research Unit on Complexity and Economics
Abstract. An increase in the unemployment rate is one of the most serious consequences of macroeconomic crises. In Portugal, the impact of the deep recession of 2009 has been particularly strong. In this paper, after quantifying this macroeconomic problem, an input-output approach is used in order to identify the high employment generating (or destructing) industries. This approach is particularly interesting because it considers not only the direct flows of job creation and destruction, but also the employment changes attributable to the indirect and induced effects of interindustry connections (the flows of intermediate inputs’ supply and demand). Using the so-called hypothetical extraction (or “shut-down of industry”) method and the employment and input-output data of the Portuguese economy, the key sectors in terms of multipliers, elasticities and the creation of jobs are identified. The empirical results of this paper can be useful in improving the policy responses to the crisis and implementing the most appropriate measures to stimulate the economy.
Keywords:C67, D57
JEL: input-output analysis; hypothetical extraction; employment
* e-mail:jcflopes@iseg.utl.pt
Full address:
Prof. João Carlos Lopes
ISEG - Rua Miguel Lupi, nº 20 1249-078 Lisboa
Portugal
High Employment Generating Industries in Portugal: An Input-Output
Approach
1 Introduction
The significant rise of the unemployment rate is one of the most serious consequences of
macroeconomic crises. In Portugal, the impact of the recent recession has been
particularly strong, putting unemployment at the center stage of policy makers’ concerns.
Unfortunately, after a brief period of anti-cycle, expansionary measures in 2009, the
serious deterioration of budget imbalances (public deficit and debt as a percentage of
GDP) and the instability of financial markets (e.g., Greece and Ireland cases), obliged the
Portuguese Government to launch in 2010 an austerity program in successive rounds
(Programas de Estabilidade e Crescimento1 - PECs 1, 2 and 3) that have seriously
deteriorated the macroeconomic context. After the refusal of PEC4 in the Portuguese
Parliament, the minority government has fallen and the new government elected in June
2011 was in charge of implementing the strong austerity program negotiated with the so
called troika (EU, ECB and IMF) as a pre-requisite for financial support. The main
consequence of these political and economic events in Portugal is a double dip recession
of consequences not yet fully quantifiable, with the last official predictions in October
2011 (Ministério das Finanças, 2011) pointing to a strong GDP decay (of -1,9% in 2011
and -2,8% in 2012) and a rising unemployment rate (to the unparalleled levels of 12,5%
The first purpose of this paper, after quantifying the macroeconomic imbalances
of the Portuguese economy with a focus on real variables, such as economic growth,
employment and unemployment, is to make a descriptive analysis of its employment
structure by industries, and the main changes between 1995 and 2005.
The second purpose is to shed more light on this subject, using an interindustry
approach in order to identify the high employment generating (or destructing) sectors.
This approach is particularly interesting because it considers not only the direct flows of
job creation and destruction, but also the employment changes attributable to the indirect
and induced effects of interindustry connections (the flows of intermediate inputs supply
and demand). Using the so-called hypothetical extraction (or “shut-down of industry”)
method and the employment and interindustry data of the Portuguese economy, the key
sectors in terms of multipliers, elasticities and the (direct plus indirect) jobs creation are
identified.
The empirical results of this paper can be useful in improving the policy
responses to the crisis and carrying out the most appropriate measures to stimulate the
economy, using the (limited) instruments and resources available (e.g., EU structural and
cohesion funds; fiscal benefits; public-private R&D partnerships, etc.) in supporting the
industries with strong growth potential and jobs creation capability.
The paper is organized as follows. Section 2 surveys the main macroeconomic
other European countries (EU-27) and provides a descriptive analysis of the structure of
employment in Portugal and its changes between 1995 and 2005. Section 3 presents the
theoretical framework of the interindustry approach used to assess the relative importance
of sectors for employment creation, namely the hypothetical extraction method. The
empirical results are shown and discussed in section 4 and Section 5 ends the paper with
some concluding remarks.
2. Macroeconomic trends and sectoral employment structure
The macroeconomic performance has deteriorated in the European countries both in
terms of real GDP growth as in employment creation, in the first decade of the XXI
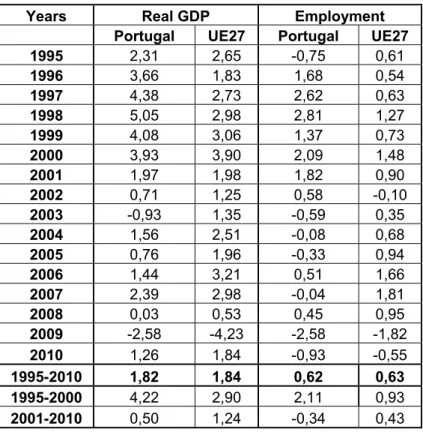
century (OECD, 2011). In Table 2.1 we can see that this trend is particularly clear in
Portugal, with average annual GDP growth decaying from 4,22% in 1995-2000 to a mere
0,5% in 2001-2010, leading many observers to pessimistically talking of “the lost
decade”.
< Table 2.1 About Here >
So, unemployment is nowadays the main macroeconomic problem of the
Portuguese economy (see Table 2.2), with its pernicious social and political effects, in
spite of the other great imbalances the country is currently facing, namely the huge public
In this context, it is important to study in more detail the employment changes in
the economy, namely the structure of employment by sectors. Unfortunately, for data
availability restrictions, we must limit the period covered to 1995-2005. The data sources
are the National Accounts from Statistics Portugal (INE) and the Departamento de
Prospectiva e Planeamento (DPP, 2004; 2008).
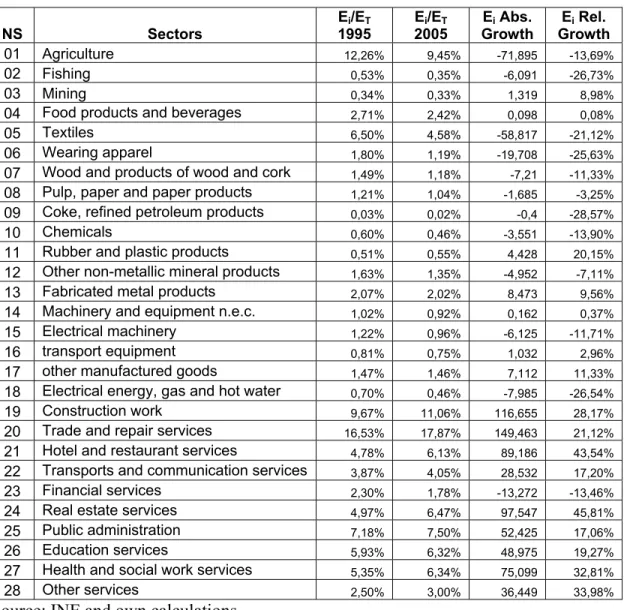
In Table 2.3 we present several employment indicators by sector, namely the
structure in 1995 and 2005, and the absolute and relative employment growth. The most
significant sectors in terms of employment weight in 1995 are Trade and Repair Services,
Agriculture, Construction, Public Administration, Textiles, Education and Health
Services, reflecting a long standing problematic specialization in low value added and
non tradable industries.
< Table 2.3 About Here >
In 2005, some progress in the pattern of specialization was detected with the
decaying weight of some traditional sectors (Agriculture, Fishing, Textiles and Wearing)
and the positive absolute and relative growth of Rubber and Plastic Products, Fabricated
Metal Products, Machinery and Equipment, Transport Equipment and Other
Manufactured Products. This slight improvement is also documented for the capacity to
However, this evolution was overcome by the significant (absolute and relative)
progression of Non Tradable Services (Real Estate, Hotels and Restaurants, Construction,
Health and Other Services). So, we can conclude that much remains to be done in the
upgrading of the specialization pattern of Portuguese economy, in the context of the
globalization challenges and the ambitious Strategy 2020 recently launched by the
European Union in the way of a smart, sustainable and cohesive growth.
3. Theoretical framework
In this section we present the methodology of interindustry analysis that will be used to
assess the relative importance of sectors for employment generation in Portugal. We start
by presenting the traditional framework in this context, the (open) Leontief input-output
model (for a detailed presentation of this model, see Miller and Blair (2009); an
interesting empirical study of the Portuguese economy with this kind of model,
comparing its structure with the Spanish one, is Amaral et al, 2011).
This Leontief system can be represented as follows:
(1) x = Ax + y,
where: x means the gross output vector of the n sectors of the economy; A is the
(domestic) technical coefficients matrix (intermediate input requirements per unity of
gross output) and y is the sectoral final demand vector (final consumption + gross
The well known solution of this system is
(2) x = By,
with B = (I-A)-1
Each element of the matrix B, the so called Leontief inverse, is a production
multiplier that gives the total (direct and indirect) effect in one’s sector production of a
unity increase in the domestic final demand directed to a given sector. That is, bij is the
global impact on sector’s i production when the domestic final demand of sector j
increases by one unity.
Considering that the labour coefficients (the requirements of labour, in total hours
or number of equivalent workers, per unit of production of each sector, eci = li/xi) are
fixed (a strong hypothesis for a long period of time but reasonable enough in the short
run), the traditional (Leontief) employment multipliers can be calculated as (generic case
of sector j, with j = 1, …, n):
(3)
∑
=
= n
i
ij i j ec b
Em
1
These multipliers give additional information about the employment potential of
the different sectors of an economy, considering not only direct flows of job creation in
the own sector, but also the indirect and induced effects generated by the interrelatedness
of the corresponding economy and more employment growth potential (see Amaral et al,
2007). The general case of multiplier Emj gives the total amount of employment created
in the economy (own sector j and all the others) when the final demand directed to sector
j augments one monetary unit. Parallel to Rasmussen (1957)-Hirshman(1958) linkage
indicators we can considerer key sectors those that have an above average employment
multiplier.
However, as (traditional) employment multipliers can be misleading because do
not take into account the relative (employment and production) weight of each sector, it
is useful to complement the analysis with what Valadkhani (2005) calls Type I
employment multipliers, or Relative employment multipliers, Rmj, calculated as:
(4)
j n
i
ij i
j
ec b ec Rm
∑
=
= 1
This multiplier overcomes the problem of units of measurement, and it means that for
each additional person directly employed in sector j, a further Rmj are employed in the
economy due to the multiplier and forward effects of sector j.
It is also possible to assess the relative importance of the different sectors in terms of
employment potential using as indicators the employment elasticities (see Mattas and
(4) L y y L Ee j j j ∂ ⋅
∂ =
where L represents total employment in the economy, yjis final demand directed to sector
j and j
y L
∂ ∂
is the employment multiplier for sector j.
Using Equation (3) the employment elasticity corresponding to sector j is:
(5) L y b ec Ee j n i ij i
j ⋅
=
∑
=1The analysis with employment multipliers and elasticities can be complemented
with the so called hypothetical extraction method, originally proposed by Paelinck et al
(1965) and later employed by many authors, e.g. Strassert (1968), Schultz (1977), Meller
and Marfán (1981), Milana (1985), Heimler (1991), Valadkhani (2003 a) and Kay et al
(2007). This method, that Groenewold et al (1993) also called “shut-down of industry”,
has been recently improved and extended in Dietzenbacher and Lahr (2008).
The basic idea is to solve the Leontief system after extracting one (or a group of)
sector(s), and compare the results, for instance, gross output, value added, employment of
the economy and of each other sector with the usual solution (before extraction).
Technically, this can be performed with the algebra of partitioned matrices. Suppose we
begin by extracting sector one (after this, we can compute the results permuting all and
Starting by the matrix of technical coefficients A, the first column and the first
row are substituted by full zero vectors.
(6)
= 22 1 0 0 0 A A
The Leontief inverse is now:
(7)
= 22 1 0 0 α I L
with α22 =(I−A22)−1
The solution of the system is given by:
(8)
= 2 1 22 1 2 1 1 0 0 y y I x x α
and so, the impact on the sectors’ gross output of extracting sector one is measured by:
(9) − − = ∆ 1 2 2 1 1 1 1 x x x x x
and the impact on total gross output is given by:
As sector one completely “disappears”, the direct impact is its own production.
The interesting indicator of this method is the indirect effect of this “disappearing”, the
consequences for the other sectors’ output, due to backward and forward linkages of
sector one and given by the second term on the right of equation (10).
This quantification of impacts on sector’ gross output can be used to assess the
impacts on sectors’ employment, considering the hypothesis of constancy of labour
coefficients, previously mentioned. The total relative importance of each sector can be
split in two components: the direct effect given by the volume of employment “lost” in
the own sector (of straightforward calculation) and the indirect and induced change in the
employment of other sectors due to the “shut down” of the sector.
4. Empirical results
Using data on employment by sector from INE and the input-output tables (domestic
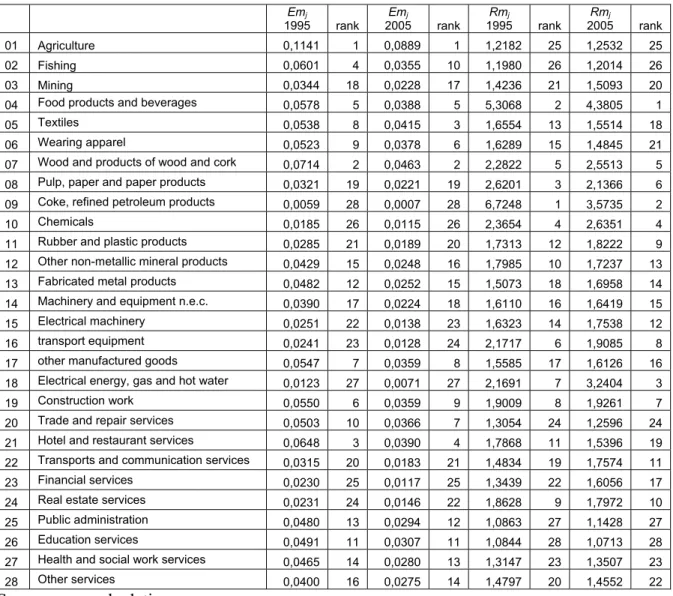
flows) provided by DPP (2008), we started by calculating the (absolute) employment
multipliers and the (relative) Type I employment multipliers of Portuguese sectors in
1995 and 2005. These values are presented in Table 4.1, together with the corresponding
sectoral ranks (relative importance of sectors by each criterion, in descending order).
The top 5 key (absolute) multiplier sectors in 2005 are Agriculture, Wood and
cork, Textiles, Hotels and restaurants and Food products. In relative terms (Type I
multipliers) Agriculture decay from the first to the 25th position in the rank and Textiles
from third to 18th, that is to say, these sectors have mainly a great weight in direct
employment. Top 5 sectors are in this second case Food products, Coke and refined
petroleum products, Electricity, gas and water, Chemicals and Wood and cork products.
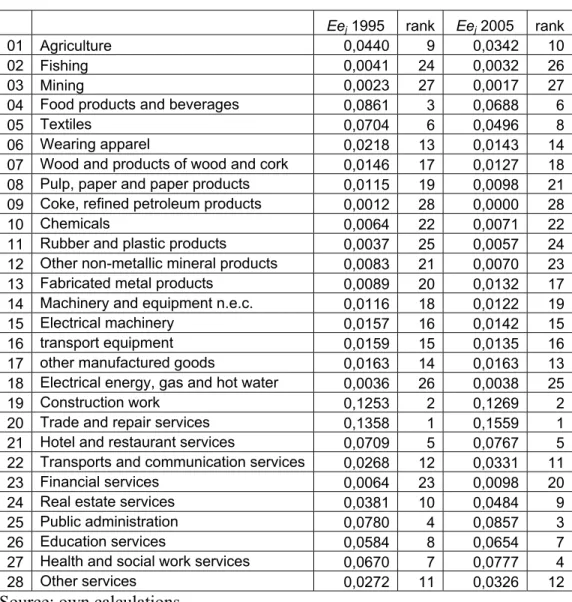
Next, we have calculated sectoral employment elasticities, shown in Table 4.2.
The most important sectors in 2005, along this indicator are: Trade and repair services,
Construction work, Real estate services, Health and social services and Hotels and
restaurants.
< Table 4.2 About Here >
These results are a good indication of the current dilemma of Portuguese decision
makers of fighting unemployment with measures to support traditional low value added
sectors or facilitating the upgrade of productive structure supporting medium and high
technological sectors with low employment.
In fact, in terms of the evolution of employment indicators between 1995 and
2005, there are no substantial changes both in multipliers (absolute and relative) and
occurs in Wearing apparel. The opposite tendency occurs in the case of Fabricated metal
products. Fishing has been loosing importance only in the absolute multipliers ranking
whereas Hotels and restaurants loose in relative multipliers.
On the other side, Transport and Financial services improve significantly the
position in the relative multipliers rank. The constancy of relative positions in elasticity
rankings between 1995 and 2005 is remarkable with only 3 sectors changing 3 positions
(the maximum change in the period): Financial and Health and social services improving;
Food products descending. This can be a further sign of the relatively low structural
changes in the Portuguese productive structure.
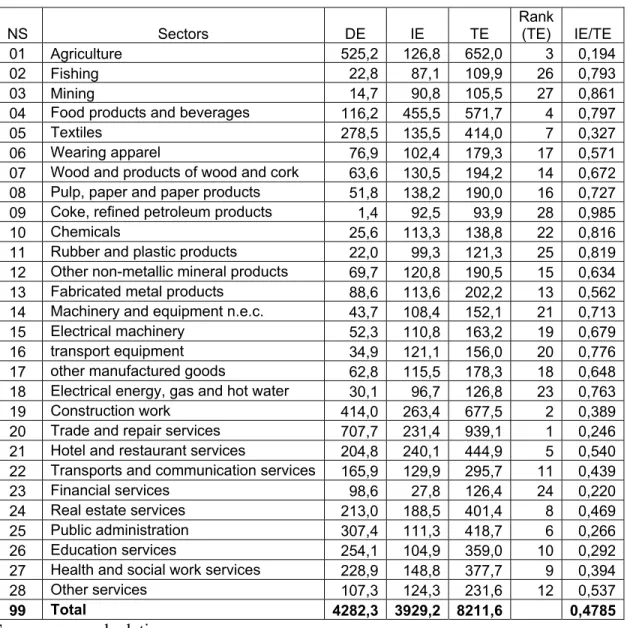
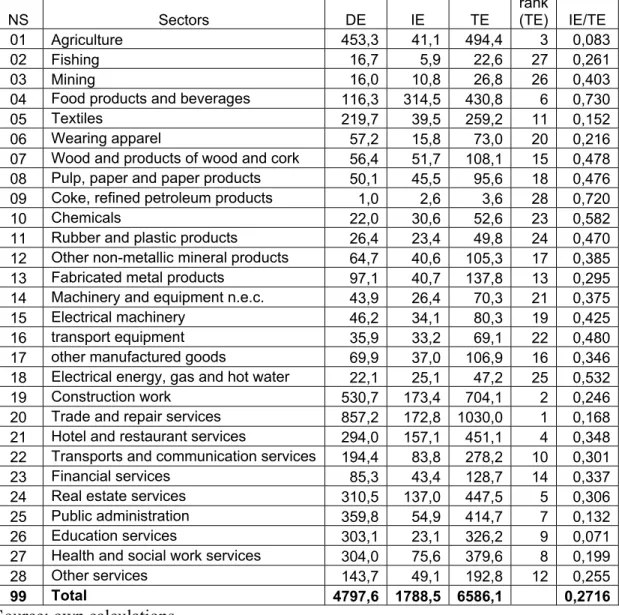
The results obtained with the more sophisticated method of hypothetical
extraction or “shut down of industry” hypothesis are shown in tables 4.3 (year 1995) and
4.4 (year 2005).
< Tables 4.3 and 4.4 About Here >
In these tables, the first column corresponds to direct effect (suppression of own
employment), the second represents indirect effect (suppression of other sectors’
employment due to backward and forward linkages with the extracted sector) and the
third is total (direct + indirect) effect. The rank of sectors is based on total effect and the
The (top 5) key sectors according to the total effect on employment (direct +
indirect) in 1995 are: Trade and repair services; Construction work, Agriculture, Food
products and beverages and Hotel and restaurant services. In 2005, the only change in
this list is the substitution of Real estate services (5th) for Food products (6th).
It is also interesting to note that there are sectors with very low importance in the
indirect effect induction of employment, such as Agriculture and Education services
(under 10% of total employment effect) and Public Administration, Trade, Textiles and
Health and social services (ratio under 20%).
On the other side, for Food products, Coke and refined petroleum products,
Chemicals and Electricity, gas and water the indirect effect surpasses the direct effect on
employment. In terms of economic policy measures directed to fighting unemployment
and job promotion in the economy at large, these should be the priority sectors in
Portugal.
4. Conclusions
Unemployment is one of the great problems in Portugal due to the weak growth
performance of the economy since 2001, the restructuring of the business sector to
respond to the globalization challenges and the efforts to consolidate the public finances
affecting public employment creation. The macroeconomic crisis of 2009 has seriously
In this paper, after quantifying the deleterious macroeconomic trends of the past
decade, a descriptive analysis of the Portuguese employment structure is made with the
main conclusion that some upgrading has been achieved between 1995 and 2005 but
maintaining a relatively high weight of traditional sectors (agriculture, textiles,
construction).
The main purpose of the paper was to further reinforce the analysis with an
interindustry approach based in the Leontief input-output model, starting with the
traditional employment multipliers and elasticities, and the application of the more
sophisticated “hypothetical extraction” or “shut down of industry” method. This approach
was theoretically exposed in Section 3, and its empirical results are presented and
discussed in section 4.
The most important sectors for employment creation (and so, unemployment
fighting) using multiplier and elasticity indicators and the direct effect in hypothetical
extraction quantifications are the traditional (low value added, and mainly non traded
goods producing) sectors of Trade services, Construction works, Real estate, Public
services, Agriculture and Textiles.
On the other side, if the indirect effects are taken into account (due to backward
and forward linkages) the key sectors appear to be Food products, Coke and refined
manufacturing products. Unfortunately, although increasingly important along the decade
here treated, these sectors still have a relatively weak weight in total employment.
So, the traditional dilemma persists for Portuguese policy makers of fighting
unemployment with short run support of traditional low value added, high employment
intensive, sectors or upgrade the productive structure with restructuring and supporting
high value added, strong productivity, sectors with heavy costs of employment
destruction.
Finally, it is important to recognize the limitations of the methodology used, first
of all, the apparent lack of reasonability of the hypothetical extraction method, because it
is non reasonable and in fact, for much cases, really impossible to “shut down a whole
industry”. However, this exercise is also valid for partial extractions, for instance, a great
company of a certain sector, given the linearity of the model and supposing that its
backward and forward linkages are “close to the average” of the sector. An interesting
example is given in Valadkhani (2003 b) with the assessment of jobs lost with the
collapse of Ansett (an Australian airline).
Other limitations are: the linear structure of the model; the constancy of labour
coefficients; the absence of inputs availability restrictions and the non consideration of
capital inputs or technological progress. But for a short run, static assessment and
this exercise can be valuable in helping to inform a strategy for employment creation and
consequent unemployment reduction.
References:
Amaral, J. F., Dias, J. and Lopes, J. C. (2011), A new kind of production and value added
multiplier for assessing the scale and structure effects of demand shocks in
input-output frameworks”, Annals of Regional Science, 2011, On-line first: 13 January
2011.
Amaral, J. F., Dias, J. and Lopes, J. C. (2007), Complexity as interdependence in
input-output systems”, Environment and Planning A, 39, 1770-82, 2007.
Dietzenbacher, E. and Lhar, M. (2008), Expanding extractions, Paper presented at the
2008 International input-Output Meeting, Seville.
DPP (2008), Sistema integrado de Matrizes Input-Output para Portugal, 2005,
Documento de Trabalho Nº 8/2008, Lisboa.
DPP (2004), Sistema Integrado de Matrizes de Input-Output para Portugal de 1995, a
Preços Correntes e a Preços de 1999, Lisboa.
Groenewold, N., Hagger, A. J. and Madden, J. R. (1993), Measuring Industry
Importance: An Australian Application, Annals of Regional Science, 27, 175-182.
Heimler, A. (1991), Linkages and Vertical Integration in the Chinese Economy, Review
of Economics and Statistics, 73, 261-267.
Hirshman, A. O. 1958. The Strategy of Economic Development. Yale University Press,
New Haven, CT.
Kay, D, Pratt, J. and Warner, M. (2007), Measuring the Role of Local Services with
Hypothetical Extraction, Growth and Change, 38(3).
Lopes, J. C., Amaral, J. F. and Dias, J. (2011), External dependency, value added
generation and structural change: an interindustry approach, Notas Económicas, 33,
6-19.
Mattas, W. F. and Shrestha, C. M. (1991), A new approach to determining sectoral
priorities in an economy: input-output elasticities, Applied Economics, 23, 247-54.
Meller, P. and Marfán, M. (1981), Small and Large Industry: Employment Generation,
Linkages, and Key Sectors, Economic Development and Cultural change, 29,
263-274.
Milana, C. (1985), Direct and Indirect Requirements for gross Output in Input-Output
Systems, Metroeconomic, 37, 283-292.
Miller, R. E. and Blair, P. D. (2009), Input-Output Analysis: Foundations and Extensions,
Second edition. New York: Cambridge University Press.
Ministério das Finanças (2011), Orçamento do Estado para 2012 - Relatório, Outubro de
2011, Lisboa (available at:
http://www.dgo.pt/oe/2012/proposta/Relatorio/Rel-2012.pdf )
OECD (2011), Economic Survey of the euro Area, Paris.
Paelink, J., Caevel, J. and Degueldre, J. (1965), Analyse Quantitative de Certaines
No. 7, Problèmes de Conversion Économiques : Analyses Théoriques et Études
Appliqués, Paris: M.-Th. Génin, pp. 341-387.
Rasmussen, P. N. 1957. Studies in Intersectoral Relations. North-Holland, Amsterdam.
Strassert, G. (1968), Zur Bestimmung Strategischer Sektoren mit Hilfe von Input-Output
Modellen, Jahrbücher für Nationalökonomie und Statistik, 182(3), 211-215.
Schultz, S. (1977), Approaches to Identifying Key Sectors Empirically by Means of
Input-Output Analysis, Journal of Development Studies, 14, 77-96.
Valadkhani, A. (2005), Cross-country analysis of high employment-generating industries,
Applied Economic Letters, 12, 865-9.
Valadkhani, A. (2003 a), An Input-Output Analysis to Identify Australia’s High
Employment Generating Industries, Australian Bulletin of Labour, 29(3), 199-217.
Valadkhani, A. (2003 b), How Many Jobs Were Lost With the Collapse of Ansett?,
School of Economics and Finance Discussion Paper No. 137, Queensland
Tables
Table 2.1 Economic and employment (annual) growth rates, Portugal and EU27
Years Real GDP Employment
Portugal UE27 Portugal UE27
1995 2,31 2,65 -0,75 0,61
1996 3,66 1,83 1,68 0,54
1997 4,38 2,73 2,62 0,63
1998 5,05 2,98 2,81 1,27
1999 4,08 3,06 1,37 0,73
2000 3,93 3,90 2,09 1,48
2001 1,97 1,98 1,82 0,90
2002 0,71 1,25 0,58 -0,10
2003 -0,93 1,35 -0,59 0,35
2004 1,56 2,51 -0,08 0,68
2005 0,76 1,96 -0,33 0,94
2006 1,44 3,21 0,51 1,66
2007 2,39 2,98 -0,04 1,81
2008 0,03 0,53 0,45 0,95
2009 -2,58 -4,23 -2,58 -1,82
2010 1,26 1,84 -0,93 -0,55
1995-2010 1,82 1,84 0,62 0,63
1995-2000 4,22 2,90 2,11 0,93
2001-2010 0,50 1,24 -0,34 0,43
Source: Ameco
Table 2.2 Unemployment rates in Portugal
Years Unemployment rate
Portugal EU27
2000 4,00 8,70
2001 4,10 8,50
2002 5,10 8,90
2003 6,40 9,00
2004 6,70 9,10
2005 7,70 8,90
2006 7,80 8,20
2007 8,10 7,20
2008 7,70 7,00
2009 9,60 8,90
Table 2.3 Employment indicators by sector in Portugal
NS Sectors Ei/ET
1995
Ei/ET
2005
Ei Abs.
Growth
Ei Rel.
Growth
01 Agriculture 12,26% 9,45% -71,895 -13,69%
02 Fishing 0,53% 0,35% -6,091 -26,73%
03 Mining 0,34% 0,33% 1,319 8,98%
04 Food products and beverages 2,71% 2,42% 0,098 0,08%
05 Textiles 6,50% 4,58% -58,817 -21,12%
06 Wearing apparel 1,80% 1,19% -19,708 -25,63%
07 Wood and products of wood and cork 1,49% 1,18% -7,21 -11,33%
08 Pulp, paper and paper products 1,21% 1,04% -1,685 -3,25%
09 Coke, refined petroleum products 0,03% 0,02% -0,4 -28,57%
10 Chemicals 0,60% 0,46% -3,551 -13,90%
11 Rubber and plastic products 0,51% 0,55% 4,428 20,15%
12 Other non-metallic mineral products 1,63% 1,35% -4,952 -7,11%
13 Fabricated metal products 2,07% 2,02% 8,473 9,56%
14 Machinery and equipment n.e.c. 1,02% 0,92% 0,162 0,37%
15 Electrical machinery 1,22% 0,96% -6,125 -11,71%
16 transport equipment 0,81% 0,75% 1,032 2,96%
17 other manufactured goods 1,47% 1,46% 7,112 11,33%
18 Electrical energy, gas and hot water 0,70% 0,46% -7,985 -26,54%
19 Construction work 9,67% 11,06% 116,655 28,17%
20 Trade and repair services 16,53% 17,87% 149,463 21,12%
21 Hotel and restaurant services 4,78% 6,13% 89,186 43,54%
22 Transports and communication services 3,87% 4,05% 28,532 17,20%
23 Financial services 2,30% 1,78% -13,272 -13,46%
24 Real estate services 4,97% 6,47% 97,547 45,81%
25 Public administration 7,18% 7,50% 52,425 17,06%
26 Education services 5,93% 6,32% 48,975 19,27%
27 Health and social work services 5,35% 6,34% 75,099 32,81%
28 Other services 2,50% 3,00% 36,449 33,98%
Table 4.1 Employment (traditional and relative) multipliers, Portugal 1995-2005
Emj
1995 rank
Emj
2005 rank
Rmj
1995 rank
Rmj
Table 4.2 Employment elasticities, Portugal 1995-2005
Eej 1995 rank Eej 2005 rank
01 Agriculture 0,0440 9 0,0342 10
02 Fishing 0,0041 24 0,0032 26
03 Mining 0,0023 27 0,0017 27
04 Food products and beverages 0,0861 3 0,0688 6
05 Textiles 0,0704 6 0,0496 8
06 Wearing apparel 0,0218 13 0,0143 14
07 Wood and products of wood and cork 0,0146 17 0,0127 18
08 Pulp, paper and paper products 0,0115 19 0,0098 21
09 Coke, refined petroleum products 0,0012 28 0,0000 28
10 Chemicals 0,0064 22 0,0071 22
11 Rubber and plastic products 0,0037 25 0,0057 24
12 Other non-metallic mineral products 0,0083 21 0,0070 23
13 Fabricated metal products 0,0089 20 0,0132 17
14 Machinery and equipment n.e.c. 0,0116 18 0,0122 19
15 Electrical machinery 0,0157 16 0,0142 15
16 transport equipment 0,0159 15 0,0135 16
17 other manufactured goods 0,0163 14 0,0163 13
18 Electrical energy, gas and hot water 0,0036 26 0,0038 25
19 Construction work 0,1253 2 0,1269 2
20 Trade and repair services 0,1358 1 0,1559 1
21 Hotel and restaurant services 0,0709 5 0,0767 5
22 Transports and communication services 0,0268 12 0,0331 11
23 Financial services 0,0064 23 0,0098 20
24 Real estate services 0,0381 10 0,0484 9
25 Public administration 0,0780 4 0,0857 3
26 Education services 0,0584 8 0,0654 7
27 Health and social work services 0,0670 7 0,0777 4
28 Other services 0,0272 11 0,0326 12
Table 4.3 Hypothetical extraction - sectoral employment results: 1995
NS Sectors DE IE TE
Rank
(TE) IE/TE
01 Agriculture 525,2 126,8 652,0 3 0,194
02 Fishing 22,8 87,1 109,9 26 0,793
03 Mining 14,7 90,8 105,5 27 0,861
04 Food products and beverages 116,2 455,5 571,7 4 0,797
05 Textiles 278,5 135,5 414,0 7 0,327
06 Wearing apparel 76,9 102,4 179,3 17 0,571
07 Wood and products of wood and cork 63,6 130,5 194,2 14 0,672
08 Pulp, paper and paper products 51,8 138,2 190,0 16 0,727
09 Coke, refined petroleum products 1,4 92,5 93,9 28 0,985
10 Chemicals 25,6 113,3 138,8 22 0,816
11 Rubber and plastic products 22,0 99,3 121,3 25 0,819
12 Other non-metallic mineral products 69,7 120,8 190,5 15 0,634
13 Fabricated metal products 88,6 113,6 202,2 13 0,562
14 Machinery and equipment n.e.c. 43,7 108,4 152,1 21 0,713
15 Electrical machinery 52,3 110,8 163,2 19 0,679
16 transport equipment 34,9 121,1 156,0 20 0,776
17 other manufactured goods 62,8 115,5 178,3 18 0,648
18 Electrical energy, gas and hot water 30,1 96,7 126,8 23 0,763
19 Construction work 414,0 263,4 677,5 2 0,389
20 Trade and repair services 707,7 231,4 939,1 1 0,246
21 Hotel and restaurant services 204,8 240,1 444,9 5 0,540
22 Transports and communication services 165,9 129,9 295,7 11 0,439
23 Financial services 98,6 27,8 126,4 24 0,220
24 Real estate services 213,0 188,5 401,4 8 0,469
25 Public administration 307,4 111,3 418,7 6 0,266
26 Education services 254,1 104,9 359,0 10 0,292
27 Health and social work services 228,9 148,8 377,7 9 0,394
28 Other services 107,3 124,3 231,6 12 0,537
99 Total 4282,3 3929,2 8211,6 0,4785
Source: own calculations
Table 4.4 Hypothetical extraction - sectoral employment results: 2005
NS Sectors DE IE TE
rank
(TE) IE/TE
01 Agriculture 453,3 41,1 494,4 3 0,083
02 Fishing 16,7 5,9 22,6 27 0,261
03 Mining 16,0 10,8 26,8 26 0,403
04 Food products and beverages 116,3 314,5 430,8 6 0,730
05 Textiles 219,7 39,5 259,2 11 0,152
06 Wearing apparel 57,2 15,8 73,0 20 0,216
07 Wood and products of wood and cork 56,4 51,7 108,1 15 0,478
08 Pulp, paper and paper products 50,1 45,5 95,6 18 0,476
09 Coke, refined petroleum products 1,0 2,6 3,6 28 0,720
10 Chemicals 22,0 30,6 52,6 23 0,582
11 Rubber and plastic products 26,4 23,4 49,8 24 0,470
12 Other non-metallic mineral products 64,7 40,6 105,3 17 0,385
13 Fabricated metal products 97,1 40,7 137,8 13 0,295
14 Machinery and equipment n.e.c. 43,9 26,4 70,3 21 0,375
15 Electrical machinery 46,2 34,1 80,3 19 0,425
16 transport equipment 35,9 33,2 69,1 22 0,480
17 other manufactured goods 69,9 37,0 106,9 16 0,346
18 Electrical energy, gas and hot water 22,1 25,1 47,2 25 0,532
19 Construction work 530,7 173,4 704,1 2 0,246
20 Trade and repair services 857,2 172,8 1030,0 1 0,168
21 Hotel and restaurant services 294,0 157,1 451,1 4 0,348
22 Transports and communication services 194,4 83,8 278,2 10 0,301
23 Financial services 85,3 43,4 128,7 14 0,337
24 Real estate services 310,5 137,0 447,5 5 0,306
25 Public administration 359,8 54,9 414,7 7 0,132
26 Education services 303,1 23,1 326,2 9 0,071
27 Health and social work services 304,0 75,6 379,6 8 0,199
28 Other services 143,7 49,1 192,8 12 0,255
99 Total 4797,6 1788,5 6586,1 0,2716