VAL)DAT)ON OF SEVERAL ATMOSP(ER)C STAB)L)TY )ND)CES
FOR T(E STORMS GENERAT)NG TORRENT)AL RA)N
S(OWERS )N T(E NORT(-WEST OF ROMAN)A
I. HAIDU1, T. TUDOSE1
ABSTRACT. – Validation of Several Atmospheric Stability Indices for the Storms Generating Torrential Rain Showers in the North-West of Romania.
The present study deals with the atmospheric instability types that lead to torrential rain formation in the North-Western part of Romania and with the role that certain stability indices play in establishing the atmospheric instability potential. years of warm season rainfall data from meteorological stations in the North-West of Romania have been analysed in this respect. The (ellman criterion was employed in order to establish the torrential character of the rainfall events, having made use of of such rainfall events in the analysed period - . Considering that the synoptic context of the torrential rain occurrence differs according to the instability type existing at the moment of their apparition, the analysis of the stability indices has taken this feature into consideration as well. (ence, three types of instability have been identified convective lifting, frontal lifting and that produced due to the cut off nuclei their analysis underlining the highest frequency of torrential rains caused by the convective lifting . % , followed by the frontal type . % and the cut off type . % , their highest percentage being registered in the summer. The values of stability indices have been taken into account K), VT, CT, TT) and L) , determined on the basis of the aerologic survey at GMT time, undertaken in Cluj-Napoca, plus two more modified indices KMOD and TTMOD. (aving analysed them, it was possible to identify the
most useful ones for determining the convective storms conditions generating torrential rains in the North-West region of Romania.
Keywords: torrential rains, stability indices, frontal lifting, cut off nuclei,
North-West of Romania.
1. INTRODUCTION
Torrential rain is an extreme pluviometric event with negative social and environmental effects. The registering of significant water quantities over shorter or longer time intervals can lead firstly, to flash-floods and secondly, to a soil suprasaturation and ponding of the water corresponding to the precipitation in excess. )n time, there were attempts to build conceptual models that would easily identify the favourable conditions
for several atmospheric processes. Consequently in Romania among the first baric structures types classifications and the weather conditions associated to them have been made by a group of researchers in the Meteorological )nstitute of Bucharest who found baric types Clima R.P.R., of interest for the studied region. For the warm season nevertheless there remain only four types ), V, V) and V)) . Other approaches in this respect have been made by Topor N. , and Topor N. and Stoica C. . As technology developed, a series of programs have been implemented that made possible an objective weather type classification, according to several quantifiable criteria in some pre-established points. (ence the automatic classification of the atmospheric circulation types allows an objective analysis of the synoptic situations that determine certain atmospheric processes. The studies and the zonal or regional approaches from the last years have taken another looks into the matter, due to the easiness with which large amount of terrestrial atmospheric parameters data can be dealt with nowadays. As a consequence, at the European level, the automatic classification of weather types has been made, on the basis of an international collaboration the COST Programme . The present study formulates the hypothesis that the atmospheric instability is the essential element for the torrential rain generation and seeks to validate several stability indices, in whose case the probability of torrential rain occurrence in the study area is high. The analysis doesn t refer to the spatial extent of the phenomenon. )t just wants to establish its occurrence according to several values of the analysed indices.
2. DATA AND METHODOLOGY
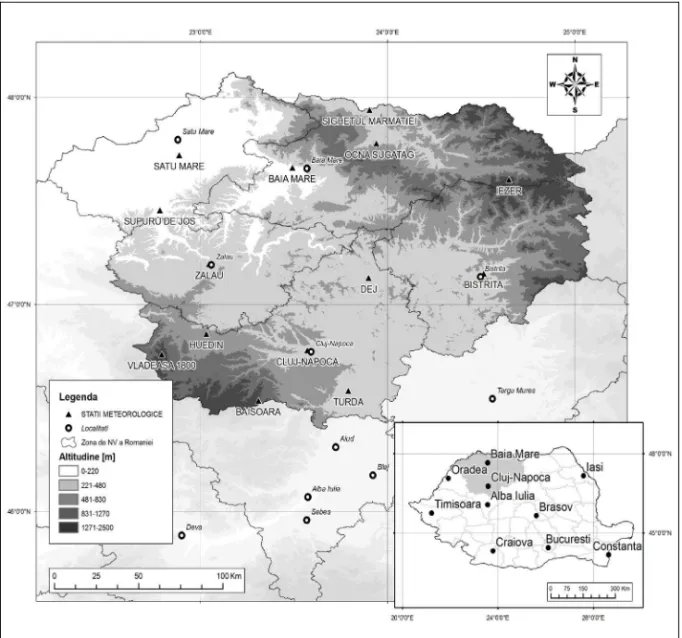
Torrential rain data from meteorological stations in the North-West of Romania has been used for the present study. The stations are set at altitudes ranging between m and m, their altitude structure being as it follows: Satu Mare m , Supuru de Jos m , Baia Mare m , Dej m , Sighetu Marmaţiei m , Zalău m , Bistriţa m , Cluj-Napoca m , Turda m , Ocna Şugatag m ,
(uedin m , Băişoara m , )ezer m and Vlădeasa m . The
spatial repartition of the observation points in the study unit can be seen in Fig. .
The rainfall data registered in the warm season April-October measured with the pluviograph at the mountainous stations situated above m Băişoara, )ezer, Vlădeasa has been taken into account, the annual analysis interval being actually a bit shorter namely June-September due to the snow and mixt precipitations occurrence in the other months. The total length of the study period is of years - .
Fig. 1. The meteorological stations in the analysed region.
3. RESULTS
A number of torrential rainfall events have been identified during the study period, the analysis of the synoptic materials for each rainfall event indicating the highest percentage for the rains generated by convective lifting . % , followed by those of frontal lifting . % and last, by the ones due to the „cut off type nuclei . % .
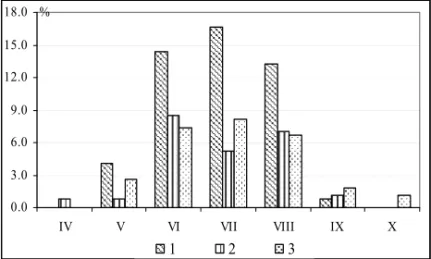
At a monthly scale, the torrential rains generated by the convective lifting occur starting with May and last till September, having a high percentage in July . % , June and August, summing up to a total of . % of their corresponding class. )t is obvious for the respective period that the heating during the day is the predominating type, as the air temperatures registered are the highest Fig. .
0.0 3.0 6.0 9.0 12.0 15.0 18.0
IV V VI VII VIII IX X
%
1 2 3
Fig. 2. Monthly frequency of torrential rains according to the instability type
- convective lifting; - instability associated to the cut off type nuclei; - frontal lifting
A similar monthly structure characterises the frontal lifting torrential rains as well, the frequency in the summer months cumulating to % of the total in their class. As compared to the rainfall events generated by mass instability, the frontal ones occur at the beginning of fall as well, hence situations as these being specific to the frontal warm passages or occluded ones that are more frequent at that time.
With respect to the altitudinal nuclei, the highest frequency of rain events is registered all over summer, but their monthly occurrence is different, the highest frequency being in June Fig. . The low percentage values at the middle of the summer are determined by the highly diminished frequency of the cut off nuclei in the analysed synoptic area, the synoptic structures being favourable to the mass induced instability type or the frontal one in the case of thalwegs or short waves .
The math expressions of the analysed indices are:
KI = (T850-T500) + Td850 – (T700-Td700), George,
KMOD = (T-T500) + Td – (T700-Td700),
where T = (Tsfc+T850)/2 and Td = (Tdsfc+Td850)/2, Charba
VT = T850-T500, Miller,
TTI = T850 + Td850 – 2T500, Miller,
TTMOD = T + Td - 2T500,
where T = (Tsfc+T850)/2 and Td = (Tdsfc+Td850)/2, Charba
LI = T500-Tp500, Sadowski and Rieck, where: - T , T , T air temperature at the level of , and hPa;
- Td , Td dew point temperature at the level of and hPa;
- Tsfc, Tdsfc air temperature, namely dew point temperature at the soil level;
- Tp temperature of the moist-adiabatic particle risen from the earth s surface
up to the hPa level.
K )ndex combines the air temperatures at the , and hPa and the dew point temperature at the and hPa levels .
The index in the form it was conceived, has been used for air mass instability determination, namely for those air masses not affected by the frontal passages or cyclonic ones George, . On the basis of the analysis, the authors conclude that K values higher than indicate an increase in frequency of the air mass instability. Other authors such as (ambrige , note that values below of this index can account for approximatively % of the frequency occurrence of convective lifting generated storms and those values above indicate an almost % probability of their apparition. Even more so, Rodgers et all. uses the values above for the prognosis at the basis of the Mesoscale Convective Complexes development. The threshold index values have been set by taking into account several appreciations regarding the occurrence probability of convective storms www.theweatherprediction.com , namely: K)= - , % occurrence probability; K)= - , - % occurrence probability; K)= - , - % occurrence probability; K)= - , - % occurrence probability; K)= - , - % occurrence probability and K)= > , above % occurrence probability.
Within the analysed unit, the K index values range between . and . , existing a series of differences according to the analysed instability type. For the convective lifting it can be noticed that the frequency of the low index values < is greater, and to some extent the same goes when it comes to the highest values, if compared to the situations for the other instability types Fig. , left . Nevertheless no matter what type of instability we would consider, the highest percentage values correspond to the - threshold, followed by the - and the values above . Overall the K) values higher than anticipate around to % of the registered torrential rains in the study area and those values above account for about to % of them, constituting according to the author s point of view, a relatively useful index for the prognosis of the storms generating torrential rains, no matter their generating instability type. )t can also be noticed that the use of the same index for the potential of occurrence determination of the storms generating torrential rains can be done for the two remaining types of instability, aside the one this index has been conceived for, given the good results.
Charba modifies the computation for the K KMOD index, taking into
account the air and dew point temperatures at the soil level . Once determined the K modified index in the analysed unit, the highest frequencies of the - . % and -. % can be seen, followed by the > threshold, these accumulating -. % of the total situations with torrential rains. The analysis of the KMOD index according to the
> Fig. , right . Taking into account the high frequency of the thresholds indicating a high occurrence probability of convective storms above % , the KMOD index is more
useful for the prognosis of these storm types, in comparison with the K) index.
0 5 10 15 20 25 30
<15 15-20 21-25 26-30 31-35 36-40 >40 KI %
1 2 3
0 5 10 15 20 25
<15 15-20 21-25 26-30 31-35 36-40 >40
KMOD %
1 2 3
Fig. 3. K) index distribution left and KMOD right according to value classes, according to the
generating instability type -convective lifting; - „cut off nuclei; - frontal lifting .
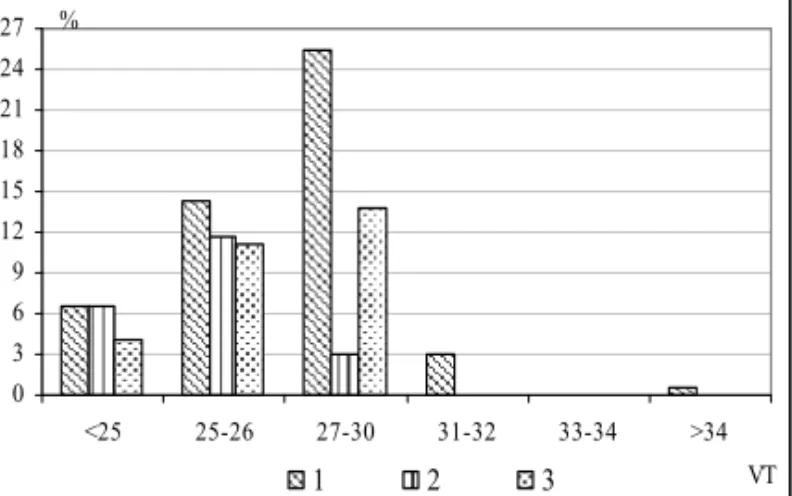
Vertical Totals )ndex VT is established on the basis of the temperature difference between the and hPa levels, without taking into account the air humidity . The studies undertaken for the present index in the USA Miller, , , establish as the lowest values for the convective storm occurrence the values above . Those values above indicate moderate storms; VT < indicate no storms; VT= - dispersed storms; VT= - , dispersed storms/ some are severe/ isolated tornadoes; VT= - dispersed storms and numerous/ a few tornadoes; VT= - , numerous storms/ a few tornadoes; VT > , numerous storms / dispersed and severe/ dispersed tornadoes.
0 3 6 9 12 15 18 21 24 27
<25 25-26 27-30 31-32 33-34 >34
VT %
1 2 3
Fig. 4. VT index distribution on class values, according to the instability type
-convective lifting; - cut off nuclei; - frontal lifting
threshold . , namely . % , and for the cut off nuclei, the one with values of - and below . The high percentage of the small threshold values of this index makes it very little usable for the prognosis of storms generating torrential rain events, especially when we think of the situations when the cut off nuclei exist.
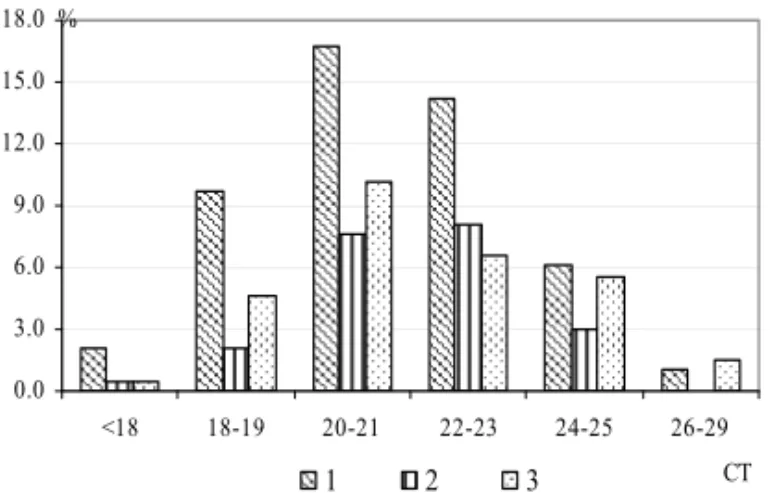
The Cross Totals )ndex CT , determined on the basis of air humidity in the hPa stratum and of the temperature at the hPa level , is characterised by a value of
as the bottom level for storm generation. For values under the occurrence potential is lower, whereas the values above indicate a higher probability of moderate storms in intensity and frequency Miller, , , . Regarding the mentioned extremes, when CT= - , there exists a moderate storm potential; CT= - , a strong storm potential; CT= - , a weak potential of severe storms; CT= - , a moderate potential of severe storms, and CT= > , a high potential of severe storms. For the analysed area, the extreme values of the present index range between . and . , major differences among the different types of atmospheric instability being inexistent. No matter what the instability type generating torrential rains is, the highest frequency of this index belongs to the - and - . These thresholds cumulate together between . % of the frontal rains and . % of the ones produced on the background of the cut off nuclei generated instability, the superior thresholds of the index being registered at low frequencies Fig. . Taking into account that the two mentioned thresholds do not indicate a high potential for severe storms such as the ones generating torrential rains , the use of this index in the establishment of the occurrence potential of storms has to be done in correlation with other indices KMOD or K) .
Total Totals )ndex TT) is determined on the basis of temperature values existing at the and hPa and that of the dew point at the hPa level . The index is used in prognosis for the spatial localizing of the formation area of convective storms. Regarding the value corresponding to this index Miller , , , on the basis of the studies made in the USA, established the inferior value at , whereas the values higher than are characteristic to the severe convective storms. )n practice the values of the TT) have been split in intervals corresponding to the convective storms intensity as it follows: TT)= - , low intensity storm; TT)= - , moderate storms; TT)= - , severe storms; TT)= - , severe storms; TT)= - , strong storms, possibly tornadoes; TT)= > , tornadoes.
0.0 3.0 6.0 9.0 12.0 15.0 18.0
<18 18-19 20-21 22-23 24-25 26-29
CT %
1 2 3
Fig. 5. CT )ndex distribution on different class values, according to the instability type
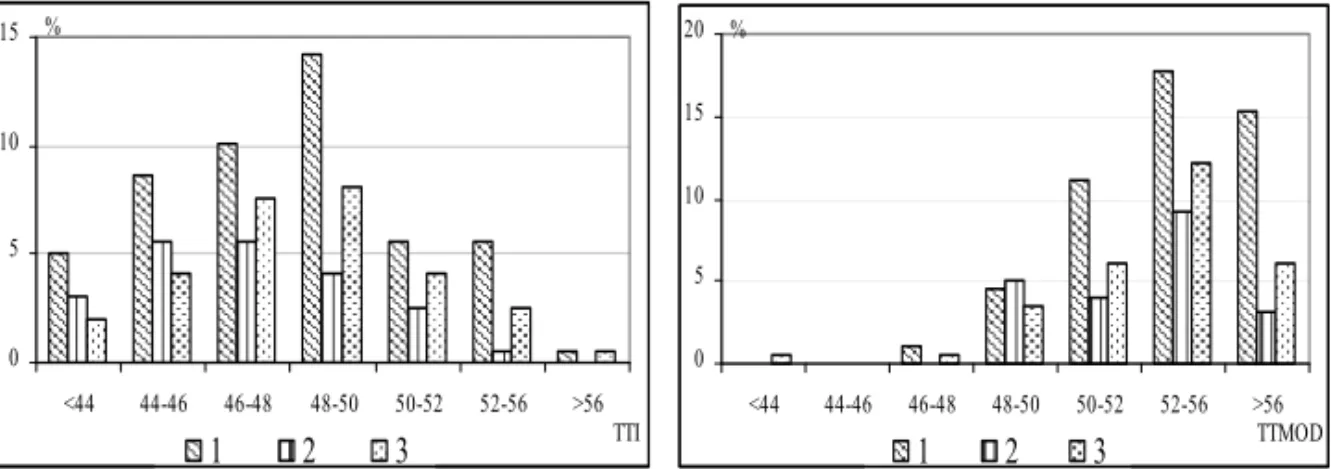
Overall, for the TT) index the highest frequency corresponds to the and thresholds, values indicating the strong and moderate storms registered especially during the frontal instability type as well as the one produced on the background of the cut off type nuclei Fig. , left . For the convective and frontal lifting, a high percentage can be seen in the values above , corresponding to the strong storms and tornadoes, the frequencies for each type of instability accumulating up to - %, hence the analysed index can be considered a useful tool in the prognosis of torrential rain for the two types of instability cases mentioned.
0 5 10 15
<44 44-46 46-48 48-50 50-52 52-56 >56 TTI %
1 2 3
0 5 10 15 20
<44 44-46 46-48 48-50 50-52 52-56 >56 TTMOD %
1 2 3
Fig. 6. TT) )ndex distribution left and TTMOD right , on different class values,
according to the instability type - convective lifting; - cut off lifting; - frontal lifting
Charba proposes a slightly modified relation for the computation of the TT) index, one that takes into account, similarly to the KMOD expression, the temperature
and the air humidity at the earth s surface level TTMOD, expression . The structures of
the frequency values of the TTMOD index differ from the one of the TT index, high
percentage values being noticeable in the cases of the high existing thresholds figure , right . )n general the highest frequencies characterise the - threshold . % and > . % , following the - threshold a bit above % , being noticeable the fact that the strong storms with TTMOD > accumulate up to . % of the total. During
instable conditions the predominance of the - and > thresholds can be seen, when convective lifting and frontal lifting occur, and that of the - and - thresholds, for the cut off nuclei Fig. , right . Regarding the absolute values, the highest frequency of the TTMOD values, higher than belongs to the convective lifting about two thirds ,
followed by the frontal lifting.
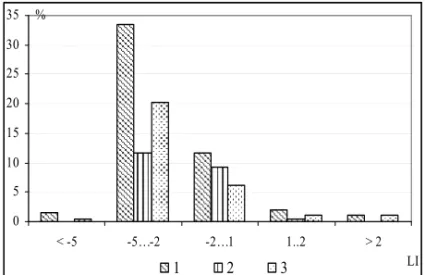
The Lifted )ndex L) indicates stability and it is used for the determination of the atmospheric potential of producing severe storms, rain showers. )t has been introduced in the prognosis of the convective storms in the USA as an additional predictor of latent instability. The determining of the index is done using values of the air temperature and of the humid adiabatic risen particle from the earth s surface up to the hPa level .
0 5 10 15 20 25 30 35
< -5 -5…-2 -2…1 1..2 > 2 LI %
1 2 3
Fig. 7. L) )ndex distribution on different class values, according to the instability type
- convective lifting; - cut off lifting; - frontal lifting
The class structures of the L index indicate that no matter what the type of the stability is, the negative values of this index are predominant between and % of the total of each instability type , with the highest percentages in the case of the - ...- class Fig. . According to the instability type, the highest frequencies of the lowest values of the index, the one that indicate storms and rainfalls L) = <- , are characteristic for the convective and frontal lifting with percent values of , namely %. These aspects lead to the conclusion that this indicator is a good one for signalling the convective storms formation that generate torrential rains in the study areas during the cases of convective lifting and frontal lifting.
4. CONCLUSIONS
K) is a useful index for the forecast of convective storms generating torrential rainfall events in the study area for all the instability types analysed and especially for the frontal lifting and convective lifting. The VT and CT )ndex are less used taking into account the high frequency of their low values, but the TT) which is a combination of the two is useful, especially for the instability forecast produced on the background of the convective lifting and frontal lifting.
L) is an efficient index for the prognosis of high instability areas especially in the case of convective lifting and frontal lifting. Plus, the KMOD and TTMOD indices come to
complete the more or less instable potential of the terrestrial atmosphere in its lower strata, contributing to the establishment of areas with atmospheric instability.
)t also has to be mentioned that for a more exact localization of the areas with significant atmospheric instability, these indices have to be correlated with other information regarding the dynamics in the medium and inferior atmospheric strata.
Another highlighted aspect is that the stability indices analysed, which take into account the humidity of several atmospheric strata, are the best for identifying the instability potential of the atmosphere K), KMOD, TT), TTMOD, L) .
R E F E R E N C E S
. Charba, J.P. , Two-to-six hour probabilities of thunderstorms and severe local storms.
NOAA NWS TPB- , pp.
. George, J.J. , Weather Forecasting for Aeronautics. New York, Academic Press, - .
. (ambridge, R.E. , 'K' chart application to thunderstorm forecasts over the western United States. ESSA Tech. Memo. WRTM- , pp.
. Miller, R.C. , Notes on analysis and severe storm forecasting procedures of the Military Weather Warning Center. Tech. Report , AWS, USAF. [(eadquarters, AWS, Scott AFB, L
]
. Miller, R.C., Bidner, A., and Maddox, R.A. , The use of computer products in severe weather forecasting (the SWEAT index). Air Weather Service Aerospace Sciences Review. AWS RP - ,
No. - , - .
. Miller, R.C., Maddox, R.A. , Use of the SWEAT and SPOT indices in operational severe storm forecasting. Preprints. Ninth Conf. Severe Local Storms. Norman, Amer. Meteor. Soc, - .
. Peppler, Randy , A review of static stability indicer and related thermodynamic parameters. The )llinois State Water Survey Division. Departament of Energy and Natural
Resources. - .
. Rodgers, D.M., Bartels, D.L., Menard, R.D. and Arns, J.(. , Experiments in forecasting mesoscale convective weather systems. Preprints. Tenth Conf. Weather Forecasting and Analysis.
Clearwater Beach, Amer. Meteor. Soc, - .
. Sadowski, A.F., Rieck, R.E. , Stability indices. NOAA NWS TPB- , pp.
. Topor, N. , Ani ploioşi şi secetoşi în R.P.R., C.S.A., Bucureşti.
. Topor, N., Stoica, C. , Tipuri de circulaţie şi centrii de acţiune atmosferică deasupra Europei, C.S.A., Bucureşti.
. *** , Clima R.P.R., vol ), C.S.A., ).M., Bucureşti
. *** , www.wetterzentrale.de . *** , http://weather.uwyo.edu . *** , www.noaa.gov