ORIGINAL ARTICLE
Detection of Genetic Variations in Marine Algae
Ulva
lactuca
(Chlorophyta) Induced by Heavy Metal Pollutants
Basel Saleh
Department of Molecular Biology and Biotechnology, AECS, P.O. Box 6091, Damascus, Syria
*E-Mail:
[email protected]
Received July 22, 2015
Ulva lactuca (Chlorophyta) green macroalgae has been successfully used as bioindicator for
heavy metals pollution in ecosystems. Random amplified microsatellite polymorphism
(RAMP) marker was employed to investigate genetic DNA pattern variability in green U.
lactuca 5 days after exposure to Cu, Pb, Cd and Zn heavy metals stress. Genomic template
stability (GTS%) value was employed as a qualitative DNA changes measurement based on
RAMP technique. In this respect, estimated GTS% value was recorded to be 65.215, 64.630,
59.835 and 59.250% for Pb, Cu, Cd and Zn treatment, respectively. Moreover, genetic
similarity (GS) induced by the above heavy metals was also evaluated to measure genetic
distance between algae treated plants and their respective control. In this respect, estimated
GS values generated by RAMP marker ranged between 0.576 (between control and Zn
treatment) - 0.969 (for both case; between Pb and Cu and between Cd and Zn treatment)
with an average of 0.842. Based upon data presented herein based on variant bands number
(VB), GTS% and GS values; the present study could be suggested that Pb and Cu followed
similar tendency at genomic DNA changes. Similar finding was also observed with Cd and Zn
ions. Thereby, RAMP marker successfully highlighted DNA change patterns induced by
heavy metals stress.
Heavy metals pollution is considered a threat to
the environmental ecosystem including seas, rivers
and lakes. This field has captured more attention
globally and this is due to the fact that, these
pollutants have high toxicity and they do not
decompose easily in the environment. Therefore,
many scientific reports studied the toxicity of heavy
metals, their effects on the environment, their ability to
enter the food chain and their threat on the health of
human being (Rainbow, 1995, 2002; Bing et al., 2013;
Khan et al., 2013). Many researches were focused on
the response of living organisms when they are
exposed to heavy metals, and the possible methods to
get rid of their toxicity. The most important advantage
of the use of living organisms to monitor the pollution
by heavy metals is the ability of heavy metals to be
concentrated in the organism's tissues; this allows the
monitoring of the moving part of the heavy metals in
the environment (Rainbow, 1995). The use of sea
creatures as a useful tool in environmental monitoring
goes back to the seventies of the last century. The
results obtained from those studies form an important
base in environmental monitoring. One of the most
important problems now is the ability to compare the
results obtained from different studies between
different creatures, and this is due to the fact that the
concentration of a heavy metals in an organism is
affected by many physiological and biological factors
(Rainbow, 2002). Previous studies have shown that
high plants respond differently to heavy metals in their
ecosystems. This might be due to the different genetic
make-up of the plants (De-Wolf et al., 2004). Aquatic
plants have great and noticed ability to concentrate
heavy metals in their tissues. Thus, they are known as
effective bioindicator to monitor the toxicity caused by
heavy metals (Gupta and Sarin, 2009).
Chemical pollutants may cause physical damage
to the sequence or the structure of DNA. These
damages can be detected using many genetic
markers. e.g. Swaileh et al. (2008) applied RAPD
marker to investigate genotoxicity induced by
wastewater in oat plants (Avena sativa). Gupta and
Sarin (2009) used RAPD and SCAR markers to
investigate Cd, Hg and Cu metals genotoxicity in two
aquatic plants. Al-Qurainy et al. (2010) studied
genotoxicity of Cd, Pb and Zn ions on Eruca sativa L.
using RAPD marker. Cansaran-Duman et al. (2011)
employed RAPD marker to detect genotoxicity in
Evernia prunastri L. Recently, Raj et al. (2014)
investigated tannery effluents impact on mung bean
plants using RAPD marker.
Thereby, the current study was carried out with
hopeful aim to investigate genotoxicity induced by Cu,
Pb, Cd and Zn chemical pollutants in Ulva lactuca
macrogreen algae using RAMP marker. Their
abundance along the Syrian coast of the
Mediterranean Sea was promising factor to use these
plants as bioindicator for heavy metals pollution.
MATERIALS AND METHODS
Algae sampling and chemical pollution
application’s: U. lactuca algae samples were
collected along the Syrian coast of the Mediterranean
Sea. Samples collection was carried out
(35°33ʹ790ʹʹN longitude and 35°43ʹ996ʹʹE latitude)
out by harvest only individual with the similar size with
disposable gloves. Algae were directly washed with
seawater where the algae were collected and then
transported within a flask with 5 L fresh seawater.
Algae were washed twice upon their arrival to the
laboratory, with autoclaved artificial seawater ASW
(500 mM NaCl, 10 mM KCl, 30 mM MgSO4, 10 mM
CaCl2 and 10 mM Tris-HCl at pH 7.8) medium as
previously described by Unal et al. (2010).
Then, they were divided to fresh flask with a fresh
ASW previously described solution and kept under
controlled laboratory conditions (Temperature of
20˚C, photoperiod of 12/12 h dark/light and
illumination of 2950 Lux (~48.7 µmol photons m-2
s-1
)
for 3 days before heavy metals stress application. The
mentioned ASW was considered as a control.
Chemical stress was applied by adding 18.2 mg/L of
Pb2+, 5.8 mg/L of Cu2+, 10.5 mg/L of Cd2+ and 9,9
mg/L of Zn2+
(Standard solution (1000 mg/L) from
Fisher Scientific –UK, under their nitrate forms) for
each treatment with three replicates/treatment.
Experiment was carried out in flask containing 300 mL
ASW with or without heavy metals. The same
previous described controlled conditions were
maintained during the experiment stress application.
Five days later, algae were harvested for genetic
study.
Total DNA extraction and RAMP marker
assay
Genomic DNA was isolated from algal tissues for
both of the control and stressed plants by a CTAB
(cetyltrimethylammonium bromide) protocol as
previously described by Doyle and Doyle (1987) with
minor modifications. Tissues (150 mg) were ground in
liquid nitrogen, the powder was transferred to a 2 mL
Eppendorf tube, homogenized with 900 μL of
extraction buffer (100 mM Tris-HCl, pH 8.0, 1.4 M
NaCl, 20 mM EDTA, 0.0018 mL β-mercaptoethanol,
2% CTAB), and incubated at 65°C for 20 min. One
volume of a chloroform:isoamyl alcohol mix (24:1, v/v)
was added, followed by centrifugation at 12,000 g for
10 min at 4°C. The aqueous phase was transferred to
a fresh tube, and the DNA was precipitated with an
equal volume of cold isopropanol and kept at -20°C
for 10 min. Then centrifuged at 12,000 g for 10 min at
4°C, the supernatant was eliminated; DNA was then
spooled out and washed with 1 M ammonium acetate
and 100% ethanol. The cleaned DNA pellet was air
dried and dissolved in 100 μL of 0.1X TE buffer (1 mM
Tris-HCl, 0.1 mM EDTA, pH 8.0). After addition of 5
μL of RNase (10 mg/mL), and incubation for 30 min at
37°C. DNA concentration was quantified by DNA
Fluorimeter at 260/280 nm and adjusted to final
concentration of 10 ng/μL. DNA was stored at -80°C
until needed.
RAMP technique consists of the combination of
two PCR-DNA based markers (RAPD and ISSR
primers). PCR amplification was performed as
previously reported by Saleh (2011). RAMP system
was applied using 26 (RAPD/ISSR) primer
combinations (Table 1) to detect DNA change
patterns induced by heavy metals stress compared to
their respective control.
RAMP-PCR amplification reactions were
performed in 25 µL reaction volume involving 1X PCR
primer (Operon Technologies Inc. USA), 1.5 U Taq
DNA polymerase (Fermentas) and 30 ng template
DNA. PCR amplification was carried out in a
T-gradient thermal cycler (Bio-Rad, Hercules, USA). It
was programmed for 35 cycles after an initial
denaturation cycle for 4 min at 94˚C. Where, each
cycle consisted of denaturation step 1 min at 94˚C,
followed by an annealing step for 2 min at 38˚C, and
then an extension step at 72˚C for 2 min, then an
extension cycle for 7 min at 72˚C as a final cycle. The
PCR products were then separated on a 1.8%
ethidium bromide-stained agarose (Bio-Rad,
Hercules, USA) in 0.5 X TBE buffer. Separation of
PCR products was performed by electrophoresis at
85 V for 2.5 h, and then visualized with a UV
transilluminator. A VC 100bp Plus DNA Ladder
(Vivantis) ladder standard was used to estimate
molecular weight of PCR amplification products.
Amplification patterns yielded by RAMP technique
was screened and photographed under UV light. The
presence or absence of each size class was scored
as 1 or 0, respectively. The estimated percent
disagreement values (PDVs) found were used as
template to generate a matrix via the Unweighted Pair
Group Mean Arithmetic average (UPGMA) using
Statistica program (Statsoft 2003). The latter matrix
was used to estimate genetic similarity distance
(Jaccard, 1908).
Genomic template stability (GTS%) test and
genetic similarity distance (GS)
Genomic template stability value was estimated as
previously reported by Atienzar et al. (2002) and
Cansaran-Duman et al. (2011) according to the
following formulate Eq. (1):
GTS% = (1 – a/n) x 100 (1)
Where (a) was RAMP polymorphic profiles
detected in each samples treated and (n) the number
of total bands in the control. Polymorphism observed
in RAMP profiles included disappearance of a normal
band and induction of a new band in comparison to
the control RAMP profiles.
Jaccard similarity (GS) index based on percent
disagreement values (PDV) was used as a
comparative analysis to demonstrate the genetic
distance among the control and the 4 examined ions.
RESULTS
Induced DNA alterations in U. lactuca algae has
been evaluated against 4 metals (Cu, Pb, Cd and Zn)
toxicity using RAMP marker. Data presented herein
mentioned that, one PC (AC)8T/OPR12 combination
fail to amplify algal DNA. Moreover, seven PCs (PC2,
PC4, PC5, PC9, PC10, PC13 and PC23)
combinations gave monomorphic pattern between
control and algae treated plants. So, 19 PCs out of 26
PCs combinations were used for monitoring DNA
changes induced by heavy metals stress in U.
lactuca. As shown in Fig. 1, DNA change patterns
induced by applied heavy metals stress as revealed
by PC8, PC21 and PC22 RAMP PCs combinations.
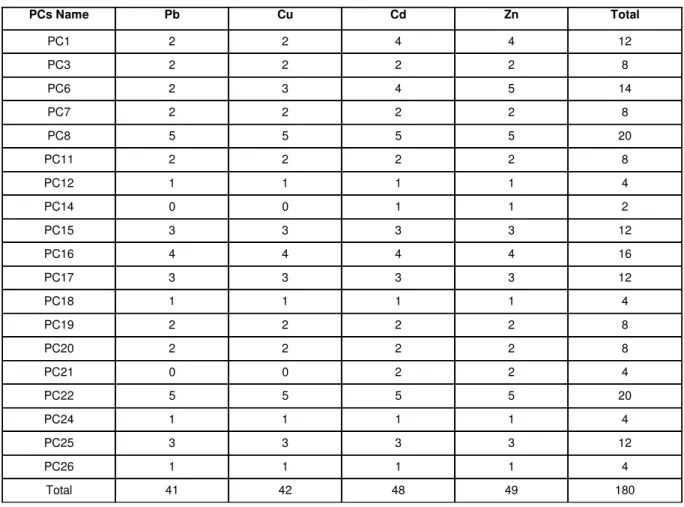
The identified variant bands (VB) yielded by 19
RAMP PCs combinations induced in U. lactuca algae
by heavy metal (Cu, Pb, Cd and Zn) stress compared
to their respective control were presented in Table 2.
Where, the total VB generated by the applied four ions
DNA change patterns in U. lactuca induced by
chemical pollutants (Cu, Pb, Cd and Zn) has been
investigated. From Table 2, it worth noting that, Pb
and Cu ions followed the same trend in terms of VB
characteristic for these examined ions. Where, VB
estimated for the latter mentioned ions were varied
between 1 (PC12, PC18, PC24 and PC26) and 5
(PC8 and PC22). As for Cd and Zn, they were also
followed the same trend in term of VB. In this respect,
VB estimated for these ions were also ranged
between 1 (PC12, PC14, PC18, PC24 and PC26) and
5 (PC8 and PC22).
DNA alteration induced by heavy metals stress
was expressed by a genomic template stability (GTS
%) for each ion treatment (Table 3). In this respect,
estimated GTS% values ranged between 28.571 with
PC22 combination for all tested ions, and 100% for
few PCs combinations according to the tested PCs
combinations and examined ions.
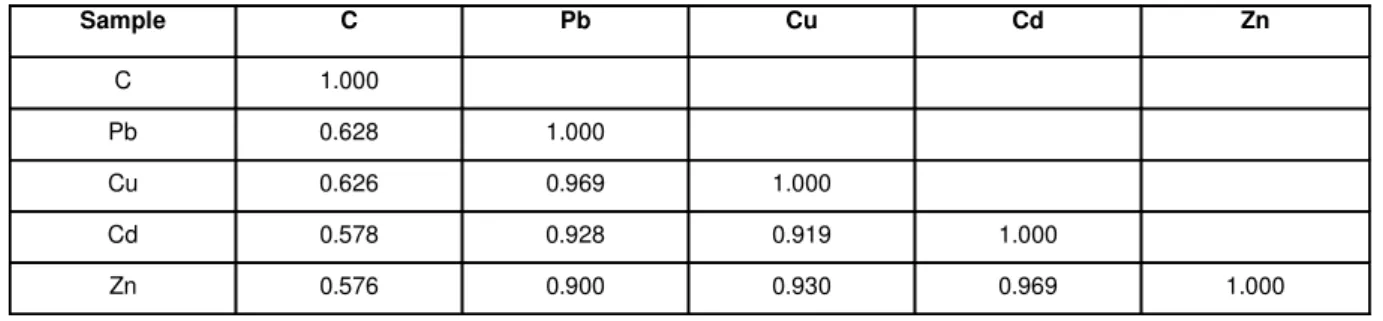
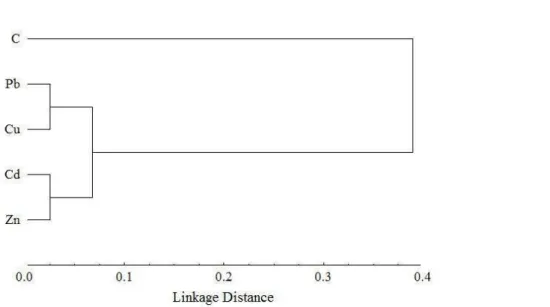
Jaccard similarity (GS) index to detect DNA
genetic distance induced by examined heavy metals
and their respective control was illustrated in Fig. 2.
Estimated GS values generated by RAMP marker
ranged between 0.576-0.969 (57.6-96.9%) with an
average of 0.842 (84.2%) (Table 4). In this respect,
the highest GS value was recorded to be 0.969
(96.9%) (with PDV= 0.03, Table 5) for both Cu and
Pb, and also between Cd and Zn treatment (Tables 4
& 5). Our data presented herein, demonstrated that
among the 19 RAMP PCs combinations, PC8 and
PC22 combinations gave the highest polymorphic
bands for all tested ions under their applied
concentrations in this study.
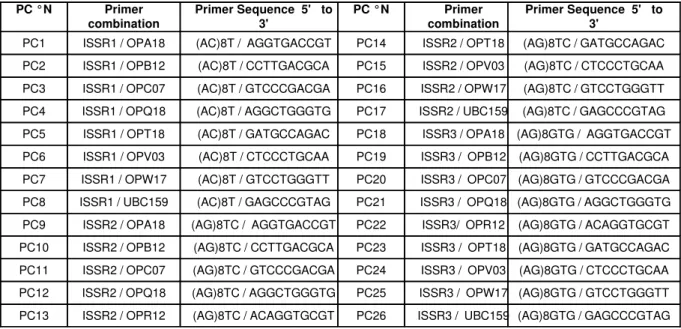
Table 1. RAMP primer combinations examined in this study.
PC °N Primer combination
Primer Sequence 5' to 3'
PC °N Primer combination
Primer Sequence 5' to 3'
PC1 ISSR1 / OPA18 (AC)8T / AGGTGACCGT PC14 ISSR2 / OPT18 (AG)8TC / GATGCCAGAC
PC2 ISSR1 / OPB12 (AC)8T / CCTTGACGCA PC15 ISSR2 / OPV03 (AG)8TC / CTCCCTGCAA
PC3 ISSR1 / OPC07 (AC)8T / GTCCCGACGA PC16 ISSR2 / OPW17 (AG)8TC / GTCCTGGGTT
PC4 ISSR1 / OPQ18 (AC)8T / AGGCTGGGTG PC17 ISSR2 / UBC159 (AG)8TC / GAGCCCGTAG
PC5 ISSR1 / OPT18 (AC)8T / GATGCCAGAC PC18 ISSR3 / OPA18 (AG)8GTG / AGGTGACCGT
PC6 ISSR1 / OPV03 (AC)8T / CTCCCTGCAA PC19 ISSR3 / OPB12 (AG)8GTG / CCTTGACGCA
PC7 ISSR1 / OPW17 (AC)8T / GTCCTGGGTT PC20 ISSR3 / OPC07 (AG)8GTG / GTCCCGACGA
PC8 ISSR1 / UBC159 (AC)8T / GAGCCCGTAG PC21 ISSR3 / OPQ18 (AG)8GTG / AGGCTGGGTG
PC9 ISSR2 / OPA18 (AG)8TC / AGGTGACCGT PC22 ISSR3/ OPR12 (AG)8GTG / ACAGGTGCGT
PC10 ISSR2 / OPB12 (AG)8TC / CCTTGACGCA PC23 ISSR3 / OPT18 (AG)8GTG / GATGCCAGAC
PC11 ISSR2 / OPC07 (AG)8TC / GTCCCGACGA PC24 ISSR3 / OPV03 (AG)8GTG / CTCCCTGCAA
PC12 ISSR2 / OPQ18 (AG)8TC / AGGCTGGGTG PC25 ISSR3 / OPW17 (AG)8GTG / GTCCTGGGTT
PC13 ISSR2 / OPR12 (AG)8TC / ACAGGTGCGT PC26 ISSR3 / UBC159 (AG)8GTG / GAGCCCGTAG
Table2. Number of variant bands identified by RAMP marker under heavy metals stress.
PCs Name Pb Cu Cd Zn Total
PC1 2 2 4 4 12
PC3 2 2 2 2 8
PC6 2 3 4 5 14
PC7 2 2 2 2 8
PC8 5 5 5 5 20
PC11 2 2 2 2 8
PC12 1 1 1 1 4
PC14 0 0 1 1 2
PC15 3 3 3 3 12
PC16 4 4 4 4 16
PC17 3 3 3 3 12
PC18 1 1 1 1 4
PC19 2 2 2 2 8
PC20 2 2 2 2 8
PC21 0 0 2 2 4
PC22 5 5 5 5 20
PC24 1 1 1 1 4
PC25 3 3 3 3 12
PC26 1 1 1 1 4
Total 41 42 48 49 180
Notes: PC: Primer combination.
Table 3. Genomic template stability (GTS%) estimated by RAMP marker.
PCs Name Control Pb Cu Cd Zn
PC1 100.000 80.000 80.000 60.000 60.000
PC3 100.000 75.000 75.000 75.000 75.000
PC6 100.000 77.778 66.667 55.556 44.444
PC7 100.000 71.429 71.429 71.429 71.429
PC8 100.000 37.500 37.500 37.500 37.500
PC11 100.000 50.000 50.000 50.000 50.000
PC12 100.000 75.000 75.000 75.000 75.000
PC14 100.000 100.000 100.000 80.000 80.000
PC15 100.000 40.000 40.000 40.000 40.000
PC16 100.000 50.000 50.000 50.000 50.000
PC17 100.000 40.000 40.000 40.000 40.000
PC18 100.000 80.000 80.000 80.000 80.000
PC19 100.000 71.429 71.429 71.429 71.429
PC20 100.000 60.000 60.000 60.000 60.000
PC21 100.000 100.000 100.000 60.000 60.000
PC22 100.000 28.571 28.571 28.571 28.571
PC24 100.000 85.714 85.714 85.714 85.714
PC25 100.000 50.000 50.000 50.000 50.000
PC26 100.000 66.667 66.667 66.667 66.667
Mean 100.000 65.215 64.630 59.835 59.250
Notes: PC: Primer combination.
Table 4 . Jaccard's similarity matrix among heavy metals treated plants and their control.
Sample C Pb Cu Cd Zn
C 1.000
Pb 0.628 1.000
Cu 0.626 0.969 1.000
Cd 0.578 0.928 0.919 1.000
Zn 0.576 0.900 0.930 0.969 1.000
Notes: C: control.
Table 5 . Percent Disagreement Values (PDV) yielded by RAMP marker.
Sample C Pb Cu Cd Zn
C 0.000
Pb 0.360 0.000
Cu 0.360 0.030 0.000
Cd 0.420 0.060 0.070 0.000
Zn 0.420 0.080 0.060 0.030 0.000
Figure 2. Dendrogram for RAMP marker showing genetic relationship among the U. lactuca control plants and heavy metals treated plants using UPGMA cluster analysis.
DISCUSSION
The unfavorable impact of four heavy metals (Pb,
Cu, Cd and Zn) was evaluated in U. lactuca at genetic
level. Genotoxicity of the above mentioned ions has
been manifested by comparing DNA patterns under
treatment compared to their respective control.Where
the heavy metals application induced DNA alterations
(loss or/and gain bands). According to Atienzar and
Jha (2006), in genotoxicity study, the new induced
bands could be related to DNA mutation as previously
reported by Atienzar et al. (2002), who suggested that
DNA mutation is response to a new bands induction, if
the mutation occurs at the same locus in sufficient
number of cells. While, the disappeared bands could
be related to DNA damages.
Nineteen RAMP PCs primer combinations were
employed for screening DNA change patterns induced
by the mentioned ions. In this respect, PC8 and PC22
combinations yielded the highest VB for the tested
four ions compared to the other examined PCs
combinations. Overall, the VB induced with the four
ions was in the following order of 41, 42, 48 and 49
bands for Pb, Cu, Cd and Zn ion treatment,
respectively. Comparative assessment among the 4
examined ions in other investigation in term of total
bands (TB) and polymorphic level (P%) (data not
shown here) revealed that, TB number was recorded
to be 92, 95, 91 and 96 bands with 34.8, 35.4, 40.2
and 40.7% as P% for Pb, Cu, Cd and Zn ion
treatment, respectively.
Where, Swaileh et al. (2008) applied 15 RAPD
primers to investigate genotoxicity induced by
wastewater in oat plants (Avena sativa). Al-Qurainy
(2009) reported DNA changes induced by toxic Al and
Ni ions on Phaseolus vulgaris L. using RAPD marker.
The previous study revealed that among 10 RAPD
tested primers, 5 produced monomorphic bands and
4 gave unique bands. This investigation allowed
identifying genes involved in plant response to Al and
Cansaran-Duman et al. (2011) investigated air pollution using 21
RAPD primers to detect genotoxicity in Evernia
prunastri L. collected from different polluted areas in
Turkey. The same study mentioned that, 13 out of 21
tested RAPD primers produced reproducible bands. In
this respect, the highest polymorphic bands were
found in areas closed to the railways and motorways
and station near to the iron-steel factory.
Recently, Raj et al. (2014) stated that, the total
number of bands were recorded to be 33 as
disappeared and 20 as a new produced bands in
mung bean plants with untreated effluent compared to
their respective control. Indeed, the same
investigation indicated the appearance of 12 new
bands with disappearance of 18 bands was observed
in mung bean plants with untreated effluent compared
to their respective control. While, this number was
recorded to be 15 and 8 bands for disappeared and
new appeared bands respectively in plants treated
with effluent.
Previously, Gupta and Sarin (2009) applied 7
RAPD and 4 SCAR primers to investigate DNA
changes induced by Cd, Hg and Cu metals in two
aquatic plants. The previous study indicated a
reduction in GTS was correlated with decrease in
chlorophyll and protein content. Similar finding was
reported in marine Palnaria palnata (Atienzar et al.,
2000). The latter study stated that GTS was
decreased under UV treatment.
RAPD marker successfully applied to detect DNA
changes induced in plants by heavy metals (Enan,
2006; Swaileh et al., 2008; Cenkci et al., 2009;
Cansaran-Duman et al., 2011; Liu et al., 2012; Raj et
al., 2014). In this regards, Al-Qurainy (2010)
investigated the genotoxicity of Cd, Pb and Zn ions on
Eruca sativa L. after 8 days exposure using 20 ISSR
primers. The previous study mentioned that, GS value
ranged between 42.8-100%. Otherwise, the same
study mentioned that among the 20 ISSR tested
primers, only two primers (OPC5 and OPC7)
produced the highest bands with 150 mg/L of Cd and
Pb treatment. Whereas, Al-Qurainy et al. (2010)
reported the genotoxicity of Cd, Pb and Zn ions on E.
sativa L. after 8 days exposure using 20 RAPD
primers. The previous investigation revealed that,
Jaccard similarity value ranged between
47.83-95.83%. Moreover, the latter study indicated that
among the 20 RAPD tested primers, only three
primers (OPC11, OPC12 and OPC13) produced the
highest bands with 150 mg/L of Cd and Pb treatment.
Recently, Raj et al. (2014) reported induced DNA
changes on mung bean by tannery effluents (CETP)
using RAPD marker. The latter study gave a total
bands of 87 of which 42 (48%) were polymorphic
using 8 RAPD primers. Indeed, Nei’s similarity
between control and treated plants was found to be
0.75.
In the current study, cluster analysis test showed
the low genetic distance between the 4 tested ions
compared to untreated plants. Where, Pb and Cu ions
caused similar DNA changes (PDV = 0.03; with GS =
0.969). Similarly, Cd and Zn ions showed the same
tendency (PDV = 0.03; with GS = 0.969). Our data
were in accordance with previous findings of Enan
(2006), who reported a clear distance between control
and Cu exposure.
The observed VB detected in the case of Pb and
Cu treatment could be suggested that the two
previous ions could be caused similar DNA change
patterns. Similar tendency could be also observed
with Cd and Zn treatment suggesting that these ions
exhibited the same impact on DNA alterations. In this
regards, Enan (2006) reported that Cu and Cd ions
may cause similar DNA modification in P. vulgaris L.
treated plants compared to their respective control.
Based upon the estimated VB, GTS% and GS
values; the current study could be suggested that Pb
and Cu followed similar tendency at genomic DNA
changes. Similar finding was also observed with Cd
and Zn ions.
In conclusion, genotoxicity of 4 heavy metals (Pb,
Cu, Cd and Zn) ions was evaluated on U. lactuca
algae using RAMP marker. DNA changes induced by
the above mentioned ions were investigated by
monitoring loss or gain bands profile yielded under
each treatment compared to their respective
reference. Number of VB, GTS% and Jaccard’s GS
values were estimated to investigate genetic variation
induced by the previous heavy metals on U. lactuca
algae. Where, Pb and Cu treatment exhibited relatively
highest GTS% with lowest number of variant bands
reflecting that these ions caused similar DNA
changes. Indeed, Cd and Zn ions revealed similar
tendency regarding DNA alterations. Thereby, the
current study revealed that RAMP marker could be
considered as a potential and sensitive tool for
investigation induced DNA changes by heavy metals.
Based upon our data, it is recommended to use of U.
lactuca algae as useful bioindicator to investigate
heavy metals pollution in ecosystems as previously
reported in many investigations. Furthermore, heavy
metals genotoxicity should be performed by testing
different ion concentrations. Otherwise, physiological
and biochemical studies performance is needed; that
could be considered as a useful support to molecular
assay. Thereby, give a clear image about the specific
genotoxicity impact of these ions in ecosystems.
REFERENCES
Al-Qurainy, F. (2009) Toxicity of heavy metals and
their molecular detection on Phaseolus vulgaris
(L.). Aust. J. Basic. Appl Sci., 3: 3025-3035.
Al-Qurainy, F. (2010) Application of inter simple
sequence repeat (ISSR marker) to detect
genotoxic effect of heavy metals on Eruca sativa
(L.). Afr. J. Biotechnol.,9: 467-474.
Al-Qurainy, F., Alameri, A.A. and Khan, S. (2010)
RAPD profile for the assessment of genotoxicity
on a medicinal plant; Eruca sativa. J. Med. Plant.
Res.,4: 579-586.
Atienzar, F.A., Cordi, B., Donkin, M.B., Evenden, A.J.,
Jha, A.N. and Depledge, M.H. (2000)
Comparison of ultraviolet-induced genotoxicity
detected by random amplified polymorphic DNA
with chlorophyll fluorescence and growth in a
marine macroalgae, Palmaria palmate. Aquat.
Toxicol.,50: 1–12.
Atienzar, F.A., Venier, P., Jha, A.N. and Depledge,
M.H. (2002) Evaluation of the random amplified
of DNA damage and mutations. Mutat. Res., 521:
151–163.
Atienzar, F.A. and Jha, A.N. (2006) The random
amplified polymorphic DNA (RAPD) assay and
related techniques applied to genotoxicity and
carcinogenesis studies: a critical review. Mutat.
Res., 613: 76-102.
Bing, H., Wu, Y., Liu, E. and Yang, X. (2013)
Assessment of heavy metal enrichment and its
human impact in lacustrine sediments from four
lakes in the mid-low reaches of the Yangtze
River, China. J. Environ. Sci., 25: 1300-1309.
Cansaran-Duman, D., Atakol, O. and Aras, S. (2011)
Assessment of air pollution genotoxicity by RAPD
in Evernia prunastri L. Ach. from around an
iron-steel factory in Karabük, Turkey. J. Environ. Sci.,
23: 1171–1178.
Cenkci, S., Yildiz. M., Ciğerci, I.H., Konuk, M. and
Bozdağ, A. (2009) Toxic chemicals-induced
genotoxicity detected by random amplified
polymorphic DNA (RAPD) in bean (Phaseolus
vulgaris L.) seedlings, Chemosphere., 76: 900–
906.
De-Wolf, H., Blust, R. and Backeljiau, T. (2004) The
use of RAPD in ecotoxicology: A review. Mutat.
Res., 566: 249–262.
Doyle, J.J. and Doyle, J.L. (1987) A rapid DNA
isolation procedure for small quantities of fresh
leaf tissue. Phytochem. Bull., 19: 11–15.
Enan, M.R. (2006) Application of random amplified
polymorphic DNA (RAPD) to detect the genotoxic
effect of heavy metals. Biotechnol. Appl.
Biochem., 43: 147-154.
Gupta, M. and Sarin, N.B. (2009) Heavy metal
induced DNA changes in aquatic macrophytes:
Random amplified polymorphic DNA analysis
and identification of sequence characterized
amplified region marker. J. Environ. Sci., 21:
686–690.
Jaccard, P. (1908) Nouvelles recherches sur la
distribution flora. Bull. Sac. Nat., 44: 223–270.
Khan, M.U., Malik, R.N. and Muhammad, S. (2013)
Human health risk from heavy metal via food
crops consumption with wastewater irrigation
practices in Pakistan. Chemosphere., 93:
2230-2238.
Liu, W., Sun, L., Zhong, M., Zhou, Q., Gong, Z., Li, P.,
Tai, P. and Li, X. 2012. Cadmium-induced DNA
damage andmutations in Arabidopsis plantlet
shoots identified by DNA fingerprinting.
Chemosphere., 89: 1048–1055.
Rainbow, P.S. (1995) Biomonitoring of heavy metal
availability in the marine environment. Marine.
Poll. Bull., 31: 183–192.
Rainbow, P.S. (2002) Trace metal concentrations in
aquatic invertebrates: why and so what? Environ.
Poll.,120: 497–507.
Raj, A., Kumar, S., Haq, I. and Kumar, M. (2014)
Detection of tannery effluents induced DNA
damage in mung bean by use of Random
Amplified Polymorphic DNA markers. ISRN
Saleh, B. (2011) R-ISSR marker as a useful tool for
detection of new genomic loci in Arthrocnemum
macrostachyum. Biol. Plantarum., 55: 327-330.
Statsoft. Statistica (Data analysis software system),
version 6. Statsoft Inc. 2003. www.statsoft.com.
Swaileh, K.M., Hussein, R. and Ezzughayyar, A.
(2008) Evaluating wastewater-induced plant
genotoxicity using randomly amplified
polymorphic DNA. Environ. Toxicol., 23: 117–
122.
Unal, D., Isik, N.O. and Sukatar, A. (2010) Effects of
chromium VI stress on green alga Ulva lactuca