URBAN GROWTH MODELING USING ANFIS ALGORITHM:
A CASE STUDY FOR SANANDAJ CITY, IRAN
Mohammady, S. 1, M. R. Delavar2 andB. C. Pijanowski3
1
GIS MSc. student, Dept. of Surveying and Geomatics Eng., College of Eng.,
University of Tehran, Tehran, Iran [email protected]
2
Center of Excellence in Geomatic Eng. in Disaster Management, Dept. of Surveying and Geomatic Eng., College of Eng., University of Tehran, Tehran, Iran
3
Dept. of Forestry and Natural Resources, College of Agriculture, Purdue University, West Lafayette, IN 47907, USA
KEY WORDS: Urban Growth, Modelling, ANFIS, GIS
ABSTRACT:
Global urban population has increased from 22.9% in 1985 to 47% in 2010. In spite of the tendency for urbanization worldwide, only about 2% of Earth's land surface is covered by cities. Urban population in Iran is increasing due to social and economic development. The proportion of the population living in Iran urban areas has consistently increased from about 31% in 1956 to 68.4% in 2006. Migration of the rural population to cities and population growth in cities have caused many problems, such as irregular growth of cities, improper placement of infrastructure and urban services. Air and environmental pollution, resource degradation and insufficient infrastructure, are the results of poor urban planning that have negative impact on the environment or livelihoods of people living in cities. These issues are a consequence of improper land use planning.
In this research, an ANFIS method has been developed for modeling land use change and interpreting the relationship between the drivers of urbanization. Our study area is the city of Sanandaj located in the west of Iran. Landsat images acquired in 2000 and 2006 have been used for model development and calibration. The parameters used in this study include distance to major roads, distance to residential regions, elevation, number of urban pixels in a 3 by 3 neighborhood and distance to green space. Percent Correct Match (PCM) and Figure of Merit were used to assess model goodness of fit were 93.77% and 64.30%, respectively.
1.
Introduction
Urban population in the world has been increased from 22.9% in 1985 to 47% in 2010. Tendency to urbanization and rapid population growth has resulted that above 2% of Earth's land surface covered by urban areas [1]. One of the results of this urban population growth is large-scale urban expansion [2, 3]. Rapid growth of urban areas has led to complex problems, including reduced open space, traffic problems, environmental pollution, the deterioration of old and unplanned or poorly planned land development [4]. One of the major problems in intelligent management of cities is the lack of proper and scientific development and as a result destruction of agricultural land, urban development in high slope and elevations, environmental deteriorate and natural hazards, increased infrastructure and utilities costs and the lack of optimum use of land have been encountered. Thus, monitoring of land use changes is needed to understand and predict the dynamic process of land use patterns at different times. A vital component of the research on land use/cover change is the analysis of rates and patterns of land use change which is a powerful tool for urban planners, city and resource managers [5, 6, 7, 8]. Land use change models as a tool are used to show where, when and how changes could arise in the future in order to adapt current public policy [9,10]. In the past decades, different models have been developed to exhibit and quantify land use changes [11, 12, 13, 14], mainly in land-use change (LUC) models. In this paper we implement ANFIS algorithm as a new approach in environmental modeling such as urban growth modeling. Percent Correct Match (PCM) and Figure of Merit (FoM) have been used to evaluate urban growth modeling accuracy.
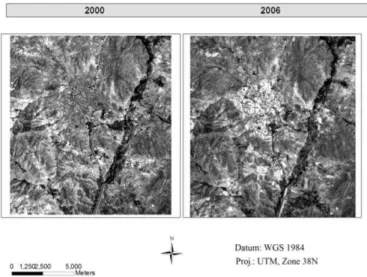
In recent decades, remote sensing data and Geospatial Information System (GIS) have been widely applied for identification and analyses of land use change in metropolitan area [15, 16, 17, 18, 19, 20, 21]. Remote sensing imageries data have been used in urban growth modeling, urban morphology and land uses [22, 23, 24], quantifying land use dynamics and urban growth [25, 26, 27, 28]. Geospatial Information Systems (GIS) are widely used to represent, analyze, and display various spatial data such as remote sensing, topography, soil type, rainfall and vegetation [29]. In this study, two Landsat TM and ETM+ satellite imageries with 28.5m and 30m spatial resolution acquired in 2000 and 2006 were used. These images were obtained from the United States Geological Survey (USGS) portal. Data were projected to a World Geodetic System (WGS) 1984, Universal Transverse Mercator (UTM) Zone 38N coordinate system. Registration errors were about 0.50 pixels. The 2000 and 2006 Landsat imageries were classified according to Anderson level 1 with ENVI software. Maximum Likelihood classification has been used to classify the imageries. Overall accuracy and kappa coefficient of these imageries were 94.71% and 92.68% for 2006, 92.57% and 89.17% for 2000, respectively. Fig.1 shows the Landsat imageries. We have used 10% of 2000 and 2006 imageries data for calibrating models and rest of the data have used to simulate the urban pattern at 2006. Datasets employed include five parameters include distance to roads, distance to green spaces, distance to residential areas, elevation and number of urban pixels in a 3*3 neighborhood. Following [30], each value in an entire predictor variable map (e.g., distance to green space) was normalized by dividing each value by the maximum value contained in the predictor variable map (Fig. 2).
Figure1 Sanandaj satellite imageries
2.
Methods
ANFIS is a multi-layer adaptive network-based fuzzy inference system proposed by [31]. Fuzzy inference system is a method which the most important feature is its ability to apply human knowledge and expertise causing this system to be very close to human perception. In addition, it is a powerful tool for modeling uncertainties associated with human cognition, thinking and perception. This flexibility is one of its advantages. The most important problem in fuzzy inference system is finding proper membership function for each fuzzy variable. On the other side, ANN has the ability to learn pattern and relationship between data from educational data. Combining these two methods is the way to learn human knowledge. Furthermore, it cover a number of shortcomings, such as the problem of finding the correct position and shapes for membership functions in fuzzy inference system and lack of flexibility in neural network. In other words, learning, use of human knowledge and flexibility are ANFIS advantages which make this method to be very suitable to solve some of complex systems. In the other words, during the learning process, membership functions changes toward their optimal values.
In this study we implemented a grid partition ANFIS which Gaussian bell function is the membership function. Table 1 describes the membership functions (mf) in this study. MSE were obtained 0.2085 in 100 epochs.
Inputs mf Number of mf
Dis2 green space Gaussian bell 3
Dis2 residential area Gaussian bell 3
Dis2 main road Gaussian bell 3
number of urban pixels in a 3*3 neighborhood
Distance to residential area
Elevation Distance to main roads
Distance to Green spaces
Result and Discussion
The study area in this research is Sanandaj city, in the west of Iran. In the past few decades, Sanandaj has shown remarkable urban growth. One of the reasons for the rapid population growth in this in this city is migration from neighboring cities and even from neighboring provinces to the city because of the economic and social potential of this city. We evaluated our accuracy using FoM and PCM parameters. According to the definition of these parameters, they are good parameters to show us modeling accuracy.
b
Figure of Merit
a b c
d
(1)where;
a=error due to observed change predicted as persistence
b=correct due to observed change predicted as change
c=error due to observed change predicted as wrong gaining category
d=error due to observed persistence predicted as change
Figure of Merit
Figure of Merit (Equation 1) is a method to evaluate resemblance between actual and simulated map suggested first time by [32]. If simulated map have a high goodness of fit to actual map, Figure of Merit will be high and vice versa.
PCM
Percent Correct Match (PCM) is a way to evaluate models of urban development. This method compares only the parameters of the original diameter of the A and D in the confusion matrix using Equation 2 (Table 2) [33].
A D
PCM
A B C
D
(2)Model
Change
Non Change
Total
Reality
Change Non Change Total
A B A+B
C D C+D
A+C B+D A+B+C+D
Table 2. Confusion matrix
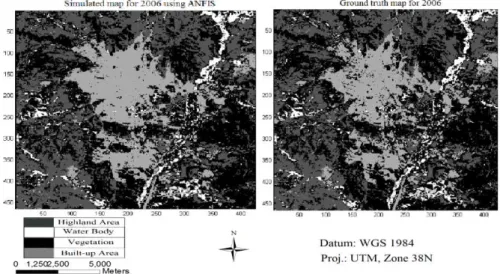
After the model calibration using historical observed data (10%) of the year 2000 and 2006, the model simulated (the rest of the
data) the urban pattern (year 2006) based on current urban growth trends (Fig. 3).
Figure 3 Simulated map compare with ground truth map for 2006
Conclusion
This study employed ANFIS algorithm in urban growth modeling for Sanandaj city between 2000 and 2006 (Fig 5). PCM and FoM are obtained 93.77% and 64.30%, respectively.
The rum time program in this algorithm directly depend on the number of membership functions. On the other hand, greater number of membership function means better accuracy. Thus,
selection of proper number of membership function is a big challenge in using ANFIS.
The implemented algorithm, can be considered as a powerful method in environmental modeling such as urban expansion pattern. This method employ ANN and fuzzy inference system abilities to understand relation between inputs and output and perceive complex pattern such as urban patterns.
References
[1] Grimm, N. B., Grove, J. M., Pickett, S. T. A., & Redman, C. L., 2000, Integrated approaches to long-term studies of urban ecological systems. Bioscience, 50(7), 571–584.
[2] Seto, K. C., Kaufmann, R. K., Woodcock, C. E., 2000,
Landsat reveals China’s farmland reserves, but they’re vanishing
fast, Nature 406(6792): 121.
[3] Tan, M., Li, X., Xie, H., & Lu, C., 2005, Urban land expansion and arable land loss in China – A case study of Beijing-Tianjin-Hebei region. Land Use Policy, 22(3), 187–196
[4] Parka, S., S, Jeon., S, Kim., and C, Choi., 2011, Prediction and comparison of urban growth by land suitability index mapping using GIS and RS in South Korea Landscape and Urban Planning, 99, 104–114
[5] GLP, Science Plan and Implementation Strategy, 2005. IGBP Report 53 / IHDP Report 19. IGBP Secretariat, Stockholm.
[6] Lambin, E.F., Geist, H. (Eds.), 2006. use and Land-cover Change: Local Processes, Global Impacts. The Synthesis
of Sciences of the United States of America, 101(39), 13976–13981.
[8] Turner II, B.L., Lambin, E.F., and Reenberg, A., 2007. The emergence of land change science for global environmental change and sustainability. The National Academy of Sciences of the United States of America 104, 20666-20671.
[9] Conway, T. M., and Lathrop, R. G. (2005), Modeling the ecological consequences of land-use policies in an urbanizing region. Environmental Management, 35(3), 278–291
[10] Lambin, E., 1997, Modeling and monitoring land-cover change processes in tropical regions. Progr. Phys. Geogr. 21, 375–393.
[11] Irwin, E. G., and Geoghegan, J. (2001). Theory, data, methods: developing spatially explicit economic models of land use change. Agriculture, Ecosystems and Environment, 85, 7–23.
[14] Verburg, P. H., Ritsema van Eck, J., de Nijs, T., Schot, P., and Dijst, M. (2004), Determinants of land-use change patterns in the Netherlands, Environment and Planning B, 31, 125–150.
[15] Dewan, A.M., and Yamaguchi, Y, 2008, Using remote sensing and GIS to detect and monitor land use and land cover change in Dhaka Metropolitan of Bangladesh during 1960–2005. Environ. Monit. Assess. Doi:10.1007/s10661-008-0226-5.
[16] Tayyebi, A., Pijanowski, C., and Pekin, B., 2011,”Two rule-based urban growth boundary models applied to the Tehran
Metropolitan Area, Iran”,Applied Geography 31, 908-918
[17] Xie, Y.C.; Fang, C.L.; Lin, C.S., Gong, H.M., and Qiao, B., 2007, Spatio-temporal patterns of land use changes and urban development in globalization China: a study of Beijing. Sensors, 7, 2881–2907.
[18] Aguilera, F., Valenzuela, L, M., and Botequilha-Leitão, A., 2011, "Landscape metrics in the analysis of urban land use patterns: A case study in a Spanish metropolitan area". Landscape and Urban Planning 99, 226–238
[19] Hana, J., Hayashia, Y., Caob, X., and Imuraa, H., 2009, "Application of an integrated system dynamics and cellular automata model for urban growth assessment: A case study of Shanghai, China". Landscape and Urban Planning 91, 133–141
[20] Rojas, C., Pino, J., Basnou, C., and Vivanco, M., 2013, "Assessing land-use and -cover changes in relation to geographic factors and urban planning in the metropolitan area of Concepción (Chile). Implications for biodiversity conservation". Applied Geography 39, 93-103
[21] Ying Long, Y., Han, H., Lai, S., and Mao, Q., 2013, "Urban growth boundaries of the Beijing Metropolitan Area: Comparison of simulation and artwork". Cities 31, 337–348
[22] Long, H.L.; Tang, G.P.; Li, X.B., and Heilig, G.K., 2007, Socio-economic driving forces of land-use change in Kunshan, the Yangtze River Delta Economic Area of China. J. Environ. Manage. , 83, 351–364.
[23] Long, H.L., Wu, X.Q., Wang, W.J., and Dong G.H., 2008, Analysis of urban-rural land-use change during 1995-2006 and its policy dimensional driving forces in Chongqing, China. Sensors 8, 681–699.
[24] Jat, M.K., Garg, P.K., and Khare, D., 2008, Monitoring and modeling of urban sprawl using remote sensing and GIS techniques. Int. J. Appl. Earth Obs. Geoinf. 10, 26–43.
[25] Thapa, R. B., and Murayama, Y, 2009, “Examining
spatiotemporal urbanization patterns in Kathmandu Valley,
Nepal: Remote Sensing and Spatial Metrics Approaches”.
Remote Sens. 1, 534-556; doi:10.3390/rs1030534
[26] Fung, T., 1990, An assessment of TM imagery for land-cover change detection. IEEE Trans. Geosci. Rem. Sen. 28, 681-684
[27] Li, X., A, and G, Yeh., 2004, Analyzing spatial restructuring of land use patterns in a fast growing region using remote sensing and GIS, Landscape and Urban Planning 69, 335–354
[28] Harries, P. M., and Ventura, S. J., The integration of geographic data with remotely sensed imagery to improve classification in an urban area. Photogrammertric Engineering and Remote Sensing1995, 61, 381-385.
[29] Li, X., and Yeh, A.G.O., Analyzing spatial restructuring of land use patterns in a fast growing region using remote sensing and GIS. Landscape Urban Plan. 2004, 69, 335-354.
[30] Pijanowski, B.C., Brown, D.G., Shellito, B.A., and Manik, G.A., 2002, Using neural networks and GIS to forecast land use changes: a land transformation model. Comput. Environ. Urban 26 (6), 553–575
[31] Jang, J.S.R., 1993, ANFIS: adaptive-network-based fuzzy inference system: IEEE Tran. on Sys., Man and Cybernetics, 23(3): 665-685
[32] Pontius Jr., R.G., Boersma, W., Castella, J.C., Clarke, K., de Nijs, T., Dietzel, C., Zengqiang, D., Fotsing, E., Goldstein, N., Kok, K., Koomen, E., Lippitt, C.D., McConnell, W., Pijanowski, B., Pithadia, S., Sood, A.M., Sweeney, S., Trung, T.N., Veldkamp, and A.T., Verburg, P.H., 2008, Comparing the input, output, and validation maps for several models of land change. Annals of Regional Science, 42: 11 – 47.
[33] Pontius Jr., R. G., and Schneider, L. C., 2001, Land-cover change model validation by an ROC method for the Ipswich watershed, Massachusetts, USA. Agriculture, Ecosystems &
Environment, 85(1-3), 239-248