A Metabolic Study of Huntington
’
s Disease
Rajasree Nambron1☯, Edina Silajdžić2☯, Eirini Kalliolia1, Chris Ottolenghi3,
Peter Hindmarsh4, Nathan R. Hill5, Seán J. Costelloe6, Nicholas G. Martin6, Vincenzo Positano7, Hilary C. Watt8, Chris Frost9, Maria Björkqvist2, Thomas T. Warner1,10
*
1Department of Clinical Neurosciences, UCL Institute of Neurology, London, United Kingdom,2Brain Disease Biomarker Unit, Department of Experimental Medical Science, Wallenberg Neuroscience Centre, Lund University, Lund, Sweden,3APHP, Department of Metabolic Biochemistry, Necker Hospital, Paris, France,4Developmental Endocrinology Research Group, UCL Institute of Child Health, London, United Kingdom,5Nuffield Department of Primary Care Health Sciences, University of Oxford, Oxford, United Kingdom,6Department of Clinical Biochemistry, Royal Free London NHS Foundation Trust, London, United Kingdom,7Fondazione CNR-Regione Toscana G. Monasterio, Pisa, Italy,8Department of Public Health and Primary Care, Imperial College, London, United Kingdom,9Department of Medical Statistics, London School of Hygiene and Tropical Medicine, London, United Kingdom,10 Reta Lila Weston Institute of Neurological Studies, UCL Institute of Neurology, London, United Kingdom
☯These authors contributed equally to this work.
*t.warner@ucl.ac.uk
Abstract
Background
Huntington’s disease patients have a number of peripheral manifestations suggestive of metabolic and endocrine abnormalities. We, therefore, investigated a number of metabolic factors in a 24-hour study of Huntington’s disease gene carriers (premanifest and moderate stage II/III) and controls.
Methods
Control (n = 15), premanifest (n = 14) and stage II/III (n = 13) participants were studied with blood sampling over a 24-hour period. A battery of clinical tests including neurological rating and function scales were performed. Visceral and subcutaneous adipose distribution was measured using magnetic resonance imaging. We quantified fasting baseline concentra-tions of glucose, insulin, cholesterol, triglycerides, lipoprotein (a), fatty acids, amino acids, lactate and osteokines. Leptin and ghrelin were quantified in fasting samples and after a standardised meal. We assessed glucose, insulin, growth hormone and cortisol concentra-tions during a prolonged oral glucose tolerance test.
Results
We found no highly significant differences in carbohydrate, protein or lipid metabolism mark-ers between healthy controls, premanifest and stage II/III Huntington’s disease subjects. For some markers (osteoprotegerin, tyrosine, lysine, phenylalanine and arginine) there is a suggestion (p values between 0.02 and 0.05) that levels are higher in patients with
OPEN ACCESS
Citation:Nambron R, SilajdžićE, Kalliolia E, Ottolenghi C, Hindmarsh P, Hill NR, et al. (2016) A Metabolic Study of Huntington’s Disease. PLoS ONE 11(1): e0146480. doi:10.1371/journal.pone.0146480
Editor:Juergen Eckel, GDC, GERMANY
Received:April 30, 2015
Accepted:December 17, 2015
Published:January 8, 2016
Copyright:© 2016 Nambron et al. This is an open access article distributed under the terms of the
Creative Commons Attribution License, which permits unrestricted use, distribution, and reproduction in any medium, provided the original author and source are credited..
Data Availability Statement:All relevant data are within the paper and its Supporting Information files.
Funding:The study was funded by a contract from Cure Huntington's Disease Initiative # A-2377. Scientific advisors from CHDI contributed to study design.
premanifest HD, but not moderate HD. However, given the large number of statistical tests performed interpretation of these findings must be cautious.
Conclusions
Contrary to previous studies that showed altered levels of metabolic markers in patients with Huntington’s disease, our study did not demonstrate convincing evidence of abnormali-ties in any of the markers examined. Our analyses were restricted to Huntington’s disease patients not taking neuroleptics, anti-depressants or other medication affecting metabolic pathways. Even with the modest sample sizes studied, the lack of highly significant results, despite many being tested, suggests that the majority of these markers do not differ markedly by disease status.
Introduction
Huntington’s disease (HD) is a devastating hereditary neurodegenerative disorder character-ised by progressive motor, cognitive and psychiatric impairment [1]. In recent years it has become clear that HD can be regarded as a systemic disorder affecting many organs and tissues causing peripheral as well as brain pathology [2]. Both animal and human studies indicate that some of the peripheral symptoms of HD, including weight loss and alterations in appetite, could be linked to endocrine and metabolic alterations [3,4]. These alterations may be reflected in plasma levels of carbohydrate, lipid or protein metabolites and/or hormones related to energy metabolism.
Carbohydrate metabolism
Studies of carbohydrate metabolism in patients with HD have generated ambiguous and con-flicting results. Metabolic profiling of serum samples has shown significant changes in various monosaccharide levels, particularly glucose, between HD gene carriers and controls [5] and studies have shown impaired glucose tolerance and increased prevalence of diabetes in HD patients [6–8]. Insulin sensitivity studies in HD patients have shown both a decrease in insulin sensitivity and impaired insulin secretion capacity in normoglycemic subjects [9]. However, other studies in HD patients have reported normal glucose and insulin levels following a glu-cose tolerance test, as well as normal fasting gluglu-cose and insulin [10–15].
Lipid metabolism
HD patients display changes in body fat stores, as indicated by decreased visceral and periph-eral adiposity [15–17]. In addition, altered fatty acid metabolism and changes in various mark-ers of fatty acid breakdown have been reported in HD [5,18]. Dysfunction of the cholesterol biosynthetic pathway has also been shown in HD [19,20] and cholesterol precursors and metabolites have been shown to be reduced in manifest HD patients [21,22]. However, studies measuring total cholesterol concentration in plasma have reported both low [23,24] and nor-mal levels [21] in HD patients compared to healthy controls.
Protein metabolism
Muscle wasting is a common feature of HD [15–17] and abnormalin vivoskeletal muscle
mutation carriers [25–28]. Several studies of amino acid metabolism in patients with HD have found a decrease in the concentrations of neutral amino acids (especially alanine, valine, leu-cine and isoleuleu-cine) in HD plasma [5,14,18,29–34].
Gastric and adipose hormones
Ghrelin, an orexigenic peptide of gastric origin, and leptin, a peptide hormone secreted by adi-pose tissue, are two peripherally produced hormones that exert effects on the hypothalamus in the regulation of body energy homeostasis [35]. Leptin induces weight loss by suppressing food intake and stimulating metabolic rate, whereas ghrelin stimulates appetite and increases adi-posity [36,37]. Studies on leptin in HD patients have reported similar concentrations in HD patients and controls [38,39]. Conversely, it has also been reported that patients with HD have increased ghrelin and decreased leptin concentration in plasma compared with healthy con-trols [14,24,40].
Aim of the study
The aim of this study was to evaluate a number of metabolic variables to assess whether they are linked to disease state in a cross-sectional study of cohorts of HD gene carriers and controls. We studied carbohydrate, lipid and protein metabolites as well as hormones related to energy metabolism in plasma samples from well-characterised cohorts of premanifest and moderate HD subjects and healthy controls.
Materials and Methods
Study participants
The study was approved by the joint UCL/UCLH ethics committee. Patients were eligible for enrollment if they were 18 years of age or older, had completed either a predictive test for pre-manifest subjects, or had a confirmed genotype consistent with HD (CAG repeat40). Patients committed to undergo a 24-hour inpatient stay for the study and a body magnetic res-onance imaging (MRI) scan. Controls were recruited principally from the partners, spouses, or caregivers of the HD group and exclusion criteria were the same as for the HD group.
Subjects were excluded if they had a history of alcohol or drug abuse in the preceding 12 months or if they had received medication in the preceding 6 months that could influence the hypothalamic-pituitary axis, such as corticosteroid treatment, antipsychotic medication includ-ing phenothiazine, or antiemetic drugs. Subjects could not have any pre-existent endocrine dis-eases, such as diabetes, or central nervous system disorder such as head trauma and seizures. Patients with metallic implants (contraindicated for MRI scan), those experiencing recent weigh loss or gain, and night shift workers were also excluded.
Clinical protocol
The clinical protocol was described previously [41]. Study subjects were admitted to a private clinical room and had an intravenous cannula inserted. During the day the subject could walk freely, watch television, but not fall asleep or snack outside scheduled mealtimes. Scheduled meal times were: breakfast at 09.00, standardised test meal at 12:00 and dinner at 18:00. At 22:00 they retired to bed for sleep and lights were turned off. Lights were switched on again at 06:00. Hourly blood samples were taken over the 24-hour period using a long line from 14:00 to 13:00 the following day.
performing a whole body physical and neurological examination. The Unified Huntington’s Disease Rating Scale (UHDRS) was used to quantitatively measure HD signs [42–45]. Cogni-tive function was assessed by Stroop Test Evaluation Colour Naming (STECN), Stroop Test Evaluation Word Reading (STEWR), Stroop Test Evaluation Interference (STEI), Symbol Digit Test (SDT) and Verbal Fluency Test (VFT). Problem Behaviours Assessments were also performed.
Biometric data were obtained including body mass index (BMI), scapular fat thickness (SFT), waist-to-hip ratio (WHR) and circumference of the abdomen (CA). In addition, partici-pants underwent a T1-weighted abdominal MRI scan in order to assess the visceral and subcu-taneous adipose tissue using Hippofat software [46]. Visceral and subcutaneous adipose deposition was measured because, despite weight loss, enhanced accumulation of body fat in mid-life has been found in several HD mouse models [47–49].
Collection and processing of human samples
Whole blood samples for lactate and plasma samples for glucose analysis were analysed on the day of collection: prior to analysis, lactate samples were kept on ice while glucose samples were kept at room temperature. Blood samples for insulin analysis were collected on ice and centri-fuged immediately for 5 minutes at 2500 revolutions per minute (RPM) at 4°C, the serum col-lected, immediately placed on dry ice, and stored at -80°C until analysis. Blood samples for cortisol, growth hormone, leptin, ghrelin, total cholesterol, high-density lipoprotein (HDL)-cholesterol, low-density lipoprotein (LDL)-cholesterol and triglyceride analysis were allowed to clot at room temperature for 30 minutes, then centrifuged and stored as above. Blood sam-ples for analysis of fatty acids, amino acids,β-hydroxybutyrate, lipoprotein (a), apolipoproteins and osteokines were immediately placed on ice, and centrifuged within 5 minutes of sampling, at 4°C at 2500 RPM for 5 minutes. Plasma was collected, immediately placed on dry ice and stored at -80°C until analysis. Leptin and ghrelin levels were assessed on two occasions: at 06:00 and 13:00, one hour after a standardised, 550 kcal meal comprising 30% lipids, 50% car-bohydrates and 20% proteins [50,51].
A 3-hour Oral Glucose Tolerance Test (GTT) was performed from 06:00 to 09:00 with blood samples taken just prior to and at 30 minutes intervals after ingestion of an oral glucose load of 75 grams. These samples were used for glucose, insulin, cortisol and growth hormone analysis. The homeostasis model assessment of beta-cell function and insulin resistance (iHOMA2) was used in default mode to calculate insulin secretion and sensitivity [52]. For each patient, any perturbation in glucose & insulin homeostasis was quantified using the Observed Variability and Lability (OVAL) model [53]. Diabetes was defined as fasting plasma glucose>7 mmol/L and/or 2 hour sample>11.2. Impaired glucose tolerance was defined as
fasting plasma glucose<7 mmol/L and 2 hour sample between 7.8 and 11.1 mmol/L and
impaired fasting glycaemia as fasting blood glucose between 6.1 mmol/L and 6.9 mmol/L and 2 hour sample<7.8 mmol/L.
Sample analysis
serum active ghrelin was measured by radioimmunoassay (Millipore, Billerica, MA, USA). The plasma amino acid profile was determined by reversed-phase partition high performance liquid chromatography (HPLC) and by ion exchange chromatography as previously described [14]. Osteokines and the bone-specific isoform of alkaline phosphatase were quantified using the Human Bone Panel I and II assays as per the manufacturer’s protocol (Meso Scale Discovery, Rockville, MD, US). Apolipoproteins and lipoprotein (a) were measured by immunonephelo-metry on a Siemens BN2 analyser. Total cholesterol, HDL and triglycerides were measured using enzymatic-spectrophotometric assays on a Roche Modular P Analyser. LDL concentra-tion was calculated from the Total cholesterol, HDL and Triglyceride results using the Friede-wald equation [54]. Serum leptin and ghrelin, and plasma amino acids and osteokines were measured in duplicate and readings averaged. All other variables were single measurements.
Statistical Analysis
Inter-group differences were assessed using linear regression models with group, age and gender as predictor variables. Where residuals were not normally distributed, variables were logarithmi-cally transformed and the analysis repeated. For all regression models joint F-tests were used to compare adjusted group means. A chi-square test was used to compare proportions of subjects with and without impaired glucose tolerance. The significance level was set at p<0.05. Statistical
analyses were performed using SPSS for Windows (release 16.0, SPSS, Inc., Chicago, IL) and using Stata (StataCorp Stata Statistical Software: Release 13. College Station, TX: StataCorp LP).
Results
Fifteen control subjects, 14 premanifest HD gene carriers, and 13 moderate (stage II/III) HD patients were enrolled into the study. Study participant characteristics are summarised inTable 1.
Carbohydrate metabolism
Glucose tolerance test. We performed a glucose tolerance test with blood sampling every
30 minutes over 3 hours and quantified glucose, insulin, cortisol and GH in these samples. No significant difference between control, premanifest and stage II/III HD subjects was found in baseline glucose, insulin, GH and cortisol concentrations, nor during the glucose tolerance test
(Fig 1).Fig 1A and 1Bsuggests there may be a blunted insulin and GH response in stage II/III
HD compared to healthy controls but this did not reach statistical significance. We used a chi-square test to compare proportions of subjects with and without impaired glucose tolerance. The proportion of subjects with glucose intolerance did not differ between controls, premani-fest HD and stage II/III HD subjects (χ2 = 0.039, P = 0.981).
Table 2shows the mean and SD of homeostatic model assessment (HOMA)-S and
HOMA-βwhich are measures of insulin secretion and beta cell function respectively, as well as OVAL, a measure of fasting glucose-insulin homeostasis, in controls, premanifest and stage II/III HD patients. After adjustment for age and gender there was no significant difference in HOMA-S, HOMA-βor OVAL between the three groups. Higher HOMA-S and OVAL homeostasis was observed in premanifest HD subjects compared to control and stage II/III HD subjects and higher HOMA-βwas observed in stage II/III HD compared to controls and premanifest HD subjects, however none reached statistical significance (Table 2).
Bone turnover markers
and gender we did not observe a significant difference in bone formation markers bone alkaline phosphatase, oesteocalcin and osteonectin, nor in the inhibitor of bone formation, sclerostin, between control and HD subjects (Table 2). Between group differences in the bone resorption marker osteoprotegerin were statistically significant (p = 0.0497), but given the borderline nature of the p-value, the number of statistical tests performed (and corresponding increased risk of false positive findings), and the fact that the statistical significance was driven by adjusted levels in the pre-manifest being higher than those in the other two groups which were similar to one another, we are inclined to regard this as a chance finding.
Lipid metabolism
In the current study we measured levels of total cholesterol (TC), low-density lipoprotein (LDL), high-density lipoprotein (HDL), triglycerides (TGS), apolipoprotein A1 (ApoA1), apo-lipoprotein B (ApoB), apo-lipoprotein (a), fatty acids and B-hydroxybutyrate (or sodium
3-hydroxybutyrate). There was no significant difference in concentrations of any of the above variables between the three groups after adjustment for age and gender (Table 2).
T1 weighted abdominal MRI was used to quantitate visceral and subcutaneous adipose tis-sue using Hippofat software that automatically quantifies adipose tistis-sue areas without user inputs [46,56]. Adipose tissue characterisation in the three groups was similar (Table 1).
Protein metabolism
Amino acids. We investigated fasting levels of amino acids, including branched chain
amino acids (BCAAs, i.e. valine, leucine and isoleucine) in plasma samples using reversed-phase HPLC. After adjustment for age and gender statistically significant between group Table 1. Demographic and clinical characteristics of control and HD subjects.
Stage Controls Premanifest HD Stage II/III HD
Number of subjects 15 14 13
Mean age (range) 52 (29–69) 45 (31–58) 55 (42–70)
Female:Male 6:9 9:5 5:8
Mean CAG (range) - 42 (40–47) 44 (42–47)
Mean burden score (range) - 301 (207–434) 435 (273–702)
Mean UHDRS Total Functional Capacity - 13 (12–13) 8 (5–12)
Mean UHDRS Motor ScoreMean - 2 (0–11) 38 (10–65)
BMI±SD 26.0±4.3 28.9±4.7 25.7±3.5
Mean scapular fat thickness±SD (mm) 15.5±7.2 22.2±6.3** 17.5±7.3*
Mean waist to hip ratio±SD 0.87±0.09 0.89±0.08** 0.88±0.06*
Mean abdominal circumference±SD (cm) 92.1±14.3 102.2±14.0*** 94.4±11.0**
Subcutaneous adipose tissue±SD (cm2) 158.4±53.7
* 265.3±148.4**** 176.7±87.0
Visceral adipose tissue±SD (cm2) 118.5±92.8** 95.5±59.7**** 117.5±56.9
Total fat±SD (cm2) 281.8±115.7
** 360.8±154.9**** 294.2±112.8
Body area±SD (cm2) 605.6±197.5
* 690.8±156.0**** 620.2±115.7
VAT/SAT ratio±SD (cm2) (%) 79.6±77.3
** 51.2±57.8**** 77.5±54.6
SAT % 44.2±7.0** 50.5±13.8**** 46.3±12.6
*One missing value
**Two missing values
***Three missing values
****Four missing values.
Fig 1. Mean blood glucose levels at different time points during a glucose tolerance test in controls, premanifest and moderate HD patients and the corresponding mean insulin (A), growth hormone (B) and cortisol (C) concentrations.
differences were found in phenylalanine, lysine and arginine concentrations (all three p-values between 0.02 and 0.05), although finding three such results is consistent with random chance given the number of variables investigated. In addition, in each case the statistical significance is driven by the fact that adjusted mean levels in the premanifest group were markedly higher than those in the stage II/III group and the controls, with mean levels in these two groups being similar, suggesting that this is not a biologically plausible finding. We did not find any significant between group differences in any of the other amino acids analysed (Table 3). We also quantified amino acid concentration using ion exchange chromatography as previously described [14]. After adjustment for age and gender only one variable (Tyrosine) differed sig-nificantly between groups, the result being only just statistically significant (p = 0.04) and again with adjusted levels highest in the premanifest group (Table 3).
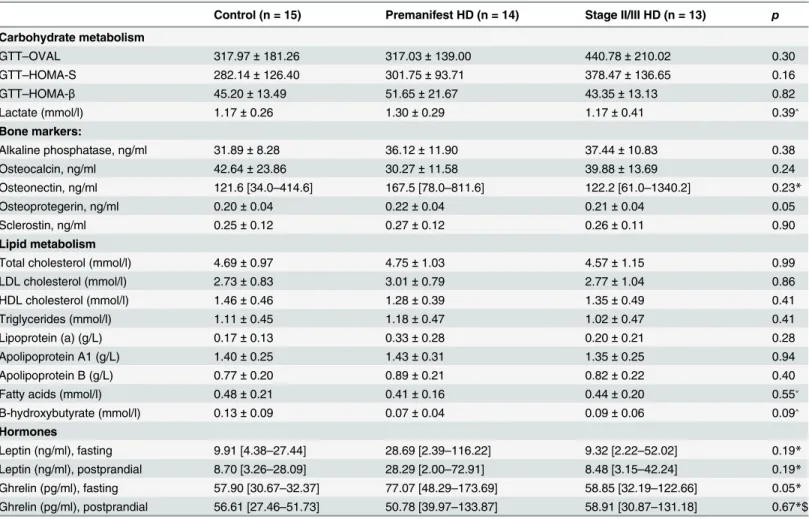
Table 2. Fasting levels of metabolic markers in control, premanifest and stage II/III HD cohorts.Data are presented as Mean±SD for normally distrib-uted data and as median [minimum—maximum] for skewed data.
Control (n = 15) Premanifest HD (n = 14) Stage II/III HD (n = 13) p
Carbohydrate metabolism
GTT–OVAL 317.97±181.26 317.03±139.00 440.78±210.02 0.30
GTT–HOMA-S 282.14±126.40 301.75±93.71 378.47±136.65 0.16
GTT–HOMA-β 45.20±13.49 51.65±21.67 43.35±13.13 0.82
Lactate (mmol/l) 1.17±0.26 1.30±0.29 1.17±0.41 0.39˄
Bone markers:
Alkaline phosphatase, ng/ml 31.89±8.28 36.12±11.90 37.44±10.83 0.38
Osteocalcin, ng/ml 42.64±23.86 30.27±11.58 39.88±13.69 0.24
Osteonectin, ng/ml 121.6 [34.0–414.6] 167.5 [78.0–811.6] 122.2 [61.0–1340.2] 0.23*
Osteoprotegerin, ng/ml 0.20±0.04 0.22±0.04 0.21±0.04 0.05
Sclerostin, ng/ml 0.25±0.12 0.27±0.12 0.26±0.11 0.90
Lipid metabolism
Total cholesterol (mmol/l) 4.69±0.97 4.75±1.03 4.57±1.15 0.99
LDL cholesterol (mmol/l) 2.73±0.83 3.01±0.79 2.77±1.04 0.86
HDL cholesterol (mmol/l) 1.46±0.46 1.28±0.39 1.35±0.49 0.41
Triglycerides (mmol/l) 1.11±0.45 1.18±0.47 1.02±0.47 0.41
Lipoprotein (a) (g/L) 0.17±0.13 0.33±0.28 0.20±0.21 0.28
Apolipoprotein A1 (g/L) 1.40±0.25 1.43±0.31 1.35±0.25 0.94
Apolipoprotein B (g/L) 0.77±0.20 0.89±0.21 0.82±0.22 0.40
Fatty acids (mmol/l) 0.48±0.21 0.41±0.16 0.44±0.20 0.55˅
B-hydroxybutyrate (mmol/l) 0.13±0.09 0.07±0.04 0.09±0.06 0.09˄
Hormones
Leptin (ng/ml), fasting 9.91 [4.38–27.44] 28.69 [2.39–116.22] 9.32 [2.22–52.02] 0.19*
Leptin (ng/ml), postprandial 8.70 [3.26–28.09] 28.29 [2.00–72.91] 8.48 [3.15–42.24] 0.19*
Ghrelin (pg/ml), fasting 57.90 [30.67–32.37] 77.07 [48.29–173.69] 58.85 [32.19–122.66] 0.05*
Ghrelin (pg/ml), postprandial 56.61 [27.46–51.73] 50.78 [39.97–133.87] 58.91 [30.87–131.18] 0.67*$
Unless otherwise indicated p-values are from linear regression models, comparing group means after adjustment for gender and age.
*p-value from linear regression of log transformed values, comparing group means after adjustment for gender and age. ˄Control (n = 13); Premanifest HD (n = 13); Stage II/III HD (n = 12)
˅Control (n = 14); Premanifest HD (n = 14); Stage II/III HD (n = 12) $Control (n = 14); Premanifest HD (n = 14); Stage II/III HD (n = 13)
Gastric and adipose hormones
We investigated fasting and postprandial serum levels of leptin and ghrelin. Fasting (06:00) ghrelin levels were higher in premanifest HD patients, but not in stage II/III HD patients, a borderline significant result (p = 0.051 for comparison between 3 groups, adjusted for age and gender). As with the amino acid data, this finding is unlikely have a biological underpinning and is consistent with chance. There was no significant difference in fasting (06:00) or post-prandial (13:00) leptin or in postpost-prandial (13:00) ghrelin levels between controls, premanifest and stage II/III HD subjects (Table 2).
Discussion
Peripheral manifestations of Huntington’s disease such as weight loss and muscle wasting are thought to be linked to altered metabolism [2]. In this study we investigated metabolic alter-ations through evaluating circulating metabolic factors and functional tests. In contrast to many previous studies, we found little evidence to support alterations in metabolic markers with respect to disease progression. The differences in the findings between our study and Table 3. Protein metabolism.Levels of amino acids (μmol/L) in control, premanifest and stage II/III HD cohorts as determined by ion exchange chromatog-raphy and reversed-phase HPLC. Data are presented as Mean (SD).
Amino acid Ion exchange chromatography Reversed-phase HPLC
Control (n = 12)
Premanifest HD (n = 11)
Stage II/III HD (n = 12)
p Control (n = 14)
Premanifest HD (n = 14)
Stage II/III HD (n = 12)
p
Taurine 137.3 (46.6) 127.9 (41.3) 141.5 (37.7) 0.91 70.3 (27.0) 78.4 (22.2) 65.0 (17.9) 0.16
Aspartic Acid 5.4 (3.2) 5.7 (3.7) 5.6 (1.5) 0.97 4.0 (2.2) 5.2 (2.8) 3.3 (1.2) 0.56
Threonine 144.8 (34.1) 146.7 (31.5) 141.6 (38.8) 0.53 139.4 (35.2) 123.1 (42.1) 134.7 (24.8) 0.59 Serine 127.0 (26.9) 127.8 (27.5) 126.8 (25.5) 0.99 118.7 (27.3) 125.7 (34.2) 115.0 (20.0) 0.68 Asparagine 62.8 (11.6) 64.1 (19.7) 59.5 (10.0) 0.57 57.0 (14.0) 57.8 (12.0) 50.0 (6.3) 0.19 Glutamic Acid 58.5 (30.0) 50.9 (19.8) 54.4 (24.8) 0.63 93.1 (81.2) 96.2 (62.4) 79.1 (36.9) 0.27 Glutamine 620.2 (97.4) 580.0 (87.1) 628.1 (71.1) 0.98 622.1 (146.0) 576.0 (86.0) 630.2 (70.2) 0.72 Proline 210.6 (48.3) 189.8 (62.8) 191.8 (63.3) 0.50 168.9 (54.7) 164.4 (37.7) 154.1 (44.7) 0.27 Glycine 268.8 (115.7) 282.5 (126.2) 275.6 (121.0) 0.99 246.6 (114.7) 245.9 (106.1) 243.7 (85.4) 0.99 Alanine 383.7 (151.0) 464.4 (126.2) 421.5 (100.6) 0.25 326.7 (123.7) 382.7 (55.3) 347.7 (84.9) 0.22 2-aminobutyric
acid
31.5 (10.4) 28.7 (5.3) 30.3 (8.2) 0.63
Citrulline 45.8 (13.2) 47.2 (17.2) 52.7 (17.1) 0.56
Valine 259.9 (52.9) 278.1 (60.3) 260.7 (47.8) 0.06 231.2 (51.4) 241.3 (41.8) 233.8 (36.4) 0.17 Cysteine 109.1 (29.1) 95.7 (19.6) 107.3 (29.7) 0.91
Methionine 24.3 (3.9) 25.5 (4.6) 25.3 (4.8) 0.24 24.4 (7.7) 26.2 (4.7) 24.0 (4.0) 0.19
Isoleucine 77.5 (21.2) 74.3 (18.0) 74.8 (18.0) 0.45 68.2 (20.5) 66.7 (12.5) 64.6 (13.8) 0.28 Leucine 134.8 (30.4) 140.7 (32.1) 139.7 (28.7) 0.11 127.6 (31.4) 134.3 (25.1) 129.2 (26.5) 0.09 Tyrosine 63.9 (15.8) 72.4 (11.3) 70.4 (8.9) 0.04 55.9 (16.4) 63.4 (12.1) 60.6 (9.4) 0.14 Phenylalanine 56.8 (10.0) 61.5 (5.9) 62.3 (10.7) 0.07 54.7 (11.0) 61.4 (7.0) 57.9 (8.4) 0.02 Ornithine 63.6 (13.7) 59.9 (20.0) 71.5 (23.7) 0.69 52.5 (13.9) 52.9 (16.6) 60.8 (15.0) 0.43 Histidine 76.9 (10.6) 78.5 (7.8) 82.3 (9.6) 0.47 83.4 (16.2) 90.6 (9.8) 84.8 (10.4) 0.25 Lysine 178.1 (34.8) 188.3 (36.8) 191.3 (31.6) 0.41 184.7 (40.8) 209.4 (29.1) 186.8 (33.1) 0.02 Arginine 85.9 (16.3) 93.1 (18.7) 98.1 (21.0) 0.14 87.3 (14.9) 106.8 (28.1) 96.8 (11.3) 0.05
Tryptophan 55.5 (12.6) 60.7 (9.6) 52.7 (9.2) 0.20
P-values are from linear regression models, comparing group means after adjustment for gender and age.
previously published reports could be due to several reasons including cohort differences, sam-ple handling and storage and differences in methodology. For instance, in our cohort we excluded patients on medication that could affect the hypothalamic-pituitary axis, and those who had experienced recent weight changes, which may have excluded some of the most severely affected HD patients. We also studied patients in a standardised way to control for exercise, diet and sleep.
Glucose metabolism
Several studies suggest a high prevalence of glucose intolerance and diabetes mellitus in patients with HD [7,8,16,17]. In addition, HD mouse models display pancreatic islet cell atro-phy and intranuclear inclusions [57,58]. Insulin sensitivity studies in HD patients show both a decrease in insulin sensitivity and impaired insulin secretion capacity in normoglycemic sub-jects [9]. Conversely, other studies in HD patients reported normal glucose and insulin levels following a glucose tolerance test, as well as normal fasting glucose and insulin [10–15]. Failure of GH suppression after glucose load [59], as well as an early GH and cortisol rise after an insu-lin tolerance test have been reported in HD [12,60]. Adrenal cortical hypertrophy and
increased cortisol levels were found in R6/2 mice and it was suggested that this resulted in reduced bone mineral density, skeletal muscle atrophy and insulin resistance [47].
In our study there was no significant difference in the insulin, growth hormone curve or cortisol secretion throughout the oral glucose tolerance test. There was no increased incidence of altered glucose homeostasis in patients with moderate and premanifest HD. The fact that patients with diagnosed diabetes were excluded in our study would not explain this lack of dif-ference in glucose tolerance in patients without overt diabetes.
Peripheral hormones: Leptin and Ghrelin
White adipose tissue, a peripheral endocrine organ, releases adipokines such as leptin and has a key role in energy metabolism and weight regulation. Leptin controls satiety, energy expendi-ture and neuroendocrine function through hypothalamic pathways [61,62]. Leptin affects lipid metabolism, stimulates fatty acid oxidation and inhibits hepatic triglyceride accumulation [36].
Ghrelin is a gut peptide and is a natural ligand to growth hormone secretagogue receptor [34]. Produced by cells in the oxyntic glands of the stomach, it exerts a counter regulatory effect on leptin and it increases adiposity as it normally stimulates food intake and inhibits energy expenditure [36].
these negative results, MRI of abdominal fat tissue did not show significantly altered adipose tissue depots in human subjects, in contrast to data from HD mouse studies [57]. Again, it might be that a larger subject cohort is needed, as the MRI data suggest that there might be a tendency towards altered proportion of subcutaneous versus in visceral fat in premanifest HD.
Lipids
Lipids are vital to the health of the central nervous system, and research has revealed lipid dys-regulation in HD [65]. This dysregulation has been linked to specific actions of mutant hun-tingtin on sterol regulatory element binding proteins, resulting in lower cholesterol levels in affected areas of the brain with evidence that this depletion is pathologic [66]. Studies on lipid metabolism have reported altered cholesterol and fatty acid metabolism in HD [66]. A meta-bolic study has demonstrated increases in various markers of fatty acid breakdown, including glycerol and malonate in HD gene carriers compared to controls [5]. High fasting concentra-tions of non-esterified fatty acids in HD patients have also been reported [18]. Dysfunction of the cholesterol biosynthetic pathway has been shown in peripheral fibroblasts and neurons of manifest HD patients [19,20] and cholesterol precursors lanosterol and lathosterol, brain-derived cholesterol metabolite 24S-hydroxycholesterol, and bile acid precursor 27-hydroxy-cholesterol, were found to be significantly reduced in manifest HD patients [21,22]. In our study, we did not observe difference in fasting serum cholesterol levels, however, we did not quantify levels of cholesterol metabolites.
Proteins
Muscle wasting is a feature of manifest and pre-symptomatic HD. It is thought that the muscle wasting may be partly a result of impaired mitochondrial function and a local biochemical defect in HD muscles [67]. Amino acids are the building block of muscle and alterations in neutral amino acid metabolism in HD patients have been implicated for many years [18,31]. The most consistent finding appears to be correlation between branched chain amino acid lev-els (particularly alanine, valine, leucine, isoleucine), weight loss, disease progression and abnor-mal triplet repeat expansion [5,14,18,29–34]. In addition, considerable systemic alterations in the kinetics of the kynurenine pathway (a major route accounting for the metabolism of over 90% of the non-protein tryptophan in most tissues) have been reported in patients with HD [68]. Free plasma tryptophan levels were markedly reduced in HD subjects [18]. It was sug-gested that this represents dysregulation of energy expenditure and altered mitochondrial elec-tron transport activity [5]. However, in our study there was no support for amino acid
alteration in HD. Significant findings were found by HPLC for phenylalanine, lysine and argi-nine, but these would be consistent which chance based on the number of analyses performed in the study. The same is true for the tyrosine result using ion exchange chromatography and is supported by the fact that this result is different from the HPLC data. One difference between our study population and the population previously analysed [14] is that neither our premani-fest individuals nor our HD patients had a lower BMI compared to controls. Instead, the BMI of HD gene carriers were higher, particularly in premanifest individuals.
Bone turnover markers
protein, was shown to regulate glucose metabolism in mice [72]. Reduced bone mineral density has been suggested to be an early feature of HD [73], suggesting that HD patients exhibit porosis, probably as a direct effect of illness, due to the effect of mutant huntingtin on osteo-clasts or osteoblasts in bone tissue or from immobility due to the disease. Bone turnover markers like osteocalcin, osteopontin and osteoprotegerin were measured in fasted state and compared to controls, pre-manifest and manifest HD patients. We did not show convincing evidence of abnormalities in the bone turnover markers measured, which is in keeping with findings we reported in a different cohort [74]. These data suggest that bone turnover markers are not useful as markers of bone turnover disturbances in HD.
Limitations of this study
This study compared controls with premanifest and moderate HD patients in a standardised sampling period of 24 hours. Patients on neuroleptic and other medications, which are known to affect metabolic pathways, were excluded from this study, a design factor not included in many previous cohort studies. However, this does mean that patients who may have been more severely affected were excluded. Whilst we were unable to closely match premanifest and con-trol group gender and age, we believe this is unlikely to alter our findings. Also, the premanifest subjects included in the study had a higher BMI compared to controls. It is possible that, because of high BMI, some of the metabolic dysregulation or compensatory mechanisms that take place due to the huntingtin mutation may be hidden. However, this would not explain lack of confirmation of metabolic changes in our stage II/III HD cohort. Another limitation of the study was the relatively small size of cohorts (13–15 subjects in each). This restricted the power to identify small to moderate effect sizes in variables. However, the careful controlling of medication, feeding and timing of sampling in this study meant that the groups were more eas-ily comparable.
Conclusion
We performed an extensive study focusing on metabolic factors including lipid and bone markers, glucose homeostasis, peripheral hormones affecting energy homeostasis and amino acids and their association with Huntington’s disease. In contrast to many previous studies, our results are consistent with no material differences between HD subjects and control, with just five statistically significant results (osteoprotegerin, tyrosine, phenylalanine, lysine and arginine levels), which are most likely to represent chance findings. The predominantly nega-tive results suggest that the majority of these markers probably do not differ markedly by HD disease status, however a larger sample size is needed for more definitive evidence of smaller effects.
Supporting Information
S1 Table. Data set for demographic data inTable 1.
(XLS)
S2 Table. Data set for metabolic data inTable 2.
(XLS)
S3 Table. Data set for amino acids by ion exchange chromatography.
(XLS)
S4 Table. Data set for amino acids by HPLC.
Acknowledgments
We thank all the subjects in this study for their participation.
Author Contributions
Conceived and designed the experiments: TTW NH CF PH MB. Performed the experiments: TTW EK CO ES RN SC NM. Analyzed the data: TTW EK ES RN CO SC NM VP NH CF HW PH MB. Contributed reagents/materials/analysis tools: ES SC NM NH CF HW PH CO VP. Wrote the paper: TTW EK ES RN SC NM CO VP NH CF HW PH MB.
References
1. Novak MJ, Tabrizi SJ. Huntington's disease. BMJ. 2010; 340:c3109. doi:10.1136/bmj.c3109PMID:
20591965
2. van der Burg JM, Bjorkqvist M, Brundin P. Beyond the brain: widespread pathology in Huntington's dis-ease. Lancet Neurol. 2009; 8(8):765–74. doi:10.1016/S1474-4422(09)70178-4PMID:19608102 3. Aziz NA, Swaab DF, Pijl H, Roos RA. Hypothalamic dysfunction and neuroendocrine and metabolic
alterations in Huntington's disease: clinical consequences and therapeutic implications. Rev Neurosci. 2007; 18(3–4):223–51. PMID:18019608
4. Petersen A, Bjorkqvist M. Hypothalamic-endocrine aspects in Huntington's disease. Eur J Neurosci. 2006; 24(4):961–7. PMID:16925587
5. Underwood BR, Broadhurst D, Dunn WB, Ellis DI, Michell AW, Vacher C, et al. Huntington disease patients and transgenic mice have similar pro-catabolic serum metabolite profiles. Brain. 2006; 129(Pt 4):877–86. PMID:16464959
6. Farrer LA. Diabetes mellitus in Huntington disease. Clin Genet. 1985; 27(1):62–7. PMID:3156696 7. Podolsky S, Leopold NA. Abnormal glucose tolerance and arginine tolerance tests in Huntington's
dis-ease. Gerontology. 1977; 23(1):55–63. PMID:136379
8. Podolsky S, Leopold NA, Sax DS. Increased frequency of diabetes mellitus in patients with Hunting-ton's chorea. Lancet. 1972; 1(7765):1356–8. PMID:4113563
9. Lalic NM, Maric J, Svetel M, Jotic A, Stefanova E, Lalic K, et al. Glucose homeostasis in Huntington dis-ease: abnormalities in insulin sensitivity and early-phase insulin secretion. Arch Neurol. 2008; 65 (4):476–80. doi:10.1001/archneur.65.4.476PMID:18413469
10. Boesgaard TW, Nielsen TT, Josefsen K, Hansen T, Jorgensen T, Pedersen O, et al. Huntington's dis-ease does not appear to incrdis-ease the risk of diabetes mellitus. J Neuroendocrinol. 2009; 21(9):770–6. doi:10.1111/j.1365-2826.2009.01898.xPMID:19602103
11. Davidson MB, Green S, Menkes JH. Normal glucose, insulin, and growth hormone responses to oral glucose in Huntington's disease. Journal of Laboratory and Clinical Medicine. 1974; 84:807–12. 12. Keogh HJ, Johnson RH, Nanda RN, Sulaiman WR. Altered growth hormone release in Huntington's
chorea. J Neurol Neurosurg Psychiatry. 1976; 39(3):244–8. PMID:132511
13. Kremer HP, Roos RA, Frolich M, Radder JK, Nieuwenhuijzen Kruseman AC, Van der Velde A, et al. Endocrine functions in Huntington's disease. A two-and-a-half years follow-up study. J Neurol Sci. 1989; 90(3):335–44. PMID:2525607
14. Mochel F, Charles P, Seguin F, Barritault J, Coussieu C, Perin L, et al. Early energy deficit in Huntington disease: identification of a plasma biomarker traceable during disease progression. PLoS One. 2007; 2 (7):e647. PMID:17653274
15. Trejo A, Tarrats RM, Alonso ME, Boll MC, Ochoa A, Velasquez L. Assessment of the nutrition status of patients with Huntington's disease. Nutrition. 2004; 20(2):192–6. PMID:14962685
16. Farrer LA, Meaney FJ. An anthropometric assessment of Huntington's disease patients and families. Am J Phys Anthropol. 1985; 67(3):185–94. PMID:2932916
17. Farrer LA, Yu PL. Anthropometric discrimination among affected, at-risk, and not-at-risk individuals in families with Huntington disease. Am J Med Genet. 1985; 21(2):307–16. PMID:3160237
18. Phillipson OT, Bird ED. Plasma glucose, non-esterified fatty acids and amino acids in Huntington's cho-rea. Clin Sci Mol Med. 1977; 52(3):311–8. PMID:139225
20. Valenza M, Rigamonti D, Goffredo D, Zuccato C, Fenu S, Jamot L, et al. Dysfunction of the cholesterol biosynthetic pathway in Huntington's disease. J Neurosci. 2005; 25(43):9932–9. PMID:16251441 21. Leoni V, Mariotti C, Tabrizi SJ, Valenza M, Wild EJ, Henley SM, et al. Plasma 24S-hydroxycholesterol
and caudate MRI in pre-manifest and early Huntington's disease. Brain. 2008; 131(Pt 11):2851–9. doi:
10.1093/brain/awn212PMID:18772220
22. Leoni V, Mariotti C, Nanetti L, Salvatore E, Squitieri F, Bentivoglio AR, et al. Whole body cholesterol metabolism is impaired in Huntington's disease. Neurosci Lett. 2011; 494(3):245–9. doi:10.1016/j. neulet.2011.03.025PMID:21406216
23. Markianos M, Panas M, Kalfakis N, Vassilopoulos D. Low plasma total cholesterol in patients with Hun-tington's disease and first-degree relatives. Mol Genet Metab. 2008; 93(3):341–6. PMID:18006350 24. Wang R, Ross CA, Cai H, Cong WN, Daimon CM, Carlson OD, et al. Metabolic and hormonal
signa-tures in pre-manifest and manifest Huntington's disease patients. Frontiers in physiology. 2014; 5:231. doi:10.3389/fphys.2014.00231PMID:25002850
25. Koroshetz WJ, Jenkins BG, Rosen BR, Beal MF. Energy metabolism defects in Huntington's disease and effects of coenzyme Q10. Ann Neurol. 1997; 41(2):160–5. PMID:9029064
26. Lodi R, Schapira AH, Manners D, Styles P, Wood NW, Taylor DJ, et al. Abnormal in vivo skeletal mus-cle energy metabolism in Huntington's disease and dentatorubropallidoluysian atrophy. Ann Neurol. 2000; 48(1):72–6. PMID:10894218
27. Saft C, Zange J, Andrich J, Muller K, Lindenberg K, Landwehrmeyer B, et al. Mitochondrial impairment in patients and asymptomatic mutation carriers of Huntington's disease. Mov Disord. 2005; 20(6):674– 9. PMID:15704211
28. Mochel F, Duteil S, Marelli C, Jauffret C, Barles A, Holm J, et al. Dietary anaplerotic therapy improves peripheral tissue energy metabolism in patients with Huntington's disease. European journal of human genetics: EJHG. 2010; 18(9):1057–60. doi:10.1038/ejhg.2010.72PMID:20512158
29. Ottosson JO, Rapp W. Serum levels of phenylalanine and tyrosine in Huntington's chorea. Acta Psy-chiatr Scand Suppl. 1971; 221:89–1. PMID:4255685
30. Ottosson JO, Rapp W. Amino acids in Huntington's chorea. Barbeau A, Chase TN, Paulson GW, edi-tors. New York: Raven Press; 1973.
31. Perry TL, Diamond S, Hansen S, Stedman D. Plasma-aminoacid levels in Huntington's chorea. Lancet. 1969; 1(7599):806–8. PMID:4180363
32. Perry TL, Hansen S, Lesk D, Kloster M. Amino acids in plasma, cerebrospinal fluid, and brain of patients with Huntington's chorea. Barbeau A, Chase TN, Paulson GW, editors. New York: Raven Press; 1973.
33. Reilmann R, Rolf LH, Lange HW. Decreased plasma alanine and isoleucine in Huntington's disease. Acta Neurol Scand. 1995; 91(3):222–4. PMID:7793240
34. Yates CM, Magill BE, Davidson D, Murray LG, Wilson H, Pullar IA. Lysosomal enzymes, amino acids and acid metabolites of amines in Huntington's chorea. Clin Chim Acta. 1973; 44(1):139–45. PMID:
4267642
35. Wynne K, Stanley S, McGowan B, Bloom S. Appetite control. J Endocrinol. 2005; 184(2):291–318. PMID:15684339
36. Klok MD, Jakobsdottir S, Drent ML. The role of leptin and ghrelin in the regulation of food intake and body weight in humans: a review. Obes Rev. 2007; 8(1):21–34. PMID:17212793
37. Nogueiras R, Tschop MH, Zigman JM. Central nervous system regulation of energy metabolism: ghre-lin versus leptin. Ann N Y Acad Sci. 2008; 1126:14–9. doi:10.1196/annals.1433.054PMID:18448790 38. Pratley RE, Salbe AD, Ravussin E, Caviness JN. Higher sedentary energy expenditure in patients with
Huntington's disease. Ann Neurol. 2000; 47(1):64–70. PMID:10632102
39. Gaba AM, Zhang K, Marder K, Moskowitz CB, Werner P, Boozer CN. Energy balance in early-stage Huntington disease. Am J Clin Nutr. 2005; 81(6):1335–41. PMID:15941884
40. Popovic V, Svetel M, Djurovic M, Petrovic S, Doknic M, Pekic S, et al. Circulating and cerebrospinal fluid ghrelin and leptin: potential role in altered body weight in Huntington's disease. Eur J Endocrinol. 2004; 151(4):451–5. PMID:15476444
41. Kalliolia E, Silajdzic E, Nambron R, Hill NR, Doshi A, Frost C, et al. Plasma melatonin is reduced in Hun-tington's disease. Mov Disord. 2014; 29(12):1511–5. doi:10.1002/mds.26003PMID:25164424 42. Huntington Study Group. Unified Huntington's Disease Rating Scale: reliability and consistency.
Hun-tington Study Group. Mov Disord. 1996; 11(2):136–42. PMID:8684382
44. Siesling S, van Vugt JP, Zwinderman KA, Kieburtz K, Roos RA. Unified Huntington's disease rating scale: a follow up. Mov Disord. 1998; 13(6):915–9. PMID:9827615
45. Huntington Study Group. Unified Huntington's Disease Rating Scale-99. Rochester, NY1999. 46. Positano V, Gastaldelli A, Sironi AM, Santarelli MF, Lombardi M, Landini L. An accurate and robust
method for unsupervised assessment of abdominal fat by MRI. J Magn Reson Imaging. 2004; 20 (4):684–9. PMID:15390229
47. Bjorkqvist M, Petersen A, Bacos K, Isaacs J, Norlen P, Gil J, et al. Progressive alterations in the hypo-thalamic-pituitary-adrenal axis in the R6/2 transgenic mouse model of Huntington's disease. Hum Mol Genet. 2006; 15(10):1713–21. PMID:16613897
48. Fain JN, Del Mar NA, Meade CA, Reiner A, Goldowitz D. Abnormalities in the functioning of adipocytes from R6/2 mice that are transgenic for the Huntington's disease mutation. Hum Mol Genet. 2001; 10 (2):145–52. PMID:11152662
49. Phan J, Hickey MA, Zhang P, Chesselet MF, Reue K. Adipose tissue dysfunction tracks disease pro-gression in two Huntington's disease mouse models. Hum Mol Genet. 2009; 18(6):1006–16. doi:10. 1093/hmg/ddn428PMID:19124532
50. Aziz NA, Pijl H, Frolich M, Schroder-van der Elst JP, van der Bent C, Roelfsema F, et al. Growth hor-mone and ghrelin secretion are associated with clinical severity in Huntington's disease. Eur J Neurol. 2010; 17(2):280–8. doi:10.1111/j.1468-1331.2009.02798.xPMID:19845749
51. Aziz NA, Pijl H, Frolich M, van der Graaf AW, Roelfsema F, Roos RA. Leptin secretion rate increases with higher CAG repeat number in Huntington's disease patients. Clin Endocrinol (Oxf). 2010; 73 (2):206–11.
52. Hill NR, Levy JC, Matthews DR. Expansion of the homeostasis model assessment of beta-cell function and insulin resistance to enable clinical trial outcome modeling through the interactive adjustment of physiology and treatment effects: iHOMA2. Diabetes Care. 2013; 36(8):2324–30. doi: 10.2337/dc12-0607PMID:23564921
53. Hill NR, Tsapas A, Hindmarsh P, Matthews DR. Methodology for quantifying fasting glucose homeosta-sis in type 2 diabetes: observed variability and lability. J Diabetes Sci Technol. 2013; 7(3):640–5. PMID:23759396
54. Friedewald WT, Levy RI, Fredrickson DS. Estimation of the concentration of low-density lipoprotein cholesterol in plasma, without use of the preparative ultracentrifuge. Clinical chemistry. 1972; 18 (6):499–502. PMID:4337382
55. Naylor K, Eastell R. Bone turnover markers: use in osteoporosis. Nat Rev Rheumatol. 2012; 8(7):379– 89. doi:10.1038/nrrheum.2012.86PMID:22664836
56. Demerath EW, Ritter KJ, Couch WA, Rogers NL, Moreno GM, Choh A, et al. Validity of a new auto-mated software program for visceral adipose tissue estimation. Int J Obes (Lond). 2007; 31(2):285–91. 57. Bjorkqvist M, Fex M, Renstrom E, Wierup N, Petersen A, Gil J, et al. The R6/2 transgenic mouse model
of Huntington's disease develops diabetes due to deficient beta-cell mass and exocytosis. Hum Mol Genet. 2005; 14(5):565–74. PMID:15649949
58. Hunt MJ, Morton AJ. Atypical diabetes associated with inclusion formation in the R6/2 mouse model of Huntington's disease is not improved by treatment with hypoglycaemic agents. Exp Brain Res. 2005; 166(2):220–9. PMID:16034568
59. Podolsky S, Leopold NA. Growth hormone abnormalities in Huntington's chorea: effect of L-dopa administration. J Clin Endocrinol Metab. 1974; 39(1):36–9. PMID:4276011
60. Lavin PJ, Bone I, Sheridan P. Studies of hypothalamic function in Huntington's chorea. J Neurol Neuro-surg Psychiatry. 1981; 44(5):414–8. PMID:6455503
61. Badman MK, Flier JS. The gut and energy balance: visceral allies in the obesity wars. Science. 2005; 307(5717):1909–14. PMID:15790843
62. Flier JS. Obesity wars: molecular progress confronts an expanding epidemic. Cell. 2004; 116(2):337– 50. PMID:14744442
63. Goodman AO, Murgatroyd PR, Medina-Gomez G, Wood NI, Finer N, Vidal-Puig AJ, et al. The meta-bolic profile of early Huntington's disease—a combined human and transgenic mouse study. Exp Neu-rol. 2008; 210(2):691–8. doi:10.1016/j.expneurol.2007.12.026PMID:18284928
64. Djousse L, Knowlton B, Cupples LA, Marder K, Shoulson I, Myers RH. Weight loss in early stage of Huntington's disease. Neurology. 2002; 59(9):1325–30. PMID:12427878
66. Block RC, Dorsey ER, Beck CA, Brenna JT, Shoulson I. Altered cholesterol and fatty acid metabolism in Huntington disease. J Clin Lipidol. 2010; 4(1):17–23. doi:10.1016/j.jacl.2009.11.003PMID:
20802793
67. Ribchester RR, Thomson D, Wood NI, Hinks T, Gillingwater TH, Wishart TM, et al. Progressive abnor-malities in skeletal muscle and neuromuscular junctions of transgenic mice expressing the Huntington's disease mutation. Eur J Neurosci. 2004; 20(11):3092–114. PMID:15579164
68. Stoy N, Mackay GM, Forrest CM, Christofides J, Egerton M, Stone TW, et al. Tryptophan metabolism and oxidative stress in patients with Huntington's disease. J Neurochem. 2005; 93(3):611–23. PMID:
15836620
69. Schoppet M, Preissner KT, Hofbauer LC. RANK ligand and osteoprotegerin: paracrine regulators of bone metabolism and vascular function. Arterioscler Thromb Vasc Biol. 2002; 22(4):549–53. PMID:
11950689
70. Choi ST, Kim JH, Kang EJ, Lee SW, Park MC, Park YB, et al. Osteopontin might be involved in bone remodelling rather than in inflammation in ankylosing spondylitis. Rheumatology (Oxford). 2008; 47 (12):1775–9.
71. DiGirolamo DJ, Clemens TL, Kousteni S. The skeleton as an endocrine organ. Nat Rev Rheumatol. 2012; 8(11):674–83. doi:10.1038/nrrheum.2012.157PMID:23045255
72. Clemens TL, Karsenty G. The osteoblast: an insulin target cell controlling glucose homeostasis. J Bone Miner Res. 2011; 26(4):677–80. doi:10.1002/jbmr.321PMID:21433069
73. Goodman AO, Barker RA. Body composition in premanifest Huntington's disease reveals lower bone density compared to controls. PLoS Curr. 2011; 3:RRN1214. PMID:21379361