Gene Expression Analysis Provide Insight into the
Biosynthesis of Isoprenoid Precursors in Seeds
Vero´nica Keim1,2, David Manzano1,2, Francisco J. Ferna´ndez3, Marta Closa2, Paola Andrade1,2, Daniel Caudepo´n1,2, Cristina Bortolotti1,2, M. Cristina Vega3, Montserrat Arro´1,2., Albert Ferrer1,2
*. 1Department of Molecular Genetics, Centre for Research in Agricultural Genomics (CRAG) (CSIC-IRTA-UAB-UB), Campus UAB, Bellaterra (Cerdanyola del Valle`s), Barcelona, Spain,2Department of Biochemistry and Molecular Biology, Faculty of Pharmacy, University of Barcelona, Barcelona, Spain,3Department of Structural and Quantitative Biology, Centre for Biological Research (CIB-CSIC), Madrid, Spain
Abstract
Arabidopsis thaliana contains two genes encoding farnesyl diphosphate (FPP) synthase (FPS), the prenyl diphoshate synthase that catalyzes the synthesis of FPP from isopentenyl diphosphate (IPP) and dimethylallyl diphosphate (DMAPP). In this study, we provide evidence that the two Arabidopsis short FPS isozymes FPS1S and FPS2 localize to the cytosol. Both enzymes were expressed inE. coli, purified and biochemically characterized. Despite FPS1S and FPS2 share more than 90% amino acid sequence identity, FPS2 was found to be more efficient as a catalyst, more sensitive to the inhibitory effect of NaCl, and more resistant to thermal inactivation than FPS1S. Homology modelling for FPS1S and FPS2 and analysis of the amino acid differences between the two enzymes revealed an increase in surface polarity and a greater capacity to form surface salt bridges of FPS2 compared to FPS1S. These factors most likely account for the enhanced thermostability of FPS2. Expression analysis ofFPS::GUSgenes in seeds showed thatFPS1andFPS2display complementary patterns of expression particularly at late stages of seed development, which suggests that Arabidopsis seeds have two spatially segregated sources of FPP. Functional complementation studies of the Arabidopsis fps2 knockout mutant seed phenotypes demonstrated that under normal conditions FPS1S and FPS2 are functionally interchangeable. A putative role for FPS2 in maintaining seed germination capacity under adverse environmental conditions is discussed.
Citation:Keim V, Manzano D, Ferna´ndez FJ, Closa M, Andrade P, et al. (2012) Characterization of Arabidopsis FPS Isozymes andFPSGene Expression Analysis Provide Insight into the Biosynthesis of Isoprenoid Precursors in Seeds. PLoS ONE 7(11): e49109. doi:10.1371/journal.pone.0049109
Editor:Joshua L. Heazlewood, Lawrence Berkeley National Laboratory, United States of America
ReceivedJune 5, 2012;AcceptedOctober 7, 2012;PublishedNovember 7, 2012
Copyright:ß2012 Keim et al. This is an open-access article distributed under the terms of the Creative Commons Attribution License, which permits unrestricted use, distribution, and reproduction in any medium, provided the original author and source are credited.
Funding:This work was supported by grants from the Spanish Ministerio de Ciencia e Innovacio´n (cofinanced by the European Regional Development Fund) (BIO2009-06984 and CSD2007-00036 to A.F., and PET2008_0101 and BFU2010-22260-C02-02 to M.C.V.), the Generalitat de Catalunya (SGR-00914 to A.F.), and the European Commission Framework Programme 7 (FP7 Project ComplexINC No. 279039 to M.C.V.) The funders had no role in study design, data collection and analysis, decision to publish, or preparation of the manuscript.
Competing Interests:The authors have declared that no competing interest exist.
* E-mail: albertferrer@ub.edu
.These authors contributed equally to this work.
Introduction
All isoprenoids are derived from the C5 building blocks
isopentenyl diphosphate (IPP) and its isomer dimethylallyl diphosphate (DMAPP). In plants, IPP and DMAPP are synthe-sized via two independent pathways: the mevalonic acid (MVA) pathway in the cytosol [1] and the 2-C-methyl-D-erythritol 4-phosphate (MEP) pathway in the plastids [2]. IPP and DMAPP are subsequently used as substrates by distinct short-chain prenyl diphosphate synthases that catalyze the head-to-tail condensation of one molecule of DMAPP with one, two or three IPP units to produce geranyl diphosphate (GPP; C10), farnesyl diphosphate
(FPP; C15) and geranylgeranyl diphosphate (GGPP; C20),
respec-tively [3], [4]. Pathway specialized branches starting from these prenyl diphosphates lead ultimately to the production of the astonishing number of isoprenoid end products synthesized by plants. GPP serves as a precursor for monoterpenoids, GGPP is a precursor of diterpenoids, gibberellins, carotenoids and abscisic acid, side chains of chlorophyll, phylloquinone, plastoquinone and tocopherols, and geranylgeranylated proteins, and FPP serves as a
precursor for sesquiterpenoids, sterols, brassinosteroids, triterpe-noids, polyprenols, side chains of ubiquinone, and farnesylated proteins [5]. It is generally accepted that the intracellular levels of these prenyl diphosphates and their precursors IPP and DMAPP must be strictly controlled to avoid deleterious effects on the metabolic flux through the pathway branches competing for these intermediates [6]. Indeed, overexpression of FPP synthase (FPS) in Arabidopsis [7], [8], [9] and phytoene synthase in tomato [10] results in altered levels of specialized isoprenoid end products that negatively affect plant performance.
differ only by an N-terminal extension of 41 amino acid residues that targets FPS1L into mitochondria [10], [13] whereas theFPS2 gene encodes FPS2 that shares 90.6% amino acid identity with FPS1 isozymes [12]. Although the intracellular localization of Arabidopsis FPS1S and FPS2 remains to be experimentally established, both isozymes are predicted to localize in the cytosol since they do not bear any obvious subcellular targeting signal [12]. However, the possibility that one or both Arabidopsis short FPS isozymes might reside in a different compartment cannot be excluded. In fact, a Catharanthus roseus short FPS lacking a canonical peroxisomal targeting sequence partially localizes to the peroxisomes of C. roseus cells [21]. This observation would support the hypothesis for a partial localization of the early steps of the plant isoprenoid pathway in peroxisomes [22], [23] as reported to occur in mammals [24].
Studies in transgenic Arabidopsis expressing chimericFPS::GUS genes [25] and analysis of microarray expression data [26] have shown thatFPSgenes are expressed in all organs throughout plant development, albeit at greatly different levels. FPS1 is widely expressed in all tissues throughout plant development whereas expression ofFPS2is mainly concentrated in floral organs, seeds and the early stages of seedling development. Characterization of Arabidopsisfps1and fps2single knockout mutants demonstrated that a single functionalFPSgene is enough to sustain normal plant growth and development, thereby indicating thatFPS1andFPS2 can almost fully complement each other. However, simultaneous knockout of bothFPSgenes is embryo-lethal and severely impairs male genetic transmission [26]. Thus, the small ArabidopsisFPS gene family seemingly constitutes a redundant two-locus genetic network in which as long as one gene functions, no noticeable loss of plant fitness occurs. Nevertheless,FPS1andFPS2functions are not completely redundant. FPS activity measurements and analysis of sterol and ubiquinone levels, the major cytosolic and mitochondrial FPP-derived isoprenoids, have shown that FPS1S has a major role during most of the plant life cycle, whereas FPS2 has a predominant role in seeds and during the early stages of seedling development. In fact, FPS2 is by far the major contributor to total FPS activity in mature seeds, though shortly after germination FPS1 replaces FPS2 as the major provider of FPS activity. Hence, lack of FPS2, but not of FPS1, leads to a marked reduction of sitosterol content in mature seeds concomitant to a positive feedback regulatory response of 3-hydroxy-3-methylglu-taryl coenzyme A reductase (HMGR), the enzyme that catalyzes the main regulatory step in the MVA pathway and downstream isoprenoid pathways [27]. The elevated levels of HMGR activity become essential to sustaining a flux through the isoprenoid pathway that is high enough to produce sufficient sterols and likely other isoprenoids needed for normal seed viability, as revealed by the hypersensitivity of fps2mutant seeds to the HMGR inhibitor mevastatin [26]. Correct quantitative and qualitative sterol compo-sition is essential for proper seed development and viability, not only because sterols have well established roles in maintaining membrane structure and function [28] and as precursors of brassinosteroids [29], but also because they are involved in signalling pathways that are essential for normal embryogenesis [30], [31].
Biochemical characterization of individual FPS isozymes can also greatly contribute to the understanding of their physiological functions. So far, studies on the biochemical properties of plant FPSs have been conducted in a very limited number of species using purified native [32], [33] and recombinant [18], [34] enzyme preparations and, to the best of our knowledge, a comparative biochemical analysis between individual members of FPS isozyme families has only been reported inArtemisia tridentata. This plant contains two FPS isozymes that share 83% of amino
acid identity. In spite of this, FDS-1 and FDS-2 exhibit different functional properties, which led the authors to propose specific cellular functions for each of the two isozymes [18]. In the present study, we report the results of a detailed functional and structural characterization of the two Arabidopsis short FPS isozymes FPS1S and FPS2. We also expand our previous FPS gene expression analysis [25] by establishing the spatial and temporal pattern of expression of theFPSgenes during seed development, and present the results of functional complementation studies of thefps2single knockout mutant phenotypes [26] with chimeric FPS gene constructs. Altogether, findings reported herein provide new clues to understand the biological role of FPS isozymes in Arabidopsis.
Materials and Methods
Chemicals
Unlabelled IPP, DMAPP, GPP and FPP were purchased from Echelon Biosciences and [4-14C]IPP (60 mCi/mmol) was from GE Healthcare Life Sciences. Mevastatin (Calbiochem, www. merck-chemicals. com) was dissolved in EtOH to prepare a 5 mM stock solution.
Plant Material and Growth Conditions
Arabidopsis thalianawild-type (ecotype Col-3 qrt1/qrt1) andfps2 mutant plants were grownin vitroon Murashige and Skoog (MS) medium (Duchefa, http://www.duchefa.com) solidified using 0.8% w/v agar, orin vivoon soil in a climate-controlled growth chamber, under long-day conditions (16 h light/8 h dark) at 22uC. When required, MS medium was supplemented with 1mM mevastatin.
Heterologous Expression of GST-FPS1S and GST-FPS2 in E. coliand Recombinant Protein Purification
Arabidopsis FPS proteins were expressed as N-terminal GST fusion proteins using a modified version of pGEX-3X plasmid (Pharmacia Biotech). The polylinker of pGEX-3X was modified by introducing aNotI restriction site upstream from theBamHI site that allows to obtain native proteins having an N-terminal end without extra residues after cleavage with Factor Xa protease [35]. The cDNAs coding for FPS1S and FPS2 were amplified by PCR using, respectively, the forward primers 59 -ATGGAGACC-GATCTCAAGTCAACC-39 and 59 -ATGGCGGATCT-GAAATCAACC-39, the common reverse primer 59 -CGCGGATCCCTACTTCTGCCTCTTGTAG-39 (translation start and stop codons are shown in bold, andBamHI restriction site is underlined) and plasmids pcNC3 [13] and pcNC2 [12] as templates, respectively. The resulting PCR products were digested with BamHI, phosphorylated with T4 Polynucleotide kinase (Promega) and cloned into theNotI (blunt ended by nuclease S1 treatment) andBamHI restriction sites of the modified pGEX-3X, yielding plasmids FPS1 and pGEX-3X-NotI-FPS2. These expression plasmids were transformed into the E. coli strain BL21 (DE3), harbouring pUBS520 encoding E.coli tRNAArg AGA/AGG [36], and transformed cells were grown overnight on LB plates supplemented with ampicillin (100mg/ mL). Plasmids were isolated from overnight cultures and their sequences were verified. To express the recombinant proteins, 30 mL of LB medium supplemented with ampicillin (100mg/mL) and kanamycin (50mg/mL) was inoculated with 0.5 mL of an overnight culture of BL21 (DE3) cells harbouring either pGEX-3X-NotI-FPS1 or pGEX-3X-NotI-FPS2 and grown at 37uC to an OD600of 0.5–0.6. After induction with 0.4 mM isopropyl thio-b
collected by centrifugation at 7,000g for 5 min at 4uC, resuspended in 3 mL of PBS (80 mM Na2HPO4, 20 mM
NaH2PO4, 100 mM NaCl, pH 7.5) and disrupted by sonication
(0.5 min/mL suspension) while being chilled in a 210uC bath. Cell debris was removed by centrifugation at 15,000gfor 30 min at 4uC, and the resulting supernatant was loaded onto a 1 mL Glutathione-Sepharose 4B affinity chromatography column (GE Healthcare) pre-equilibrated with PBS. All procedures for enzyme purification were performed at 4uC unless otherwise indicated. The column was washed with a minimum volume of 10 mL of PBS and re-equilibrated with Factor Xa cleavage buffer (50 mM Tris-HCl, pH 7.5, 50 mM NaCl, 1 mM CaCl2). GST-FPS fusion
proteins were digested by adding to the column 40U of Factor Xa (Amersham Biosciences) in cleavage buffer to the column. After overnight incubation at 20–22uC the resulting native FPS proteins were eluted with cleavage buffer. Fractions of 250mL were collected and analyzed by 12,5% SDS-PAGE [37] after a quick estimation of protein concentration with a NanoDrop ND-1000 spectrophotometer (Thermo Fisher Scientific Inc.). Fractions enriched in FPS protein were pooled and the remaining Factor Xa protease was removed by treatment with Factor Xa removal resin (Qiagen) according to the manufacturer’s instructions. Glycerol was then added to a final concentration of 15% (v/v) and samples were stored frozen at280uC. The purity of each FPS preparation was checked by SDS-PAGE. Protein concentration was determined by the method of Lowry [38] using BSA as a standard.
FPS Enzyme Activity Assay and Kinetic Studies
FPS activity of purified recombinant FPS isozymes was measured in a total volume of 100mL containing 30 mM PIPES (pH 7.0), 6 mM NaCl, 4 mM MgCl2, 150 mM sucrose, 10mg/
mL aprotinin, 2mg/mL E64, 1mg/mL pepstatin, 0.35 mM PMSF, 0.30 mg/mL bovine serum albumin (BSA), 100mM [4-14C]IPP (6.97mCi/mmol), 100mM GPP and the appropriate amount of enzyme (between 10 and 40 ng). The reaction was initiated by the addition of the substrates after preincubation of the enzyme for 5 min at 37uC. The reaction was carried out at 37uC for 15 min and terminated by the addition of 585ml of 2 M HCl pre-chilled at 0uC. Solid NaCl was added to saturation and the reaction products were acid hydrolysed by incubation for 30 min at 37uC. The mixture was extracted with 1 mL of n-hexane and the radioactivity in 500mL of the hexanic phase was quantified by liquid scintillation counting. To measure FPS activity in extracts from plant tissues, shoots (between 200 and 250 mg) or seeds (between 25 and 40 mg) were mixed with extraction buffer (2mL per mg of seedlings and 20mL per mg of seeds) containing 50 mM PIPES, pH 7.0, 250 mM sucrose, 10 mM NaCl, 5 mM MgCl2,
5 mM DTT, 15mg/mL aprotinin, 3mg/mL E64, 1.5mg/mL pepstatin, and 0.5 mM PMSF pre-chilled at 4uC and ground to a fine powder with mortar and pestle. The slurry was centrifuged at 200gfor 10 min at 4uC to remove cell debris and the resulting supernatant was collected and centrifuged again at 16,000gfor 20 min at 4uC. The supernatant was recovered and FPS activity (between 100 and 200mg of protein) was assayed for 30 min at 37uC as described above. One unit of FPS is defined as the amount of enzyme that incorporates one nanomol of IPP into acid-labile products per minute and mg of protein at 37uC.
For pH dependence analysis, enzyme activity assays were carried out using MES (5.5, 6.0), PIPES (6.5, 7.0) and Tris-HCl (7.5, 8.0, 8.5, 9.0). The apparentKmvalues for the substrates IPP,
DMAPP and GPP were calculated from Lineweaver-Burk plots of FPS activity. The Km values for DMAPP and GPP were
determined with substrate concentrations in the range of 6.25 to 200mM with a fixed IPP concentration of 100mM. TheKmvalue
for IPP was determined with concentrations in the range between 1 to 100mM and a fixed DMAPP concentration of 200mM. A nonlinear regression analysis in Sigma Plot 7.0 was used to calculate the kinetic parameters.
Determination of HMGR Enzyme Activity and Sitosterol Content in Seeds
For HMGR activity measurements, seeds (50 mg) were frozen in liquid nitrogen, ground to a fine powder with mortar and pestle, and mixed with 0.4 mL of pre-chilled extraction buffer (40 mM sodium phosphate, pH 7.5, 100 mM sucrose, 30 mM EDTA, 50 mM NaCl, 10 mM DTT, 10mg/mL aprotinin, 1mg/mL E64, 0.5mg/mL leupeptin, 1mg/mL pepstatin, 0.5 mM PMSF and 0.25% (w/v) Triton X-100). The slurry was centrifuged at 200g for 10 min at 4uC to remove cell debris and HMGR activity was immediately measured in the supernatant as previously described [39]. One unit of HMGR activity is defined as the amount of enzyme that converts one picomol of 3-hydroxy-3-methylglutaryl coenzyme A into MVA per min and mg of protein at 37uC. Sitosterol levels in seeds were analyzed by GC-MS as previously described [26].
Western Blot Analysis
Aliquots (40–50mg of protein) of the same seed extracts used for FPS activity measurements (16,000gsupernatant) were fraction-ated by 10% SDS-PAGE and electrotransferred onto Hybond-P polyvinylidene difluoride membranes (Amersham, Buckingham-shire, UK) at a constant intensity of 125 mA for 3 h at 4uC. The membrane was blocked in PBS pH 7.5, 0.5% (v/v) Tween 20 and 5% (v/v) Blotto non-fat dry milk (Santa Cruz Biotechnology inc.) for 16 h at 4uC, and incubated with rabbit polyclonal anti-FPS1S antibody [8] (1:8000 dilution in blocking solution) for 1 h at room temperature. The membrane was then incubated with goat anti-rabbit IgG conjugated to peroxidase (Amersham) (1:60000 dilution in blocking solution) for 1 h at room temperature. The FPS1S-antibody complex was visualized using the ECL Advance Western blotting system (GE Healthcare) according to the manufacturer’s instructions. Protein loading was assessed by Coomassie blue staining of the membranes.
Differential Scanning Fluorimetry
The difference in thermal stability between FPS1S and FPS2 was analyzed by differential scanning fluorimetry (DSF) [40]. In brief, 20mL reactions were set up on a 96-well thin-wall plate (Bio-Rad) containing 3–14mM each protein in assay buffer (50 mM Tris-HCl, pH 7.5, 50 mM NaCl, 1 mM CaCl2, 15% (v/v)
glycerol and 56Sypro Orange (Invitrogen). Assay buffer was added instead of protein in the control samples. The plates were sealed with optical-quality sealing tape (Bio-Rad) and heated on a iQ5 Real Time (RT)-PCR instrument (Bio-Rad) from 20–80uC in increments of 0.2uC. Fluorescence was monitored with a charge-coupled device (CCD) camera using 490 and 575 nm as emission and excitation wavelengths, respectively. The mid-point temper-ature of the unfolding transition or melting tempertemper-ature (Tm) was
calculated by fitting a Boltzmann model to the fluorescence imaging data after eliminating data beyond the fluorescence intensity maximum.
Homology Modelling
of human FPS and FPS1S was 45% over 99% of its length (339 out of 343 amino acids) and between human FPS and FPS2 was 46% over 99% of its length (338 out of 342 amino acids). The phosphate ion and the four water molecules found in the active site of FPS in this structure were kept to maintain a stable conformation of the active site loops during modelling. First, we threaded the correct FPS1S and FPS2 sequences onto the template structure using Modeller 9.10 [42] and then selected the 10 best models out of 1000 independent models on the basis of the Z-DOPE normalized scores, which ranged from –1.916 to – 1.337 for FPS1S and from –1.949 to –1.529 for FPS2 (a Z-DOPE of less than –1 indicates a plausible model with 80% of the Ca
atoms lying within 3.5 A˚ of their correct positions). Next, the top ten models for each protein were refined and minimized using the Rosetta force field and Monte Carlo sampling methods [43], [44] and the improved models were clustered and analyzed to obtain a final model. The final models for FPS1S and FPS2 showed correct stereochemistry as assessed by MolProbity [45].
In Silico Evaluation of Free Energy and Structure Changes Upon Mutation
Free energy (DDG) and structure changes upon mutation were calculated using two established methods, the Rosetta DDG application [46] and the publicly available CC/PBSA web server (http://ccpbsa.biologie.uni-erlangen.de/ccpbsa/) [47]. The changes in stability predicted by the two independent calculations were analyzed in the context of the predicted structural changes. The Rosetta DDG protocol corresponds to row 16 of a recent benchmarking study [46]. Row 16 protocol first repacks all residues according to Rosetta standard sidechain sampling procedures while keeping the backbone fixed, and then minimizes all backbone and sidechain degrees of freedom. Energies are calculated for 50 wild-type and mutant sequence contexts and the predictedDDG is the difference in the free energy between the mutant and wild-type protein. The CC/PBSA method is accessed via a web interface where the coordinates are submitted along with a string describing the desired mutation. In a nutshell, the CC/ PBSA method generates two random conformational ensembles each one of them consisting of 300 wild-type and mutant minimized structures for which energies are evaluated using a custom energy function. Those energy contributions are scaled to reproduce experimentally measured free energies using five-fold cross validation.
Gene Constructs for Mutant Complementation
To construct plasmid pCAM-FPS2p::FPS1S, a 1388-bp frag-ment including 1329 bp of the FPS2 gene promoter, the 59 untranslated region and the ATG translation start codon, was amplified by PCR using genomic DNA as a template, forward primer 59-GCGTCGACAGCTTGGAGCATAAGAAG-39 and reverse primer 59-TCCGCCATGGATAGGATCAAGG-39. A SalI restriction site was added at the 59 end of forward primer and anNcoI site encompassing the ATG start codon of FPS2 was created in the reverse primer by introducing a G (shown in bold) instead of a C. A 2353-bp fragment including the region encoding FPS1S and 339 bp of the 39-non coding region was amplified by PCR using genomic DNA as a template, forward primer 59 -AGCTCTTCCATGGAGACCGATC-39 and reverse primer 59 -TTGGAGCTCTTTGGAATGGAATGTAGG-39. An NcoI re-striction site encompassing the ATG start codon of FPS1S was created by introducing a C (shown in bold) instead of a G in the forward primer and aSacI restriction site was added at the 59end of reverse primer. Both genomic fragments were cloned into pGEM-T Easy vector (Promega), excised by digestion with either
SalI andNcoI orNcoI andSacI, and cloned into theSalI andSacI sites of pBluescript KS+
in a three-piece ligation yielding pBFPS2p::FPS1S. The entire FPS2p::FPS1S fragment was then excised by digestion with SalI and SacI and cloned into pCAMBIA2300 yielding plasmid pCAM-FPS2p::FPS1S.
To create plasmid pCAM-FPS2p::FPS1S-mutdis, a 1375-bp fragment including 1329 bp of the FPS2 gene promoter was amplified by PCR using genomic DNA as a template, forward primer 59-GCGTCGACAGCTTGGAGCATAAGAAG-39 and reverse primer 59 -CCCAAGCTTGATAGGATCAAG-GAAGGTGT-39. Restriction sites for SalI and HindIII (under-lined) were added at the 59 end of forward and reverse primers, respectively. The amplified fragment was cloned into pGEM-T Easy vector yielding pGEM-FPS2p. A 2472-bp fragment including the entire coding region of theFPS1gene and 339 bp of the 39 -non coding region was amplified by PCR using genomic DNA as a template, forward primer 59 -GGGATATCAGTGT-GAGTTGTTGTTGT-39 and reverse primer 59 -TTGGAGCTCTTTGGAATGGAATGTAGG-39. Restriction sites forEcoRV andSacI (underlined) were added at the 59 end of forward and reverse primers, respectively. In the forward primer the third base of the ATG codon corresponding to the translation start codon of FPS1L isoform was changed to C (shown in bold). The amplified fragment was cloned into theEcoRV and SacI sites of pBluescript SK+yielding pBFPS1S-mutdis. TheFPS1 gene fragment was then excised from pBFPS1S-mutdis with EcoRV and SacI and cloned into plasmid pGEM-FPS2p, which had been previously digested withHindIII, treated with nuclease S1 to produce blunt ends and digested again with SacI (in the pGEM-T polylinker) yielding pGEM-FPS2p::FPS1S-mutdis. The entire FPS2p::FPS1S-mutdis fragment was then excised by digestion with SalI and SacI and cloned into pCAMBIA2300 yielding plasmid pCAM-FPS2p::FPS1S-mutdis.
To construct plasmid pCAM-FPS1p::FPS2, a 1526-bp fragment including 1338 bp of theFPS1gene promoter and 185 bp of the 59leader region up to the ATG translation start codon of FPS1S was amplified by PCR using DNA from genomic clone pgNC241 as a template [12], forward primer 59 -GCGTCGACATAG-TAGTTAATGTTGGGG-39 and reverse primer 59 -TCTCCATGGAAGAGCTTTGGATACG-39. A SalI site was added at the 59 end of forward primer and an NcoI site encompassing the ATG start codon of FPS1S was created by introducing a G (shown in bold) instead of a T in the reverse primer. A 2553-bp fragment including the entire coding region of the FPS2 gene and 438 bp of the 39-non coding region was amplified by PCR using genomic DNA as a template, forward primer 59-GATCCTATCCATGGCGGATCTG-39 and reverse primer 59-AGCGAGCTCATTTCCACTAATCTTCTCG-39. An NcoI restriction site encompassing the ATG start codon of FPS2 was created by introducing a C (shown in bold) instead of an A in the forward primer. ASacI restriction site was added at the 59 end of reverse primer. Both genomic fragments were cloned into pGEM-T Easy vector, excised by digestion with eitherSalI and NcoI orNcoI and SacI, and cloned into theSalI and SacI sites of pBluescript KS+in a three-piece ligation yielding pBFPS1p::FPS2. The entire FPS1p::FPS2 fragment was then excised by digestion withSalI andSacI and cloned into pCAMBIA1300-T-Nos yielding plasmid pCAM-FPS1p::FPS2. Plasmid pCAMBIA1300-T-Nos was generated by introducing the T-Nos sequence from pBI221 into theSacI andEcoRI sites of pCAMBIA1300.
ATC codon by site directed mutagenesis [25] and the same forward and reverse primers used to construct pCAM-FPS1p::FPS2. The amplified fragment was cloned into pGEM-T Easy yielding pGEM-FPS1mutdisp. TheFPS1gene fragment was then excised withSalI andNcoI and cloned into pBFPS1p::FPS2 to replace the corresponding non-mutated region ofFPS1promoter, yielding plasmid pBFPS1mutdisp::FPS2. The entire pBFPS1mut-disp::FPS2 fragment was then excised with SalI and SacI and cloned into pCAMBIA1300-T-Nos yielding plasmid pCAM-FPS1mutdisp::FPS2.
All PCR fragments used to construct plasmids described above were sequenced to exclude amplification artifacts. The correct fusion of the genomic fragments was also confirmed by sequencing.
Plant Transformation and Transgene Expression Analysis
Agrobacterium tumefaciens strain GV3101 harbouring plasmids described above was used to transform Arabidopsisfps2-1mutant plants by the floral dip method [48]. Seeds from infiltrated plants were surface sterilized and sown in Petri dishes containing solid MS medium supplemented with 50mg/mL kanamycin. Antibiot-ic-resistant seedlings (T1) were transplanted into soil and grown to
maturity. Lines homozygous for the transgenes containing a single insertion were selected by segregation analysis of the kanamycin resistance trait.
To analyze the expression of the transgenes introduced into the fps2-1mutant, total RNA was isolated from 12-days-old seedlings form fps2-1 lines harbouring FPS2p::FPS1S, FPS2p::FPS1-mutdis, FPS1p::FPS2, or FPS1mutdisp::FPS2. Total RNA (1,5mg) was treated with DNAse (Ambion) and single-stranded cDNA pools were synthesized using oligo-dT primer and SuperScript III reverse transcriptase (Invitrogen) according to standard protocols. PCR reactions were carried out by 35 cycles of amplification (45 s at 94uC, 60 s at 50uC and 90 s at 72uC with a 5 min final extension at 72uC) using as template 7.5mL of a 1:10 dilution of the corresponding single-stranded cDNA pools and 1 unit of Taq polymerase (Biotools). Primers 59- GGCTTTGCA-CACCTTCCTTG-39 and 59 -CCTGTGGATGTGATTGC-GAAG-39were used for expression analysis ofFPS2p::FPS1Sand FPS2p::FPS1-mutdis genes, and primers 59 -GGTGGGAGTCTC-TATCGTCGTCGTATCCAA-39 and 59 -CGGAGAGGCCC-GAGTATG-39 were used for expression analysis ofFPS1p::FPS2 and FPS1mutdisp::FPS2 genes. The expression of the ACT2 (At3g18780) gene was analyzed using primers 59 -GATCTGG-CATCACACTTTCTAC-39 and 59- GCCTTGGAGATCCA-CATCTGCTG-39. The expression of the PP2AA3 (At1g13320) gene encoding the 65 kDa regulatory subunit of protein phospha-tase 2A (PP2A) was analyzed using primers 59 -TAACGTGGC-CAAAATGATGC-39 and 59 -GAAGCCAACATTAACATTAG-TAGC-39.
GUS Assay inArabidopsisSeeds
Siliques were harvested, opened longitudinally, placed in GUS assay buffer (50 mM phosphate buffer, pH 7.0, 0.2% (v/v) Triton X-100, 20 mM X-Gluc and 2 mM potassium ferricyanide) and subjected to vacuum for 10 min. After incubation for 24 hours at 37uC, siliques were placed in ethanol:acetic acid (1:1) and incubated for either 4 hours (young seeds with embryos at the globular and heart stages) or 8 hours (mature seeds with embryos at torpedo and cotyledon stages). GUS-stained seeds were cleared in Hoyer’s medium for 3–4 days in darkness [49]. Dissected seeds were placed on a slide covered with a coverslip, stored in darkness for 24 hours and observed under a Zeiss Axiophot microscope equipped with Nomarski optics. Photographs were taken using the same microscope equipped with an Olympus DP70 photo camera.
Expression of GFP-FPS1S, GFP-FPS2, FPS1S-GFP and FPS2-GFP in Agroinfiltrated Leaves ofN. benthamiana Plants
The FPS1S coding sequence (1029 bp) was amplified by PCR using forward primer 59 -ACGCGTCGACAATGGAGACC-GATCTCAAGTCAACC-39, reverse primer 59 -CTGTCGA-TATCCCTTCTGCCTCTTGTAGATCTTAGC-39 and plas-mid pcNC3 [13] as a template. The sequence coding for FPS2 (1039 bp) was amplified using forward primer 59 -ACGCGTCGA-CAATGGCGGATCTGAAATCAACCTTC-39, reverse primer 59 -GAGTATGATATCCCTTCTGCCTCTTGTAGATCT-TAGC-39 and plasmid pcNC2 [12] as a template. Translational start codons are shown in bold.SalI andEcoRV restriction sites (underlined) were added at the 59end of the forward and reverse primers, respectively. The amplified fragments were cloned into the corresponding sites of plasmid pENTR3C (GatewayH, Invitrogen) yielding plasmids pENTR-FPS1S and pENTR-FPS2. Both cDNA fragments were subsequently transferred from pENTR-FPS1S and pENTR-FPS2 to pMDC43 and pMDC83 (GatewayH, Invitrogen) yielding plasmids pMDC43FPS1S, pMDC43FPS2, pMDC83FPS1S and pMDC83FPS2, in which the FPS coding sequences were fused in-frame to the 59- or 39-ends of the green fluorescent protein (GFP) coding sequence. In all cases the coding sequences were under the transcriptional control of the CaMV35S gene promoter. All constructs were sequenced to confirm the in-frame fusions. Plasmids coding for the different protein fusions were transformed intoAgrobacterium tumefaciensstrain EHA105. The recombinant A. tumefaciens strains were grown overnight at 28uC in YEB liquid medium supplemented with 100mg/mL rifampicine and 25mg/mL kanamycin. Cells were harvested by centrifugation and resuspended to an OD600of 0.150
in a solution containing 10 mM MgCl2, 10 mM HEPES, pH 5.6,
and 200mM acetosyringone (3,5-dimethoxy-49 -hydroxy-acetophe-none). Prior infiltration, bacterial suspensions were incubated at room temperature for 3 h. For co-expression experiments, suspensions ofA. tumefaciensharbouring the FPS-GFP expression constructs were mixed with A. tumefaciens cultures harbouring constructs for expression of the cyan fluorescent protein (CFP)-peroxisome marker (CFP-SKL) [50] and the tobacco etch polytovirus helper component protein (HC-Pro) silencing suppres-sor [51] in a 1:1:1 ratio. Leaves of 2–4 week oldN. benthamiana plants were infiltrated by gently appresing a 2-ml syringe without a needle to the abaxial surface of fully expanded leaves. Following a 2–3 day incubation of infiltrated plants under long-day conditions at 25uC and 60% humidity, abaxial epidermis of leaf tissue was examined by confocal laser-scanning microscopy using a Leica SP5 microscope (Leica Microsystems). GFP and CFP were excited by using 488 and 458 laser lines, respectively. Images were acquired sequentially to avoid crosstalk between channels. LAS-AF Lite 2.6.0 software was used for image capture and for merging false-coloured images of transiently co-transformed cells.
Results
Biochemical Characterization of Recombinant FPS1S and FPS2 Isozymes
yielded highly purified preparations of both enzymes (Figure 1B) that were used for biochemical characterization.
Prenyltransferases are known to require a divalent metal ion for catalytic activity. Thus, we first analyzed the effect of different Mg2+
concentrations on FPS1S and FPS2 activity. Similar values of activity were obtained when the enzyme activity was measured in the presence of MgCl2concentrations ranging between 1 and
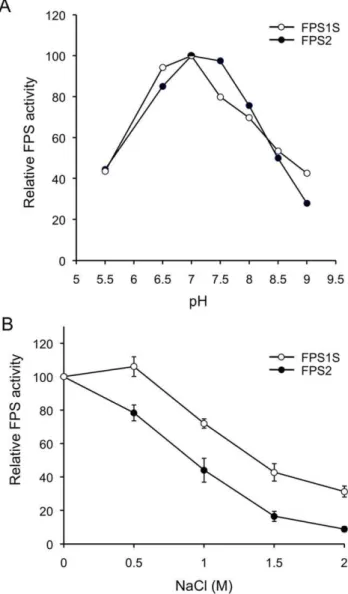
5 mM (data not shown). The optimal pH range for FPS1S and FPS2 was also determined. Both enzymes showed a similar pH-rate profile with only minor differences (Figure 2A). Maximal activity for both enzymes was observed at a pH value of 7.0, albeit the pH-rate profile of FPS1S was slightly shifted toward more acidic pH values compared to FPS2. We next investigated the effect of NaCl on the activity of FPS1S and FPS2 using concentrations in the range from 0 to 2 M. As shown in Figure 2B, the activity of both enzymes progressively declined as the concentration of NaCl increased, though in the case of FPS1S this effect was observed only at NaCl concentrations higher than 0.5 M. At all NaCl concentrations tested, FPS2 was markedly more sensitive to the inhibitory effect of NaCl than FPS1S. Purified FPS1S and FPS2 were also subjected to kinetic analyses and the resulting steady-state kinetic constants are shown in Table 1. Both enzymes displayed typical Michaelis-Menten behaviour, as observed for other FPSs, and exhibited similarKm
values in themmolar range (from 8.3 to 31.5mM) for both IPP and the allylic substrates DMAPP and GPP. The affinity (Km) of FPS1S
and FPS2 for the reaction intermediate GPP was approximately 2.7-fold higher than for DMAPP, thus indicating a preference of both enzymes for the allylic intermediate. Similarly, comparison of the specificity constants (kcat/Km) indicated a 2-fold higher
catalytic efficiency for GPP compared to DMAPP. The inhibitory effect of the reaction product FPP on FPS1S and FPS2 activity was analyzed using concentrations in the range from 0 to 1 mM. The activity inhibition profile was nearly identical for both enzymes, with a maximal 30% reduction of activity at the highest FPP concentration assayed.
Interestingly, FPS2 preparations consistently showed higher specific activity than the FPS1S ones. In fact, FPS2 showed catalytic rate constant (kcat) values for IPP, DMAPP, and GPP that
were 3.2-, 2.7- and 2.7-fold higher, respectively, than FPS1S, thus indicating that FPS2 is a more efficient catalyst than FPS1S. These differences cannot be attributed to differential stability of the enzymes either under storage conditions or during the purification procedure since both retained more than 90% of their initial activity after 2 months of storage at 280uC and their activity remained virtually unaffected after incubation for 1 hour at 37uC (Figure 3A). In contrast to this later observation, we observed a markedly different response of FPS1S and FPS2 to treatment at 45uC for different time-periods. As shown in Figure 3A, FPS2 activity remained unaltered after incubation for 1 hour at 45uC
Figure 1. Expression inE. coliand purification of recombinant FPS1S and FPS2 proteins.(A) Total protein extracts fromE. colicells harbouring either pGEX-3X-NotI-FPS1 or pGEX-3X-NotI-FPS2 before (lanes 1 and 3) and after induction (lanes 2 and 4) of GST-FPS1S and GST-FPS2 expression with 0.4 mM IPTG for 6 hours at 22uC. (B) Soluble protein extracts of IPTG-inducedE. colicells harbouring either pGEX-3X-NotI-FPS1 (lane 1) or pGEX-3X-NotI-FPS2 (lane 2), and purified native FPS1S (lane 3) and FPS2 (lane 4) protein preparations after Glutathione-Sepharose 4B affinity column chromatography, proteolytic digestion with Factor Xa and protease removal. Arrows indicate the position of GST-FPS protein fusions and purified native FPS proteins. Molecular masses of standards (M) are indicated in kDa.
doi:10.1371/journal.pone.0049109.g001
Figure 2. Effect of pH and NaCl on FPS1S and FPS2 enzyme activity.(A) FPS activity of purified FPS1S and FPS2 was determined at pH values ranging from 5.5 to 9.0 as described under Materials and Methods. Enzyme activities are expressed relative to the maximal activity values for FPS1S and FPS2. (B) Effect of NaCl on FPS1S and FPS2 enzyme activity. FPS activity of purified FPS1S and FPS2 was determined at the indicated NaCl concentrations. Enzyme activities are expressed relative to the activity values for FPS1S and FPS2 measured without NaCl. The mean values and SE were calculated from three independent experiments.
whereas FPS1S activity was completely abolished after 20 minutes at the same temperature. A similar result was obtained when protein extracts from the Arabidopsis fps1-1 and fps2-1 single knockout mutants bearing only one functionalFPSgene (FPS2and FPS1 respectively) were incubated at 45uC for different time-periods and assayed for FPS activity. Again, incubation at 45uC had almost no effect on FPS2-derived activity in extracts from fps1-1 plants, whereas FPS1-derived activity in extracts from fps2-1 plants was severely diminished upon incubation at the same temperature (Figure 3B). These differences in thermal stability were corroborated by differential scanning fluorimetry (DSF) [40]. The melting temperature (Tm) derived from the DSF data is a
useful diagnostic tool because greater thermal stability is associated with a positive shift inTm with respect to a referenceT0 (Tm–
T0= DTm.0) and vice versa. DSF experiments with 3–14mM
FPS1S or FPS2 in FPS activity assay buffer yieldedTmvalues of
37uC and 48.3uC, respectively, a difference in Tm of 11.3uC
(Figure 3C). Based on these results, it can be concluded that FPS2 is more resistant to thermal inactivation than FPS1S because FPS2 protein is thermodynamically more stable than FPS1S.
Structural Basis of the Enhanced Thermal Stability of FPS2
To further our understanding of the differential thermal stability between FPS1S and FPS2, homology models for both proteins were built using as a template the crystal structure of unliganded human FPS (PDB 2F7M) [41] (Figure 4A) and carefully assessed with respect to their stereochemistry. Best models for both enzymes showed correct stereochemical parameters and native dimer interfaces using various stringent criteria [45], [52]. The root-mean-square (r.m.s.) deviation between each model and the template structure was 0.26 A˚ and between the two models was 0.29 A˚ . Mapping of the sequence substitutions between FPS1S and FPS2 onto their respective ribbon structures and molecular surfaces (Figure 4B) showed that the immense majority of these substitutions occur at the outer surface of the enzyme.
Detailed analysis of the thirty-two substitutions that separate FPS2 from FPS1S revealed that the increase in surface polarity and the greater capacity to form surface salt bridges of FPS2 compared with FPS1S appear to be determining factors of the enhanced thermostability of FPS2. Indeed, there are several discernable trends in amino acid substitution between FPS2 and
FPS1S that lends support to this hypothesis. First, FPS2 has four charged residues more than FPS1S of which three are basic and one is acidic. Secondly, polar and charged sidechains in FPS2 tend to be longer on average than in FPS1S (e.g., substitutions follow Asp =.Glu, Asn =.Gln), which could afford greater rotameric freedom and thereby facilitate formation of polar interactions on the protein’s surface. In summary, inspecting the FPS1S and FPS2 homology models around each mutated residue suggested that as Table 1.Steady-state kinetic constants for FPS1S and FPS2.
Variable
substrate Kinetic parameter FPS1S FPS2
IPP Km(mM) 23.160.4 31.360.5 kcat(min21) 62.5 269.0 kcat/Km(min21mM21) 2.7 8.6 DMAPP Km(mM) 22.762.1 31.560.5
kcat(min21) 52.2 197.3 kcat/Km(min21mM21) 2.3 6.2
GPP Km(mM) 8.361.2 11.361.0
kcat(min21) 36.4 132.8 kcat/Km(min21mM21) 4.4 11.7 TheKmmean values and SE were calculated from three independent experiments.
kcatvalues were calculated for the dimeric form of the enzyme. doi:10.1371/journal.pone.0049109.t001
Figure 3. Thermal stability of FPS1S and FPS2 enzyme activity.
(A) Activity of purified FPS1S (open symbols) and FPS2 (closed symbols) was measured after incubation at either 37uC (squares) or 45uC (circles) for the indicated time periods. (B) FPS activity in 16,000g protein extracts from fps1-1 (FPS2 activity, closed circles) and fps2-1 (FPS1 activity, open circles) mutants was determined after incubation at 45uC for the indicated times. In both cases enzyme activities are expressed relative to the FPS activity values at time 0 min and the mean values and SE were calculated from three independent experiments. (C) Differential scanning fluorimetry (DSF) results plotted as change in fluorescence emission intensity (normalized to unity at its maximum) with increasing temperature (20–80uC). The FPS1S and FPS2 curves correspond to 6mM enzyme.
many as three additional salt bridges (and several strong hydrogen bonds) could be established in FPS2 compared to FPS1S. Other metrics of structure stability, such as sidechain hydrogen bonds (31 in all/4 strong versus 30 in all/2 strong) and salt bridges across the dimer interface (7 versus 5) interface did also favour FPS2 with respect to FPS1S. Interestingly, a number of aromatic-aromatic, aromatic-sulfur and pi-cation interactions seem to be more prevalent in FPS2 than in FPS1S, and could also make a sizable contribution to the overall thermal stability of the two enzymes.
To accurately calculate the changes in free energy and structure induced by single residue substitutions we applied the Rosetta DDG [46] and CC/PBSA [47] methods to predict the free energy and structure changes underwent by FPS1S as single FPS2-mimicking substitutions are introduced. Results indicated that the cumulative free energy change summed over all mutated residues was energetically very favourable regardless of the method used, in qualitative agreement with the results from DSF experiments.
Moreover, the RosettaDDG and CC/PBSA protocols flag 58% (15 versus 11) and 69% (9 versus 4) of the non-neutral substitutions as stabilizing (DDG , –1 kcal/mol). Of the non-stabilizing mutations, RosettaDDG brands more mutations than CC/PBSA as destabilizing (DDG.+1 kcal/mol) than neutral (DDG between –1 and+1 kcal/mol). Figure 4C shows this pattern for both the RosettaDDG and the CC/PBSA protocols. Of the 21 out of 32 substitutions that change any residue in FPS1S to a polar/charged residue in FPS2, 85% (18) are predicted as non-destabilizing (the three exceptions are Q70K, E170D and D283E) thereby providing corroborative evidence for the important role of surface electrostatic interactions for FPS2 thermal stability. Perhaps one of the larger discrepancies between the two prediction methods involves substitutions F58Y, N65Q, Q70K and V72T, for which DDG estimates are reversed. These four substitutions, which are located in three consecutive helices, cluster tightly together around a 6-A˚ sphere and therefore it is plausible that the true structure of
FPS2 had undergone compensatory changes that cannot be accurately captured by our single-site mutation calculations. Future structural studies of FPS1S and FPS2 should provide more accurate rationales for the observed stability differences.
Subcellular Localization of FPS1S and FPS2
Arabidopsis FPS1S and FPS2 isoforms have long been considered to localize in the cytosol, mainly because no obvious organellar targeting signals have been detected in their primary structure. To provide experimental data supporting this assump-tion, the subcellular localization of Arabidopsis FPS1S and FPS2 was investigated by transiently expressing N- and C-terminal fusions of both FPS isoforms to the GFP in agroinfiltrated N. benthamianaleaf cells (Figure 5). Confocal laser microscopy analysis of the transfected cells revealed that all four tested proteins (GFP-FPS1S, FPS1S-GFP, GFP-FPS2, and FPS2-GFP) showed a diffuse pattern of fluorescence throughout the cytosol that was completely different from the punctuate fluorescence pattern characteristic for peroxisomal proteins, as revealed by comparison with the fluorescence signal of the peroxisomal marker CFP-SKL. These results strongly suggested that both FPS1S and FPS2 localize in the cytosol and not in the peroxisomes.
Expression Pattern of ArabidopsisFPS1andFPS2Genes during Seed Development
Characterization of Arabidopsis fps single knockout mutants revealed a differential contribution of FPS isoforms to total FPS activity in mature seeds [26]. In order to investigate whether this effect could be due to differential expression ofFPS1andFPS2in seed tissues, we analyzed the spatial and temporal pattern of expression of GUS activity in seeds at different developmental stages harvested from Arabidopsis lines harbouring FPS1S::GUS andFPS2::GUStransgenes (Figure 6). These chimeric gene fusions included approximately 1350 bp of the corresponding FPS promoter region [25]. InFPS1S::GUSplants, the primary site of GUS activity detection at all stages of development was the maternal chalazal seed coat (Figure 6A–E). At the globular, heart and early-torpedo stages of embryo development some variable and weaker GUS staining could also be detected in surrounding tissues (Figure 6A–C) although it is difficult to establish whether this expression reflected diffusion of the substrate or true expression of the transgene. At latter stages of embryo develop-ment GUS activity was restricted to the chalazal seed coat (Figure 6D and E). Interestingly, no expression of GUS activity in the embryo could be detected at any developmental stage. The pattern of GUS expression driven by the FPS2 promoter was completely different (Figure 6F–J). At the globular stage of embryo development GUS staining was detected only in the chalazal endosperm (Figure 6F), but from the heart stage onward GUS activity could also be detected in the embryo (Figure 6G–J). At the heart and early torpedo stage GUS expression in the embryo was primarily localized to the root apical meristem region (Figure 6G and H, arrowhead) and the pro-vascular tissue of embryo (Figure 6, inset). Up to this developmental stage, a very faint staining could also be detected in the endosperm of some seeds when they were subjected to intensive staining. At later developmental stages GUS activity was clearly detected in the whole embryo as well as in the surrounding endosperm (Figure 6I). In mature seeds, strong GUS activity was also present in the cotyledonary embryo (Figure 6J), which is in sharp contrast to the absence of GUS activity in the embryo of mature seeds expressing FPS1S::GUS (Figure 6E). In conclusion, analysis of FPS1S::GUS and FPS2::GUS expression analysis demonstrated thatFPSgenes are differentially regulated during Arabidopsis seed development, showing highly
comple-mentary expression patterns particularly at late stages of seed formation.
Functional Complementation offps2Mutant Seed Phenotypes by FPS1S
Mature seeds lacking FPS2 activity display several phenotypes including reduced levels of sitosterol, the main sterol found in plant tissues, increased HMGR activity and hypersensitivity to mevas-tatin compared to both fps1 and wild-type seeds [26]. To determine whether FPS1S could complement these phenotypes, transgenicfps2-1plants expressing FPS1S under the control of the FPS2gene promoter were obtained. To this end we created two different gene constructs that were able to produce only isoform FPS1S (Figure 7A and B). TheFPS2p::FPS1S-mutdisgene consisted of 1375 bp of theFPS259-flanking region, including 1329 bp of the promoter and the entire 59-untranslated region, fused to the genomic coding region of FPS1 in which the distal ATG start codon was converted into an ATC codon to ensure that only FPS1S isoform could be produced. The FPS2p::FPS1S gene differed from FPS2p::FPS1S-mutdis gene in that the region comprised between the two ATG codons was removed.
Several independent lines of these two kinds of transgenic plants were obtained and characterized. Among them, lines 6.2, 7.2 and 10.2 for FPS2p::FPS1S-mutdis and lines 2.2, 7.1 and 8.1 for FPS2p::FPS1S were selected for further characterization. The expression ofFPS2p::FPS1S-mutdisandFPS2p::FPS1Swas analyzed in young seedlings using semiquantitative RT-PCR and a primer set consisting of a forward primer specific for the FPS2 59 -untranslated sequence and a reverse primer located in theFPS1 coding region. The three selected FPS2p::FPS1S-mutdis lines showed very similar levels of expression of the FPS1 mRNA that were even higher than those detected in wild-type plants (Figure 8A). Accordingly, protein extracts from seeds of FPS2p::FPS1S-mutdis lines also contained both higher levels of FPS1S protein, as demonstrated by Western blot analysis (Figure 8B), and higher values of FPS activity (Figure 9C) compared to wild-type seeds. On the contrary, FPS protein and enzyme activity levels in extracts from seeds of the three FPS2p::FPS1S transgenic lines were comparable to those found in extracts offps2-1mutant seeds, which indeed were much lower that those detected in wild-type seed extracts (Figure 8B and C). The inability ofFPS2p::FPS1S to restore wild-type levels of FPS protein and enzyme activity was not due to a lack of expression of the transgene, since its mRNA was detected in the seedlings of the three selected lines. In two of them (lines 7.1 and 8.1), expression of the transgene was less intense than in wild-type plants whereas in the third one (line 2.2) expression was slightly stronger than in control plants (Figure 8A). These observations suggested that translation of the chimeric FPS2::FPS1S mRNA expressed by FPS2p::FPS1Swas severely impaired, which is most likely due to the different structural environment around the AUG start codon of the FPS2::FPS1S mRNA compared to that of the FPS2 and FPS2::FPS1S-mutdis mRNAs (Figure S1). Among the different structural features known to be involved in translational control of specific mRNAs [53], base-pairing involving nucleotides within the AUG codon has been recognized as an important structural determinant that may influence translation initiation [54], [55].
the lack of FPS1S protein production and enzyme activity recovery (Figure 8B and C). On the contrary, sitosterol and HMGR activity levels were both restored to those of wild-type seeds in lines expressingFPS2p::FPS1S-mutdis (Figures 9A and B). Recovery of wild-type levels of HMGR activity in seeds also restored normal mevastatin sensitivity to these lines (Figure 9C). Altogether, these results demonstrated that FPS1S is able to functionally replace FPS2.
Rescue offps2Mutant Seed Phenotypes by Increasing Total FPS Activity in Seeds
Once we had demonstrated that expression of FPS1S driven by theFPS2promoter was able to rescue the phenotypes caused by loss of function of FPS2, we set out to determine whether
expression of FPS2 driven by theFPS1promoter could also rescue thefps2-1phenotypes. To this endfps2-1plants harbouring genes FPS1mutdisp::FPS2 and FPS1p::FPS2 (Figure 7C and D) were created and characterized.FPS1mutdisp::FPS2consisted of 1526 bp of theFPS159-flanking region, including 1338 bp of theFPS1gene promoter and the entire 59-untranslated region in which the distal ATG start codon was converted into an ATC codon, fused to the genomic coding region ofFPS2so that only FPS2 isoform could be produced from this transgene. In theFPS1p::FPS2gene, the distal ATG codon was not disrupted and therefore this transgene could potentially express both FPS2 and a long version of FPS2 equivalent to FPS1L. Among the transgenic lines obtained, lines 6.2, 5.4 and 5.2 harbouringFPS1mutdisp::FPS2, and lines 3.1, 2.4 and 2.1 harbouring FPS1p::FPS2 were selected for further
Figure 5. Subcellular localization of GFP-tagged FPS1S and FPS2 proteins.Confocal laser scanning micrographs showing the distribution of fluorescence in agroinfiltratedN. benthamianaepidermal cells transiently co-expressing FPS1S-GFP (A), GFP-FPS1S (E), FPS2-GFP (I) or GFP-FPS2 (M) with the peroxisome protein marker CFP-SKL (B, F, J and N). Co-localization evaluation of GFP-tagged FPS proteins with the peroxisome protein marker (C, G, K and O). Differential interference contrast (DIC) images showing the morphology of transformed cells (D, H, L and P). Scale bars = 20mm.
characterization. The expression of the transgenes was analyzed in young seedlings of these lines using semiquantitative RT-PCR and a primer set consisting of a forward primer specific for theFPS159 -untranslated sequence and a reverse primer specific for theFPS2 coding region. All selected lines showed comparable expression levels of the chimeric FPS2 mRNAs that, as expected, were not detected either in wild-type plants or infps2-1plants (Figure 10A). However, striking differences in FPS protein and activity levels were observed between the two groups of transgenic plants. FPS protein content in seeds of the threeFPS1mutdisp::FPS2lines was comparable and only slightly above that found in fps2-1 seed extracts. By contrast, total FPS protein levels inFPS1p::FPS2seeds varied greatly. The amount of FPS protein in line 2.4 was pretty similar to that found inFPS1mutdisp::FPS2plants whereas line 3.1 had strikingly elevated levels of FPS protein. Line 2.1 showed intermediate levels of FPS that were, nevertheless, higher than in wild-type plants (Figure 10B). These differences could be due to the production of different relative amounts of short and long versions of FPS2 in FPS1p::FPS2 seeds. Unfortunately, it is not possible to determine the relative contributions of the individual short and long FPS2 forms to the total amount of FPS2 protein since they both have the same size after processing of the long version of FPS2 [9]. In any case, a close correlation between FPS protein content and enzyme activity levels was observed in the seed extracts of all lines (Figure 10C). Analysis of the characteristic fps2-1phenotypes in seeds of the transgenic lines revealed that the phenotypes associated to loss of function of FPS2 were fully rescued in all transgenic lines regardless of the degree of FPS
activity enhancement in the mature mutant seeds (Figure 11A–C). In fact, a small increase of FPS activity of only 1.2-fold (line 6.2) was sufficient to restore wild-type sitosterol and HMGR activity values as well as normal Mst sensitivity to the same extent than a drastic enhancement of FPS activity (approximately 9-fold in line 3.1). These results suggested that impaired synthesis of FPP in the mature embryo due to the lack of FPS2 activity could be fully compensated just by increasing slightly the synthesis of FPP in the seed maternal tissues.
Discussion
Isozymes usually display specific biochemical properties that allow fine-tuning of metabolic pathways to meet the specific needs of tissues and organs at different developmental stages and/or under different environmental conditions. The occurrence in plants of small FPS isozyme families has raised the still-unanswered question about the role of individual FPS isozymes in the cytosol/ER isoprenoid biosynthetic pathway. Most of the information currently available on the biological function of FPS isozyme family members has been obtained from the pattern of expression of the corresponding genes [11], [14], [15], [16], [17], [25] and the characterization of mutants that either overexpress [8], [10] or lack individual FPS isozymes [26]. By contrast, much less attention has been paid to investigate and compare the biochemical properties of individual FPS isozyme family members, despite this knowledge may also greatly contribute to the understanding of their role in the isoprenoid pathway [18].
Figure 6. Histochemical analysis of GUS activity during seed development in Arabidopsis lines harbouring transgenesFPS1S::GUS
(panels A to E) andFPS2::GUS(panels F to J).Seeds containing embryos at the globular (A and F), heart (B and G), early-torpedo (C and H), torpedo (D and I) and maturation green (E and J) developmental stages were analyzed for GUS expression as described under Material and Methods. GUS expression in the root meristematic region of the embryo at heart (G) and early-torpedo (H) stages in FPS2::GUSseeds is indicated by arrowheads. The inset between panels (H) and (I) shows expression ofFPS2::GUSin the root meristematic region and the pro-vascular tissue of an embryo at the early-torpedo stage.
In this study we report a detailed functional and structural characterization of the Arabidopsis FPS1S and FPS2 isozymes. Both enzymes were efficiently expressed in E. coli as GST-FPS fusion proteins, though the GST tag was removed by proteolytic cleavage during the purification process (Figure 1) to avoid any interference it could have on FPS activity [56]. Biochemical characterization of the purified native FPS1S and FPS2 revealed
that both enzymes displayed very similar pH-rate profiles with an optimum at pH 7.0 (Figure 2). This pH preference was consistent with the predicted cytosolic localization of both FPS isozymes because the pH of the cytoplasm of plant cells is kept slightly alkaline at 7.2-7.5 under non-eliciting conditions [57]. The cytosolic localization of both FPS isozymes was demonstrated by transiently expressing N- and C-terminal fusions of FPS1S and
Figure 7. Schematic representation of chimeric genesFPS2p::FPS1-mutdis(A),FPS2p::FPS1S(B),FPS1mutdisp::FPS2(C) andFPS1p::FPS2
(D).Dark gray boxes representFPS2genomic sequences whereas sequences corresponding toFPS1gene are represented by light gray boxes. In all constructs the 39-untranslated regions of bothFPSgenes is represented by an empty box. The position of the translational start codons is indicated as ATG and that of stop codons is indicated as TAG. In theFPS2p::FPS1S-mutdis(A) andFPS1mutdisp::FPS2(C) constructs, the 59-most ATG codon in exon 1 of theFPS1gene was mutated to an ATC codon (encoding Ile). Arrows indicate the transcription start sites. In theFPS1gene, position+1 was assigned to the most internal transcription start site.
FPS2 with GFP in agroinfiltratedN. benthamianaleaf cells. Under our experimental conditions all the four fusion proteins localized exclusively in the cytosol (Figure 5). This result was fully consistent with the absence of canonical subcellular targeting signals in the FPS1S and FPS2 proteins, and argued against the possibility that
FPS1S and FPS2 could harbour a cryptic signal for peroxisomal targeting as recently reported to occur in a C. roseus short FPS enzyme. In contrast to our results, an N-terminal fusion of CrFPS with YFP was found to localize both in the peroxisomes and the cytosol ofC. roseuscells despite the protein does not contain any
Figure 8. Characterization of fps2-1 mutant lines harbouring FPS2p::FPS1S and FPS2p::FPS1-mutdis genes. (A) The expression of
FPS2p::FPS1SandFPS2p::FPS1-mutdiswas investigated using total RNA from 12-day-old seedlings of Arabidopsis wild-type,fps2-1and the indicated lines of thefps2-1mutant harbouringFPS2p::FPS1S-mutdisandFPS2p::FPS1Schimeric genes (upper panel). PCR products were electrophoresed in a 1% agarose gel. The size in bp of the amplified cDNA fragments corresponding toFPS2p::FPS1-mutdis, FPS2p::FPS1SandACT2 (actin) genes is indicated on the left. The size of the fragment amplified from FPS2p::FPS1S-mutdis lines (548 bp) was larger than that amplified from both
FPS2p::FPS1Slines and wild-type plants (396 bp) because the FPS2::FPS1-mutdis mRNA contains the region between the two ATG translation start codons of theFPS1gene, which is not present in the FPS2::FPS1S mRNA. Numbers on the right indicate the sizes in bp of DNA markers shown in lane M. (B) Western blot analysis of total FPS protein in 16,000gextracts from seeds of plant lines indicated above (upper panel). The lower panel shows the Coomassie blue-stained electrophoretic protein patterns in the 35 to 50 kDa range of extracts used for FPS protein level determinations. Images show the results of one representative experiment. (C) FPS activity in the 16,000gprotein extracts used for Western blot analysis. FPS activity infps
mutants is expressed relative to that in the wild-type, which was assigned a value of 100. The mean values and SE were calculated from three independent experiments.
classical peroxisomal targeting sequence [21]. It is also worth noting that our finding that none of the Arabidopsis short FPS isoforms reside in the peroxisomes was fully consistent with the results of extensive proteomic studies that have detected both FPS1S and FPS2 in the cytosolic proteome of Arabidopsis [58] and could not detect any FPS protein in purified Arabidopsis
peroxisomes [59], [60]. The distinct subcellular localization of Arabidopsis andC. roseusshort FPS isozymes could be related to the different profile of isoprenoid compounds produced by these two plant species [3], [61], though the central position of FPS in the isoprenoid pathway and the fundamental role of isoprenoid biosynthesis in plant biochemistry and physiology would argue
Figure 9. Reversion offps2-1phenotypes by expressing FPS1S under control of theFPS2promoter.Sitosterol (A) and HMGR activity (B) levels in seeds from Arabidopsis wild-type,fps2-1and the indicated lines of thefps2-1mutant harbouringFPS2p::FPS1S-mutdisandFPS2p::FPS1S
chimeric genes. Values are expressed relative to the wild-type values. Data represent the mean values and SE of three independent experiments. (C) Reversion of mevastatin hypersensitivity. Representative seedlings of the same lines were grown for 12 days under long-day conditions (16 h light/ 8 h dark) on MS plates supplemented with 1mM mevastatin.
doi:10.1371/journal.pone.0049109.g009
Figure 10. Characterization of fps2-1 mutant lines harbouring FPS1mutdisp::FPS2 and FPS1p::FPS2 genes. (A) The expression of
FPS1mutdisp::FPS2andFPS1p::FPS2was investigated using total RNA from 12-day-old seedlings of Arabidopsis wild-type,fps2-1and the indicated lines of thefps2-1mutant harbouringFPS1mutdisp::FPS2andFPS1p::FPS2chimeric genes. PCR products were electrophoresed in a 1% agarose gel. The size in bp of the amplified cDNA fragments corresponding toFPS1mutdisp::FPS2andFPS1p::FPS2(1088 bp) andPP2Agenes (307 bp) is indicated on the right. Numbers on the left indicate the sizes in bp of DNA markers shown in lane M. (B) Western blot analysis of total FPS protein in 16,000g
extracts from seeds of plant lines indicated above (upper panel). The lower panel shows the Coomassie blue-stained electrophoretic protein patterns in the 35 to 50 kDa range of extracts used for FPS protein level determinations. Images show the results of one representative experiment. (C) FPS activity in the 16,000gprotein extracts used for Western blot analysis. FPS activity in mutants is expressed relative to that in the wild-type, which was assigned a value of 100. The mean values and SE were calculated from three independent experiments.
Figure 11. Reversion offps2-1phenotypes by expressing FPS2 under the control of theFPS1promoter.Sitosterol (A) and HMGR activity (B) levels in seeds from Arabidopsis wild-type,fps2-1and the indicated lines of thefps2-1mutant harbouringFPS1mutdisp::FPS2andFPS1p::FPS2
chimeric genes. Values are expressed relative to the wild-type values. Data represent the mean values and SE of three independent experiments. (C) Reversion of mevastatin hypersensitivity. Representative seedlings of the same lines were grown for 12 days under long-day conditions (16 h light/ 8 h dark) on MS plates supplemented with 1mM mevastatin.
against this hypothesis. Thus, given the ongoing controversy regarding the subcellular localization of FPS and other MVA pathway enzymes and the potential interference of fluorescent protein tags with proper subcellular targeting of proteins, further studies based on alternative experimental approaches are required in order to establish whether or not short FPS isozymes localize in different subcellular compartments in a plant-species dependent manner.
Comparison of the steady-state kinetic constants of purified FPS1S and FPS2 (Table 1) revealed that both enzymes have similar Km values for their substrates and a clear preference for
GPP over DMAPP as the allylic substrate for FPP formation. A similar kinetic behaviour has also been reported for FPS enzymes from both eukaryotic and prokaryotic organisms [33], [18], [56], [62], [63]. The kinetic similarities between FPS1S and FPS2 are consistent with the high degree of sequence conservation (90.6% identity) shared by these isozymes. However, FPS1S and FPS2 also displayed some remarkable differential properties that must be a consequence of the small differences in their primary structure. FPS2 is a more efficient catalyst that FPS1S by a factor of 2.5- to 3-fold (Table 1). All known FPS proteins contain seven highly conserved amino acid motifs [64] that are involved in enzyme catalysis and product chain length determination [5], [65]. Arabidopsis FPS1S and FPS2 differ by only 32 amino acid residues out of a total of 343 and 342 amino acids, respectively. These amino acid changes are scattered throughout the sequence but, interestingly, none of them is located within the conserved motifs involved in catalysis [12]. Thus, it is difficult to attribute the differences in catalytic efficiency between FPS1S and FPS2 to a particular amino acid substitution. Rather it appears that this functional difference is the consequence of subtle changes in the three-dimensional structure of the enzymes due to multiple individual amino acid changes acting together. In fact, FPS is a homodimeric enzyme in which subunits interact with each other to form a shared active site rather than bearing an independent active site in each subunit [66]. The suggested structural differences between FPS1S and FPS2 must also account for the greater thermal stability (Figure 3) and higher sensitivity to the inhibitory effect of NaCl (Figure 2) exhibited by FPS2 compared to FPS1S. In fact, a single amino acid substitution is sufficient to alter temperature and salt sensitivity in the case of malate dehydroge-nase [67], [68], [69]. Indeed, inspection of atomic-level homology models of FPS1S and FPS2 and theoretical calculations of the free energy and structural changes that accompany the single-site substitution of FPS2 unique amino acids into the FPS1S structural template indicate that surface salt bridge formation and reduced conformational entropy might largely account for the increased thermostability observed for FPS2. These stabilizing electrostatic effects are reflected in specific amino acid composition biases that have been extensively studied in thermophilic proteins [70], [71]. Our recent characterization of Arabidopsisfpssingle knockout mutants showing that FPS1S and FPS2 can almost fully compensate each other’s loss throughout most of the plant life cycle demonstrated that FPS1S and FPS2 have largely overlapping physiological functionalities. The only signs of functional special-ization were observed in mature seeds and early developing seedlings. At these developmental stages FPS2 becomes the major contributor to total FPS activity, to the point that residual FPS1-derived activity in mature seeds is unable to supply enough FPP for normal sterol production, which triggers a compensatory en-hancement of HMGR activity that is crucial for proper seed germination and seedling establishment [26]. Interestingly, our GUS expression analysis during seed development revealed a marked spatial and temporal divergence in the FPS1 and FPS2
expression pattern, which from the torpedo stage onward showed a strong degree of qualitative complementarity (Figure 6), also known as reciprocal expression pattern. This is when only one gene copy is expressed in some organs or tissue types and the other copy is expressed in others [72]. In the mature stages of seed developmentFPS2expression clearly dominates over the expres-sion of FPS1. The FPS2 gene is expressed throughout the endosperm and the embryo at the torpedo stage, and throughout the cotyledonary embryo in mature seeds, whereas the expression ofFPS1remains restricted to the maternal chalazal seed coat. The exclusive expression ofFPS2in the whole cotyledonary embryo, which at this stage occupies most of the seed, along with the higher catalytic efficiency of FPS2, explain why this isozyme is the major contributor to total FPS activity in mature seeds [26]. Interest-ingly, our results from genetic cross-complementation studies of the fps2-1 mutant seed phenotypes showed that expression of FPS1S driven by theFPS2gene promoter (Figure 8) restored wild-type sitosterol and HMGR activity levels as well as normal sensitivity to mevastatin (Figure 9). This finding demonstrated that under normal conditions FPS1S and FPS2 are completely functionally interchangeable, which is fully consistent with the kinetic similarities exhibited by FPS1S and FPS2, and raises the question as to why FPS2 is the predominant FPS isozyme expressed in mature seeds and during the early stages of seed germination and seedling emergence. Seed viability is essential for survival of higher plants and therefore seeds are well equipped to withstand extended periods of exposure to harsh environmental conditions, as for instance extreme temperatures that may cause protein denaturation and inactivation among other effects. Arabidopsis seeds can complete germination even after treatment for more than 3.5 hours at 45uC [73], a temperature that is lethal for seedlings [74]. It is thus tempting to speculate that FPS2 has been evolutionarily selected as the predominant FPS isozyme in mature seeds of Arabidopsis because of its striking thermotoler-ance that could contribute to maintain seed germination capability of seeds exposed to high temperatures. It will be interesting to determine whether other isoprenoid biosynthetic enzymes ex-pressed in seeds also display this biochemical feature. Moreover, the higher catalytic efficiency of FPS2 compared to FPS1S would enable early developing seedlings to sustain an active synthesis of isoprenoid precursors until the newly made FPS1S replaces FPS2 in this task.