HIATUS IN GLOBAL WARMING – THE EXAMPLE OF WATER
TEMPERATURE OF THE DANUBE RIVER
AT BOGOJEVO GAUGE (SERBIA)
by
Vladan D. DUCI]a*, Milan Dj. MILENKOVI]b, Dragana P. MILIJAŠEVI]b, Duško M. VUJA^I]c, eljko N. BJELJACb, Suzana I. LOVI]b,
Mirjana R. GAJI]a, Goran R. ANDJELKOVI]a, and Aleksandar D. DJORDJEVI]a
aFaculty of Geography, University of Belgrade, Belgrade, Serbia
bGeographical Institute “Jovan Cvijic”, Serbian Academy of Sciences and Arts, Belgrade, Serbia cInstitute of Hydrometeorology and Seismology of Montenegro, Podgorica, Montenegro
Original scientific paper DOI: 10.2298/TSCI150430133D
The research included trends in water temperature of the Danube River at Bogojevo gauge and surface air temperature at the nearby meteorological station Sombor, as well as an analysis of the results obtained in relation to the claims of the existence of the hiatus in global air temperature increase in the period 1998-2012. In the period 1961-2013, there was a statistically significant increase in the mean annual water temperature (0.039 °C per year), as well as all the average monthly values. However, with annual values for the period 1998-2013, there was a de-crease. The longest periods of negative trend (27 years) were recorded for January and February. A high correlation was found between the surface air temperature and water temperature for all monthly and seasonal values. In the mean annual air temperature the presence of the hiatus is not observed, but a negative trend is re-corded in March (32 years), December (43 years), and February (49 years). The highest correlations between water temperature and North Atlantic Oscillation (NAO), Arctic Oscillation (AO), and Atlantic Multidecadal Oscillation (AMO) were obtained for the NAO in January (0.60), the AMO in autumn (0.52), and the NAO in winter (0.51). For surface air temperature, the highest correlations were registered for the AMO in summer (0.49) and the NAO in winter (0.42). The results indicate the dominant role of natural factors in the decrease of winter air tempera-ture and water temperatempera-ture of the Danube.
Key words: hiatus, Danube, water temperature, air temperature, NAO, AMO
Introduction
Multi-decadal long term trend of global warming since the end of the 19thcentury was
detected on the basis of instrumental data. However, since the end of the 20thcentury, there is a
hi-atus in global warming. The wordhiatusis mentioned in the report of the IPCC [1] to describe the trend in global temperatures since the end of the last decade of the 20thcentury. In the period
1951-2012, a rise in temperature of 0.12 °C (0.08 to 0.14) per decade was recorded, while from the end of the 20thcentury a significantly lower increase has been recorded, depending on the year
taken as the starting one. If 1997 is taken as the beginning of a series, an increase of 0.07 °C (–0.02 to +0.18) per decade is observed, while in the case of 1998, which is commonly referred to as the initial one, the increase is 0.05 ºC (–0.05 to +0.15) per decade [1]. Most of the research in this field has focussed on air temperature [2-11]. But there is a strong influence of air temperature on water temperature of rivers and streams [12, 13]. Accordingly, an increase in water temperature is re-corded in many rivers. The increase of up to~1 °C in mean river temperatures was recorded in
Eu-rope during the 20thcentury, but this trend was also due to some extreme hydrological events and
also different human activities [14]. On the basis of river water temperature data (1990-2006) from 2,773 locations in England and Wales, it has been confirmed that the mean water tempera-ture rise in this period was 0.03 °C per year (±0.002 °C). Positive trends were observed at 86% of the sites [15]. The hiatus in water temperature is recorded in the rivers of the United States [13]. In the period 1901-1990, an increase of 0.8 °C of the average monthly water temperature of the Dan-ube River in Linz city was found [16]. Important factors that affect the water temperature are the thawing of snow and ice [17], as well as the anthropogenic factor [18]. In the period 1951-2006, there was an increase of about 0.1 °C per decade in the mean annual water temperature of the Dan-ube in Vienna city. Significant increases were recorded for both winter and summer, while autumn and spring temperatures remained constant to quite a large degree [19]. The temperature of the Danube in Bratislava city in the period 1981-2005 increased by 0.6 °C compared to the previous 25 years. At the same time, the mean annual air temperature in Vienna increased by 0.8 °C. How-ever, for the period 1931-2005 the trend was almost flat [20]. The temperature rise of the Danube has also been recorded in the period 1988-2005 [12]. Lovasz [21] determined the differences in the rising trends of the summer water temperature in Hungary (1951-2010): 0.08 °C during 60 years for the Danube section (378.6 km) and 1.1 °C years for the Tisza River section (572.3 km). Since the middle of 1960s, winters were milder for approximately ten years, but in following years there was almost stagnation. In the Eastern part of the Carpathian Basin, after remarkable positive trends back to the beginning of the 1980s, significant slowing down has been recorded since the early 1990s [21]. The research of the temperature trends (1960-2006) at 88 meteorological sta-tions in the Upper Danube Basin showed the increase at a high rate (up to 0.8 °C per decade) of the summer temperature. The trends were highly significant for all investigated summer, spring and annual time series. Winter and spring temperature trends were positive, but in some time series, there was no significance at all and the trend values were smaller. Autumn temperature trends were mostly non-significant and the values were low (up to 0.3 °C per decade) and there were also several negative trends [22].
The aims of this research were to:
– investigate the trend of water temperature of the Danube in Serbia in the example of the hydrological station Bogojevo,
– research the influence of teleconnections on the water temperature, having in mind the influence on air temperature and precipitation in Serbia [23-25], and
– analyse the extent to which the results obtained are in accordance with the claims of the IPCC [1] about the existence of the hiatus in air temperature increase.
Data and methods
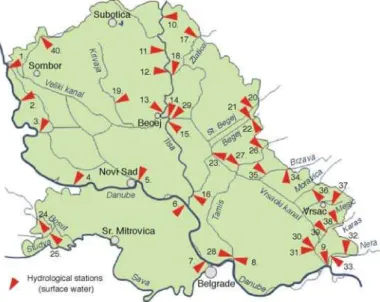
us-ing linear regressions based on the neighbourus-ing hydrological station in Bezdan (45°51.3' N, 18° 51.9' E, 80.64 m a. s. l., distance from the mouth of 1,425.59 km) [26]. The hydrological sta-tions are shown in fig. 1.
The research used surface air temperature data of the closest weather station in city of Sombor (45°46' N, 19°09' E, 88 m a. s. l.) for the period 1949-2013 [27]. Based on Alexandersson test, it has been found that the data for air temperature of Sombor meteorological station are homogeneous [28].
The research also used teleconnection data: North Atlantic Oscillation (NAO) [29], Arctic Oscillation (AO) [30], and Atlantic Multidecadal Oscillation (AMO) [31].
The Pearson's correlation coefficient (R) was used in the correlation calculations. The method of least squares was used for the calculation of the trend. The trend was first calculated for the period 1999-2013 (the same length as the period 1998-2012, in which the report of the IPCC concluded that there was a hiatus), forwarded only for one year (2013) for which new data were available. Then, from the period 1999-2013, the calculation of the trend was extended by one year back (1998-2013, 1997-2013,etc.) as long as the sign of the trend was negative, as op-posed to the expected temperature rise under the influence of enhanced greenhouse effect. In this way the hiatus in the trend of temperature is defined by the strictest criterion (decrease rather than stagnation) in the whole observed period. The significance of the correlations is determined from the table, and trends from the equation:
y=R (n-2) /1-R2 (1)
whereRis Pearson's correlation coefficient,R2– the coefficient of determination, andn– the length of series.
Results
In the period 1961-2013 statistically significant increase was recorded in water tem-perature in all months, seasons, and annual values, which is in line with global changes in air temperature. The increase in mean annual water temperature is 0.039 °C per year. The largest in-crease was recorded in August (0.058 °C per year). Observed by seasons, the highest inin-crease was recorded in summer (0.046 °C per year).
Table 1. Period (years) of decrease in the water temperature of the Danube ( Bogojevo)*
Year Jan Feb Mar Apr May Jun Jul Avg Sep Oct Nov Dec Year Wint. Spr. Sum. Aut.
Start 1986 1986 1988 – 2000 1991 2001 1992 – 1990 2000 2000 1998 1988 1998 1992 1999
End 2013 2013 2013 – 2013 2013 2013 2013 – 2013 2013 2013 2013 2013 2013 2013 2013
No. 27 27 25 – 13 22 12 21 – 23 13 13 15 25 15 21 14
* Periods shorter than 10 years have not been taken into account, since the criteria of Robertset al. [32] has been accepted
However, it has been observed for the annual values that during the period 1998-2013 there was a fall in temperature, similar to the occurrence of the hiatus. Moreover, at six months, the water temperature has decreased for more than 20 years (tab. 1). The maximum duration of the negative trend is registered in January and February (27 years). The trend values are not sta-tistically significant, which is consistent with the applied research methodology for the last year backwards from which the trend is negative, for which the slope of the trend line is inevitably small and statistically insignificant. Observed by seasons, the longest period of hiatus is in win-ter (25 years). In summer, its length is 21 years. In spring it has lasted since 1998 (15 years), while in autumn the hiatus has been present from 1999.
The Pearson's correlation coefficient (R) with the air temperature at the meteorological station in Sombor showed the expected high values for all monthly and seasonal values, of sta-tistical significance atp= 0.01.
In the period 1961-2013, a statistically significant increase in air temperature was re-corded in six months, with the largest increase in January (0.0709 °C per year). Observed by sea-sons, summer only showed a statistically significant increase of 0.052 °C per year.
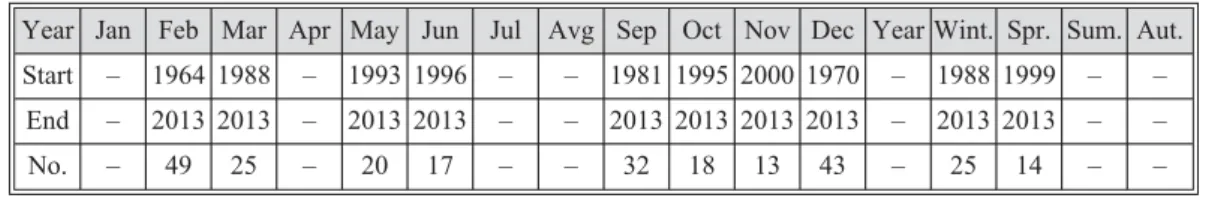
Table 2. Period (years) of decrease in the air temperature (Sombor)*
Year Jan Feb Mar Apr May Jun Jul Avg Sep Oct Nov Dec Year Wint. Spr. Sum. Aut.
Start – 1964 1988 – 1993 1996 – – 1981 1995 2000 1970 – 1988 1999 – –
End – 2013 2013 – 2013 2013 – – 2013 2013 2013 2013 – 2013 2013 – –
No. – 49 25 – 20 17 – – 32 18 13 43 – 25 14 – –
* Periods shorter than 10 years have not been taken into account, since the criteria of Robertset al.[32] has been accepted
The correlations with teleconnections were done in order to establish the cause of the unexpectedly long periods of negative trend in water temperature at Bogojevo hy-drological station and surface air tempera-ture at Sombor meteorological station (NAO, AO, and AMO).
The highest values ofRfor monthly water temperatures and teleconnection are obtained for the NAO (tab. 3). In the period Decem-ber-March,Ris all the time significant atp= =i0.01, with a maximum in January (R= 0.60).
The AO values are slightly lower, and significant correlation occurs in 5 months, with a maximumR in September (0.42). With the AMO, the correlation coefficient is continuously significant in the pe-riod July-November, with a maximum in October (R= 0.47).
Table 3. Pearson's correlation coefficient between water temperatures of the Danube (Bogojevo) and teleconnections (NAO, AO, and AMO)
Jan Feb Mar Apr May Jun Jul Avg Sep Oct Nov Dec
NAO 0.60** 0.37** 0.49** 0.05 –0.02 –0.24 0.06 0.08 0.09 –0.16 –0.05 0.37**
AO 0.37** 0.36** 0.35* 0.21 0.12 –0.27 0.16 0.35* 0.42** –0.04 0.14 0.21
AMO 0.02 0.01 –0.03 0.11 0.21 0.26 0.38** 0.30* 0.29* 0.47** 0.35* –0.06
*p= 0.05; **p= 0.01
At seasonal values of the water temperature (tab. 4),Rshows the highest value in au-tumn with the AMO, 0.52 (fig. 3), followed by the NAO in winter, 0.51 (fig. 4). BothRvalues are significant atp= 0.01. In winter
and spring,Ris significant with the AO, and in summer and autumn with the AMO. The effect of the AO (R= 0.47) and AMO (R= 0.45) is also significant for annual values atp= 0.05.
In case of seasonal values of air temperature, R shows the highest value in summer for the AMO (R= =i0.49), then for winter for the NAO (R= 0.42). The influence of the AO (R= 0.37) and AMO (R= =i0.40) is also significant for an-nual values atp= 0.05.
The matching of statistically significant values of the impact of teleconnection on air and water temperatures is observed for winter for the NAO, for spring for the AO,
Figure 2. Linear trend of December air temperature in Sombor (1949-2013)
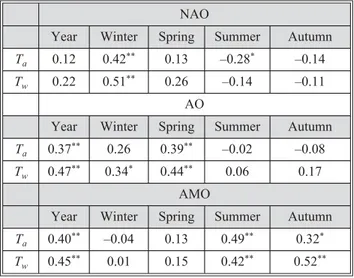
Table 4. Pearson's correlation coefficient between water temperatures of the Danube – Bogojevo (Tw) and air tempera-ture – Sombor (Ta) and teleconnections (NAO, AO, and AMO)
NAO
Year Winter Spring Summer Autumn
Ta 0.12 0.42** 0.13 –0.28* –0.14
Tw 0.22 0.51** 0.26 –0.14 –0.11
AO
Year Winter Spring Summer Autumn
Ta 0.37** 0.26 0.39** –0.02 –0.08
Tw 0.47** 0.34* 0.44** 0.06 0.17
AMO
Year Winter Spring Summer Autumn
Ta 0.40** –0.04 0.13 0.49** 0.32*
Tw 0.45** 0.01 0.15 0.42** 0.52**
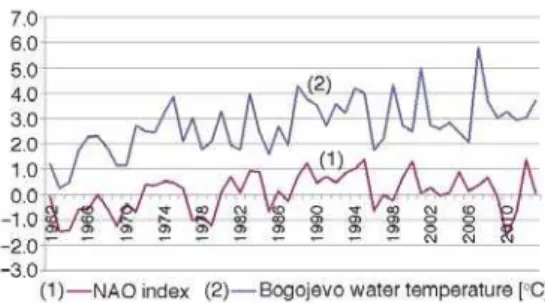
and for summer and autumn for the AMO. In ad-dition, the trend of the NAO index in winter sea-son during the hiatus, which is for air and water temperatures of the same length (25 years), has also been negative, and statistically significant (fig. 5). It certainly confirms the claim that natu-ral factors dominated the decrease of winter air temperatures in Sombor and consequently the Danube water in the last 25 years (1988-2013). After all, the change in temperature by a sign does not fit in the hypothesis of the dominance of the GHG impact.
Discussion
There is no doubt that there is a hiatus in water temperature of the Danube near Bogojevo and that this phenomenon is related to air temperature. Certain doubts also arise in re-lation to the length of the time series which could be considered a hiatus. According to Roberts et al. [32] the probability of a variability-driven 10-year hiatus is ~10%, but less than 1% for a 20-year hiatus. They also claim that the probability of continuing of existing 15-year hiatus for another five years is up to 25%. Santeret al. [33] emphasize that a single decade of observa-tional temperature of lower troposphere data is not adequate for identifying an anthropogenic warming signal. For this purpose they suggest the use of temperature records of at least 17 years. McKitrick [34] confirmed trendless interval of 19 years duration at the end of the HadCRUT4 surface temperature series, and of 16-26 years in the lower troposphere. The use of a simple AR1 trend model suggests a shorter hiatus of 14-20 years, but is probably unreliable.The simulations rule out (at the 95% level) zero trends for an interval of 15 years or more, suggesting that an ob-served absence of warming of this duration is needed to create a discrepancy with the expected present-day warming rate[35].
The highest values of correlation for monthly water temperatures in the Danube in Bogojevo and teleconnections are obtained for the NAO. Webb and Nobilis [36] investigated the thermal regime of the Danube mainstream and found that correlations with the NAO were generally stronger for air than for water temperatures. Correlations were statistically significant for air temperatures in all cases except for the April-June quarter at all stations and the Octo-ber-December period at Zell-am-See. The strongest correlations between air temperature and the NAO residuals were recorded for the January-March quarter. Markovi}, et al. [37] re-Figure 3. Autumn water temperature (Bogojevo)
and AMO (R= 0.52)
Figure 4. Winter water temperature (Bogojevo) and NAO (R= 0.51)
searched the long-term water temperature series from the Elbe and the Danube Rivers Basin. The statistical models based on air temperature, river discharge and the NAO Index successfully described the observed patterns in monthly and daily water temperatures. According to these models, air temperature variability describes more than 80% of the total water-temperature vari-ability. The connection between the NAO and the temperature of rivers and streams has also been found in other areas,e. g. Wales [38].
The trend of winter values of the NAO during the hiatus and the water temperature in Bogojevo is negative and statistically significant, which is not in accordance with the models. In the report of the IPCC [1], the NAO response is being considered to anthropogenic forcing. Cli-mate models are generally able to simulate the gross features of the NAO. Hori,et al. [39] noted that the NAO variability did not change substantially in the SRES-A1B and 20thcentury
scenar-ios. Model simulations have underestimated the magnitude of the large positive trend from 1960-2000 in winter NAO observations, which now appears to be more likely due to natural variability rather than anthropogenic influences. Some studies have even considered NAO to be a source of natural variability that needs to be removed before detection and attribution of anthropogenic changes [40].
Recent multi-model studies of the NAO [39, 41-43] reconfirm the small positive re-sponse of boreal winter NAO indices to GHG forcing noted in earlier studies reported in AR4 [44-46]. Projected trends in wintertime NAO indices are generally found to have small amplitude compared to natural internal variations [47]. Furthermore, there is substantial variation in the NAO projections from different climate models. For example, one study found no significant NAO trends in two simulations with ECHAM4/OPYC3 [48], whereas another study found a strong positive trend in the NAO and the ECHAM5/MPI-OM SRES A1B simulations [49].
Conclusions
This paper analyses the trends of monthly and seasonal and annual water temperatures of the Danube in the hydrological station Bogojevo (45°31' N, 19°04.9' E, 77.46 m a. s. l.) and neighbouring weather station Sombor (45°46' N, 19 °09' E, 88 m a. s. l.). For annual values of water temperature it was observed that in the period 1998-2013 there was a fall in temperature, similar to the occurrence of the hiatus in global air temperature. At six months, the water temper-ature has been decreasing for more than 20 years. The maximum duration of the negative trend is registered in January and February (27 years). Observed by seasons, the longest period of hiatus is in winter (25 years). At seven months, the hiatus is present at the meteorological station Sombor, while at 5 it is longer than 20 years. Data from the beginning of measurement show a negative trend in February from 1957 (56 years), and for December from the first year of mea-surement – 1949 (64 years).
The matching of statistically significant values of the impact of teleconnection on air and water temperatures is observed for winter for the NAO, for spring for the AO, and for summer and autumn for the AMO. The trend of the NAO index in winter season during the hiatus, which is for air and water temperatures of the same length (25 years), is negative (and statistically significant). In the report of the IPCC [1], where the NAO response is being considered to anthropogenic forc-ing, presented models do not indicate a statistically significant negative trend of the NAO. There is no doubt that natural factors are dominant in the decrease of winter air temperatures in Sombor and the Danube waters in the last 25 years (1988-2013). The negative trend of the temperature changes by a sign does not fit in the hypothesis of the dominance of the GHG impact.
anthropogenically-in-duced climatic warming [51]. Sillmann,et al. [9] consider the regional inconsistency between models and observations a possible key to understanding the recent hiatus. In the period 1999-2012, the hiatus in surface warming was evident mainly in the central and eastern Pacific, as well as the anomalies in atmospheric circulation [52]. Yao,et al. [53] consider the global warming hiatus a natural product of interactions of a secular warming trend and a multi-decadal oscillation. The fact is that the occurrence of a strong El Nino 1997/1998 affected the global temperature and that it is important for the beginning of the hiatus. On the other hand, the ENSO phenomenon cannot be with certainty brought into connection with the anthropogenic forcing. Ray and Giese [54], conclude thatthere is no evidence that there are changes in the strength, frequency, duration, location or direction of propagation of El Nino and La Nina anomalies caused by global warming during the period from 1871 to 2008.
Volcanic eruptions contribute to slowing global warming, but they are not the sole or primary cause [55].
Lean and Rind [56] noted that decreasing solar irradiance countered much of the anthropogenic warming in the period 2002-2008. Since, according to forecasts of NASA, the following two solar cycles are going to be below average by intensity, an eventual temperature drop of 1 °C-1.5 °C could be expected and accumulation of much water in the form of ice on the continents [57].
It is evident that the hiatus contributes to scepticism regarding the true nature of global warming, and it is a challenge for climate models [58].
Acknowledgments
This study is supported by the Ministry of Education, Science and Technological De-velopment of the Republic of Serbia – Project III47007.
References
[1] ***, Intergovernmental Panel on Climate Change (IPCC), https://www.ipcc.ch/pdf/assessment-re-port/ar5/wg1/WG1AR5_SPM_FINAL.pdf
[2] Fu, Q.,et al., On the Warming in the Tropical upper Troposphere: Models Versus Observations, Geophysi-cal Research Letters, 38(2011), 15, L15704
[3] Douglass, D. H.,et al., A Comparison of Tropical Temperature Trends with Model Predictions, Interna-tional Journal of Climatology, 28(2008), 13, pp. 1693-1701
[4] Klotzbach, P. J.,et al., An Alternative Explanation for Differential Temperature Trends at the Surface and in the Lower Troposphere,Journal of Geophysical Research: Atmospheres, 114(2009), 21, D21102 [5] Christy, J. R.,et al., Tropospheric Temperature Change since 1979 from Tropical Radiosonde and
Satel-lite Measurements,Journal of Geophysical Research: Atmospheres, 112(2007), 6, D06102
[6] Seidel, D. J.,et al., Reexamining the Warming in the Tropical upper Troposphere: Modelsvs. Radiosonde Observations,Geophysical Research Letters, 39(2012), 22, L22701
[7] Mitchell, D. M.,et al., Revisitig the Controversial Issue of Tropical Tropospheric Temperature Trends,
Geophysical Research Letters, 40(2013), 11, pp. 2801-2806
[8] Fyfe, J. C.,et al., Comparing Variability and Trends in Observed and Modelled Global-Mean Surface Temperature,Geophysical Research Letters, 37(2010), 16, L16802
[9] Sillmann, J.,et al., Observed and Simulated Temperature Extremes during the Recent Warming Hiatus,
Environmental Research Letters, 9(2014), 6, 064023
[10] England, H. M.,et al., Recent Intensification of Wind-Driven Circulation in the Pacific and the Ongoing Warming Hiatus,Nature Climate Change, 4(2014), 3, pp. 222-227
[11] Gavrilov, M. B.,et al., The Analysis of Temperature Trends in Vojvodina (Serbia) from 1949 to 2006,
Thermal Science, 19(2015), Suppl. 2, pp. S339-S350
[13] Kaushal, S. S.,et al., Rising Stream and River Temperatures in the United States,Frontiers in Ecology and the Environment, 8(2010), 9, pp. 461-466
[14] Webb, B. W., Trends in Stream and River Temperature,Hydrological Processes, 10(1996), 2, pp. 205-226 [15] Orr, H. G.,et al., Detecting Changing River Temperatures in England and Wales,Hydrological Processes,
29(2015), 5, pp. 752-766
[16] Webb, B. W., Nobilis, F., Water Temperature Behaviour in the River Danube during Twentieth Century,
Hydrobiologia, 291(1994), 2, pp. 105-113
[17] Koch, F.,et al., How will Hydroelectric Power Generation Develop under Climate Change Scenarios? A Case Study in the Upper Danube Basin,Energies, 4(2011), 10, pp. 1508-1541
[18] Webb, B. W., Nobilis, F., Long Term Water Temperature Trends in Austrian Rivers,Hydrological Sci-ences Journal, 40(1995), 1, pp. 83-96
[19] Zweimuller, I., Temperature Increase in the Austrian Danube – Causes and Consequences,Geophysical Research Abstracts, 9(2007), 11359
[20] Pekarova, P.,et al., Is the Water Temperature of the Danube River at Bratislava, Slovakia, Rising?Journal of Hydrometeorology, 9(2008), 5, pp. 1115-1122
[21] Lovasz, G., Water Temperatures of the Danube and Tisza Rivers in Hungary,Hungarian Geographical Bulletin, 61(2012), 4, pp. 317-325
[22] Reiter, A.,et al., Recent Climate Change at the Upper Danube – A Temporal and Spatial Analysis of Tem-perature and Precipitation Time Series,Climatic Change, 111(2012), 3, pp. 665-696
[23] Jovanovi}, G.,et al., The Influence of Arctic and North Atlantic Oscillation on Precipitation Regine in Serbia, IOP Conference. Series:Earth and Environmental Science, 4(2008), Dec., 012025
[24] Pavlovi}Berdon, N., The Impact of Arctic and North Atlantic Oscillation on Temperature and Precipita-tion Anomalies in Serbia,Geographica Pannonica, 16(2012), 2, pp. 44-55
[25] To{i}, I.,et al., Annual and Seasonal Variability of Precipitation in Vojvodina, Serbia,Theoretical and Applied Climatology, 117(2013), 1-2, pp. 331-341
[26] ***, Republic Hydrometeorological Service of Serbia, Belgrade, Serbia, http://www.hidmet.gov.rs/ciril/hidrologija/povrsinske_godisnjaci.php [27] ***, Republic Hydrometeorological Service of Serbia, Belgrade, Serbia,
http://www.hidmet.gov.rs/ciril/meteorologija/klimatologija_godisnjaci.php
[28] Duci}, V,et al., Contemporary Temperature Changes at the Ground Surface and in the Troposphere over Vojvodina, Serbia,Geographica Pannonica, 12(2008), 2, pp. 56-61
[29] ***, National Oceanic and Atmospheric Adiminstration, National Weather Service, Climate Prediction Cen-ter, http://www.cpc.ncep.noaa.gov/products/precip/CWlink/pna/norm.nao.monthly.b5001.current.ascii.table [30] ***, National Oceanic and Atmospheric Adiminstration, National Weather Service, Climate Prediction
Cen-ter, http://www.cpc.ncep.noaa.gov/products/precip/CWlink/daily_ao_index/monthly.ao.in-dex.b50.current.ascii.table
[31] ***, National Oceanic and Atmospheric Adiminstration, Earth System Research Laboratory, Physical Science Division, http://www.esrl.noaa.gov/psd/data/correlation/amon.us.long.data
[32] Roberts, C. D.,et al., Quantifying the Likelihood of a Continued Hiatus in Global Warming,Nature Cli-mate Change, 5(2015), 4, pp. 337-342
[33] Santer, B. D.,et al., Separating Signal and Noise in Atmospheric Temperature Changes: The Importance of Timescale,Journal of Geophysical Research: Atmospheres, 116(2011), 22, D22105
[34] McKitrick, R. R., HAC – Robust Measurement of the Duration of a Trendless Subsample in a Global Cli-mate Time Series,Open Journal of Statistics, 4(2014), 7, pp. 527-535
[35] Knight, J.,et al., Do Global Temperature Trend over the Last Decade Falsify Climate Predictions, in: State of the Climate in 2008 (Eds. T. C. Peterson, M. O. Baringer), Special Supplement to theBulletin of the American Meteorological Society, 90(2009), 8, pp. 22-23
[36] Webb, B. W., Nobilis, F., Long-Term Changes in River Temperature and the Influence of Climatic and Hydrological Factors,Hydrological Sciences Journal, 52(2007), 1, pp. 74-85
[37] Markovi}, D.,et al., Variability and Alterations of Water Temperatures Across the Elbe and Danube River Basins,Climatic Change, 119(2013), 2, pp. 375-389
[38] Durance, I., Ormerod, S. J., Climate Change Effects on Upland Stream Macroinvertebrates over a 25-year period,Global Change Biology, 13(2007), 5, pp. 942-957
[40] Zhang, X,et al., Multimodel Multisignal Climate Change Detection at Regional Scale,Journal of Climate, 19(2006), 17, pp. 4294-4307
[41] Karpechko, A., Uncertainties in Future Climate Attributable to Uncertainties in Future Northern Annular Mode Trend,Geophysical Research Letters, 37(2010), 20, L20702
[42] Zhu, Y., Wang, H., The Arctic and Antarctic Oscillations in the IPCC AR4 Coupled Models,Acta Meteorologica Sinica, 24(2010), 2, pp. 176-188
[43] Gillett, N. P., Fyfe, J. C., Annular Mode Changes in the CMIP5 Simulations,Geophysical Research Let-ters, 40(2013), 6, pp. 1189-1193
[44] Kuzmina, S. I.,et al., The North Atlantic Oscillation and Greenhouse-Gas Forcing,Geophysical Research Letters, 32(2005) 4, L04703
[45] Miller, R. L.,et al., Forced Annular Variations in the 20thCentury Intergovernmental Panel on Climate Change Fourth Assessment Report Models,Journal of Geophysical Research: Atmospheres, 111(2006), 18, D18101
[46] Stephenson, D. B.,et al., North Atlantic Oscillation Response to Transient Greenhouse Gas Forcing and the Impact on European Winter Climate: A CMIP2 Multi-Model Assessment, Climate Dynamics, 27
(2006), 4, pp. 401-420
[47] Deser, C.,et al., Communication of the Role of Natural Variability in Future North American Climate, Na-ture Climate Change, 2(2012), 11, pp. 775-779
[48] Fischer-Bruns, I.,et al., Future Impact of Anthropogenic Sulfate Aerosol on North Atlantic Climate, Cli-mate Dynamics, 32(2009), 4, pp. 511-524
[49] Muller, W. A., Roeckner, E., ENSO Teleconnections in Projections of Future Climate in ECHAM5/MPI-OM,Climate Dynamics, 31(2008), 5, pp. 533-549
[50] Wang, S.,et al., Does the Global Warming Pause in the Last Decade: 1999-2008?Advances in Climate Change Search, 1(2010), 1, pp. 49-54
[51] Hunt, B. G., The Role of Natural Climatic Variation in Perturbing the Observed Global Mean Temperature Trend,Climate Dynamics, 36(2011), 3, pp. 509-521
[52] Trenberth, K. E.,et al., Seasonal Aspects of the Recent Pause in the Surface Warming,Nature Climate Change, 4(2014), 10, pp. 911-916
[53] Yao, S.-L.,et al., The Global Warming Hiatus – a Natural Product of Interactions of a Secular Warming Trend and Multi-Decadal Oscillation,Theoretical and Applied Climatology, 119(2015), 1-2, pp. 1-12 [54] Ray, S., Giese, B. S., Historical Changes in El Nino and La Nina Characteristics in an Ocean Reanalysis,
Journal of Geophysical Research: Oceans, 117(2012), C11, C11007
[55] Haywood, J. M.,et al., The Impact of Volcanic Eruptions in the Period 2000-2013 on Global Mean Tem-perature Trends Evaluated in the HadGEM2-ES Climate Model,Atmospheric Science Letters, 15(2014), 2, pp. 92-96
[56] Lean, J., Rind, H. D., How Will Earth's Surface Temperature Change in Future Decades?Geophysical Re-search Letters, 36(2009), 15, L15708
[57] Nurtaev, B., Responses to Climate Variability in Different Catchments, AGU Chapman Conference on Catchment Spatial Organization and Complex Behaviour, Luxemburg City, Luxemburg, 2014
[58] Douville, H.,et al., The Recent Global Warming Hiatus: What is the Role of Pacific Variability? Geophys-ical Research Letters, 42(2015), 3, pp. 880-888