ORIGINAL ARTICLE
J of Evidence Based Med & Hlthcare, pISSN- 2349-2562, eISSN- 2349-2570/ Vol. 2/Issue 5/Feb 02, 2015 Page 513
SOCIO-DEMOGRAPHIC PROFILE OF OLD AGE PEOPLE LIVING IN
URBAN & URBAN SLUM AREAS IN MAHARASHTRA, KARAD: A
COMPARATIVE STUDY
Leena Rahul Salunkhe1
HOW TO CITE THIS ARTICLE:
Leena Rahul Salunkhe. ”Socio-Demographic Profile of old age People living in Urban & Urban Slum Areas in Maharashtra, Karad: A Comparative Study”. Journal of Evidence based Medicine and Healthcare; Volume 2, Issue 5, February 02, 2015; Page: 513-521.
ABSTRACT: INTRODUCTION: Aging refers to normal, progressive and irreversible biological changes that occur over an individual’s life span. The advancement of medical science and increased awareness among the people has brought about a sharp decline in mortality and a steady decline in fertility. This has resulted in a worldwide shift in the demographic profile and has led to significant increase in the aged population. About two thirds of all older people are concentrated in the developing world. OBJECTIVES: to study & compare socio-demographic variables of old age people living in Urban & Urban slum areas. MATERIAL & METHODS: all the old age people living in urban slum area & randomly selected one urban area of Karad town were interviewed by using pre structured proforma about socio-demographic variable & compared with each other. OBSERVATIONS: Total 153 from urban & 135 from urban slum were enrolled for the study. Nearly2/3rd subjects were above age 65yrs in both areas with more female proportions in slum area than urban area. Significant difference was found with education, occupation & socio-economic status in both areas. CONCLUSION: Ageing is a universal phenomenon, with advanced fertility control, improvement in health and social services life expectancy has increased. Ageing has profound effect on the individual status in the family, the work force, goals and organization of health, social services, policies and practices of the government.
KEYWORDS: old age, urban area, urban slum, socio-demographic variables.
INTRODUCTION: Aging refers to normal, progressive and irreversible biological changes that
occur over an individual’s life span. Aging is a constant, predictable process that involves growth
and development of living organisms. Aging can also be defined as a state of mind, which does not always keep pace with our chronological age. Attitude and coping with the normal changes, challenges and opportunities of later life may best define our age.1
The advancement of medical science and increased awareness among the people has brought about a sharp decline in mortality and a steady decline in fertility. This has resulted in a worldwide shift in the demographic profile and has led to significant increase in the aged population. About two thirds of all older people are concentrated in the developing world and by 2025 this figure is projected to raise further.2
The world’s elderly population has been growing for centuries. The global population aged
ORIGINAL ARTICLE
J of Evidence Based Med & Hlthcare, pISSN- 2349-2562, eISSN- 2349-2570/ Vol. 2/Issue 5/Feb 02, 2015 Page 514
vary from around 4% in small states like Dadra & Nagar Haveli, Nagaland Arunachal Pradesh, Meghalaya to more than 10.5% in Kerala. According to NSSO 2007-08 proportions of the elderly in India was 7.5 and of Maharashtra state was 8.7%.4
Majority of the problems that confront older persons are the result of priorities, policies and practices of society. Ageing is mainly associated with social isolation, poverty, apparent reduction in family support, inadequate housing, impairment of cognitive functioning, mental illness, widowhood, loss, bereavement, limited options for living arrangement and dependency towards end of life.5 The care of the elderly is drawing more and more attention of the Government and public.6
OBJECTIVES: To study the socio demographic profile of old age people & to compare it with Urban & Urban slum areas.
MATERIAL & METHODS: Community based cross-sectional study was conducted in Urban and urban slum area of Karad town, Dist. Satara, Maharashtra. The urban slum area is a slum community adopted under the Urban Health Training Center (UHTC) of KIMS Karad, situated on National Highway-4 (Pune-Bangalore). There are fifteen residential areas present in the Karad town, out of which Somwar peth was selected randomly by using lottery method. All individuals 60 years and above were taken as study subjects from this residential area. The area is situated at the bank of Krishna River. This area is 4Kms away from KIMS Hospital with a total population of around is 1500. The study was conducted during the period between November 2010 to October 2012. Institutional Ethical Committee clearance was taken before the start of the study.
Initial visits were paid to develop rapport and to explain nature of study in the groups of study subjects. By house to house visits interviews were taken as per pretested proforma (which was translated into vernacular language) conducted along with examination. The interview was taken in the local language without changing the meaning of the questionnaire in a maximum privacy and confidentiality. The information on personnel data, family, social was collected.
Thorough medical examination of each elderly subject was carried out at home.
OBSERVATIONS:
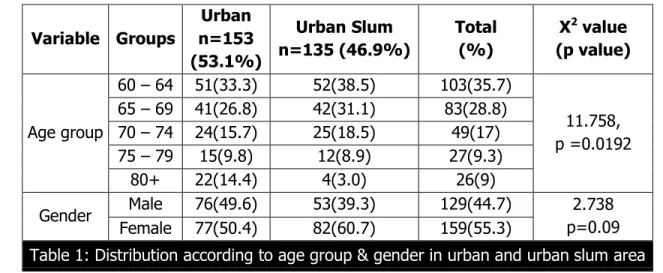
Variable Groups
Urban n=153 (53.1%)
Urban Slum n=135 (46.9%)
Total (%)
X2 value (p value)
Age group
60 – 64 51(33.3) 52(38.5) 103(35.7)
11.758, p =0.0192 65 – 69 41(26.8) 42(31.1) 83(28.8)
70 – 74 24(15.7) 25(18.5) 49(17) 75 – 79 15(9.8) 12(8.9) 27(9.3)
80+ 22(14.4) 4(3.0) 26(9)
Gender Male 76(49.6) 53(39.3) 129(44.7) 2.738 p=0.09 Female 77(50.4) 82(60.7) 159(55.3)
ORIGINAL ARTICLE
J of Evidence Based Med & Hlthcare, pISSN- 2349-2562, eISSN- 2349-2570/ Vol. 2/Issue 5/Feb 02, 2015 Page 515
In this distribution table about 69.6% and 60.1% aged were from 60-69 yrs age group i.e. young old in urban slum and urban area respectively; while only 3% from urban slum and 14.4% from urban area were from 80+ age group. Above table shows significant difference in the age distribution in urban slum and urban area.
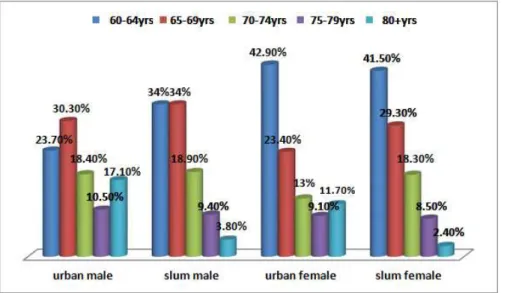
The distribution of sex in urban area showed that majority of female study subjects (66.3%) were from age group 60-69 years and only 11.7% were from age group above 80 years and above which was lower than male study subjects (17.1%) whereas in urban slum area 70.3% female respondents were in the 60-69 years age group which was slightly higher than males (68%). In 80+ age group male and female study subjects were equally found.
Variable Group Urban Slum (%)
Urban (%)
X2 value (p value)
Education
Illiterate 109(80.7) 33(21.6)
113.54, (p< 0.0001) Primary 19(14.1) 30(19.6)
Secondary 4(3.0) 47(30.7) Higher
secondary 2(1.5) 26(17.0) College 1(0.7) 15(9.8) Graduate 0 2(1.3)
Socio-economic status
I 0(0) 131(85.6)
270.43 (<0.001) II 1(0.7) 18(11.8)
III 24(17.8) 4(2.6) IV 89(65.9) 0
V 21(15.6) 0
ORIGINAL ARTICLE
J of Evidence Based Med & Hlthcare, pISSN- 2349-2562, eISSN- 2349-2570/ Vol. 2/Issue 5/Feb 02, 2015 Page 516
The Illiteracy was much higher in urban slum (80.7%) than urban area (21.6%). In urban study respondents 30% studied up-to primary level, majority (30.7%) done up-to secondary level, higher secondary (17%),college (9.8%), graduate (1.3%).
In urban slum area 14.1% were educated up-to primary level, 3.0% were educated up-to secondary level, only 1.5% and 0.7% were educated up-to higher secondary and college level, no one was educated up to graduate. There was significant difference in the literacy rate between Urban Slum and urban area
In the Urban slum area no one was from class I while maximum belonged to class IV & V. But in the urban area 85.6% from class I, while no one was from class IV and class V. Socio-economically both the areas showing significant difference (p<0.001).
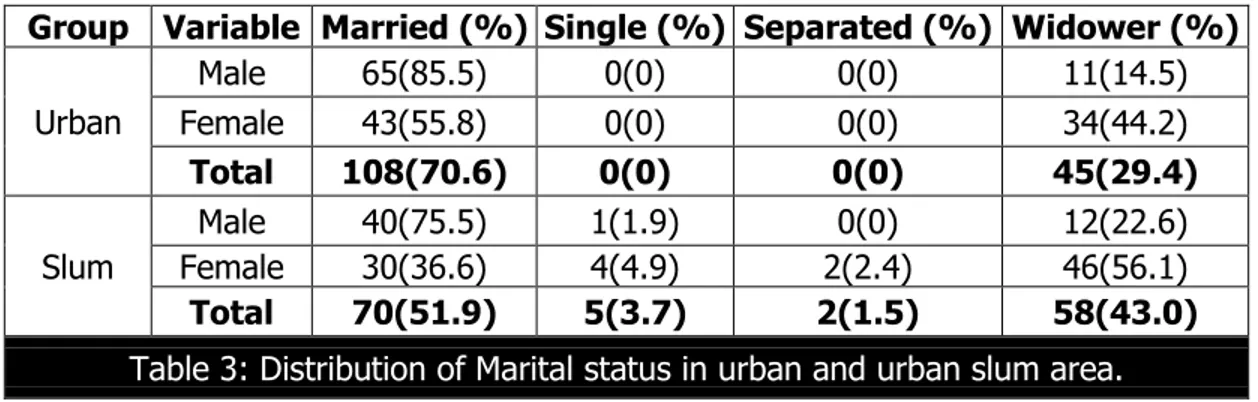
Group Variable Married (%) Single (%) Separated (%) Widower (%)
Urban
Male 65(85.5) 0(0) 0(0) 11(14.5) Female 43(55.8) 0(0) 0(0) 34(44.2)
Total 108(70.6) 0(0) 0(0) 45(29.4)
Slum
Male 40(75.5) 1(1.9) 0(0) 12(22.6) Female 30(36.6) 4(4.9) 2(2.4) 46(56.1)
Total 70(51.9) 5(3.7) 2(1.5) 58(43.0)
Table 3: Distribution of Marital status in urban and urban slum area.
In the urban area 85.5% males, 55.8% females were married and only 14.5% were living without spouse (widower) which was higher in females (44.2%).Similarly in the urban slum area 56.1% females were widows and 22.6% males were widower. Overall distribution of marital status in urban area was70.6% was married and 29.4% were widower and in urban slum area was 51.9% were married, 43% were living without spouse, 3.7% were single and 1.5% were separated. There was significant difference in distribution of marital status in urban area. (X2 =15.689, p=0.0013, df= 3)
Majority of respondents belonged to joint families in all 50.3% and 62.2% were from urban and urban slum area respectively. Three generation families were more in urban area (19.6%) than urban slum area (5.9%). The nuclear families were equally found in urban (30.1%) and urban slum area (31.9%). It was found that there was significant difference between distribution of families in urban and urban slum area. (12.064P= 0.0024), df = 2)
Groups Variable Working (%) Not Working (%) X2(P)
Urban
Male 25(47.2) 28(52.8)
7.517 (0.0061), Female 20(24.4) 62(75.6)
Total 45(33.3) 90(66.7)
Urban Slum
Male 15(19.7) 61(80.3) 9.246 (0.0024) Female 3(3.9) 74(96.1)
Total 18(11.8) 135(88.2)
ORIGINAL ARTICLE
J of Evidence Based Med & Hlthcare, pISSN- 2349-2562, eISSN- 2349-2570/ Vol. 2/Issue 5/Feb 02, 2015 Page 517
The above table depicts the participation of elderly in working was 33.3% from urban and 11.8% from urban slum. Nonworking among females was 75.6% in urban and 96.1% in urban slum. Urban male respondents (47.2%) were higher than urban slum (19.7%) in work participation. There was significant difference seen in male and female distribution of working condition in urban (p=0.0061) and urban slum area (p=0.0024). The overall working status in urban and urban slum area differ significantly (p<0.0001).
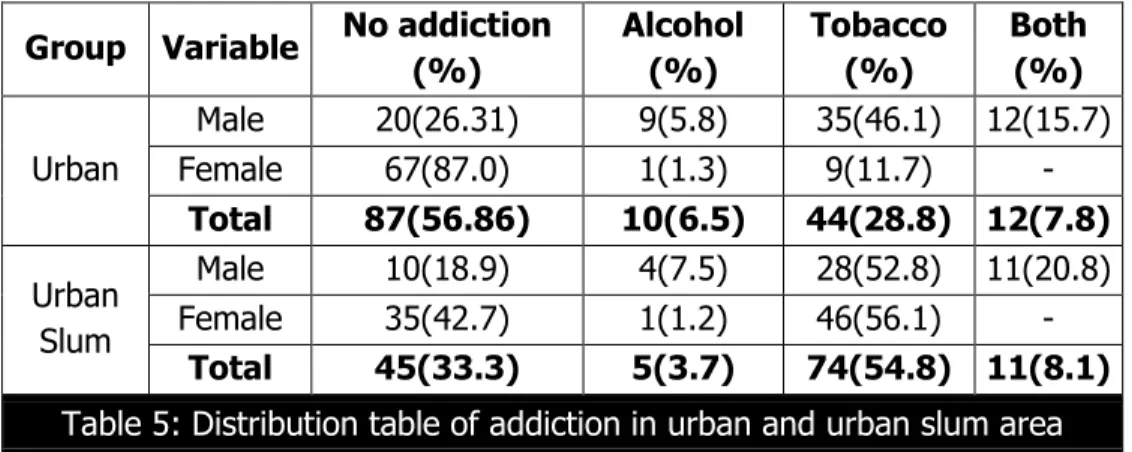
Group Variable No addiction (%)
Alcohol (%)
Tobacco (%)
Both (%)
Urban
Male 20(26.31) 9(5.8) 35(46.1) 12(15.7) Female 67(87.0) 1(1.3) 9(11.7) -
Total 87(56.86) 10(6.5) 44(28.8) 12(7.8)
Urban Slum
Male 10(18.9) 4(7.5) 28(52.8) 11(20.8) Female 35(42.7) 1(1.2) 46(56.1) -
Total 45(33.3) 5(3.7) 74(54.8) 11(8.1)
Table 5: Distribution table of addiction in urban and urban slum area
As mentioned in the above table about 54.8% population was addicted to the tobacco habit in slum area and 28.8% in urban area. It was observed that 56.86% were not addicted to any habit, 6.5% addicted to alcohol and 7.8% addicted to both the habits in urban area whereas in urban slum area 33.3% were not addicted to any habit, 3.7% addicted to alcohol and 8.1% addicted to both habits. In urban slum respondents females 56.15% were having tobacco addiction, while only 11.7% urban female respondents having same addiction. There was significant difference found in distribution of addiction in urban and urban slum area. (X2=26.661, p<0.0001, df=3).
Morbidities Urban (%) Urban slum (%)
Arthritis 72(50.4) 60(42) Hypertension 43(30.1) 23(16.1) Upper Respiratory
Tract Infection 10(7) 28(19.6) Cataract 16(11.2) 30(21.0) Acid Peptic Disease 24(16.8) 22(15.4) Diabetes Mellitus 20(14) 5(3.5)
Asthma 9(6.3) 8(5.6) Other 18(12.6) 4(2.8) X2(p) 35.619, (<0.0001)
Table 6: Distribution of Morbidity pattern in urban and urban slum area
ORIGINAL ARTICLE
J of Evidence Based Med & Hlthcare, pISSN- 2349-2562, eISSN- 2349-2570/ Vol. 2/Issue 5/Feb 02, 2015 Page 518
slum (16.1%).The more number of Upper Respiratory Infections were found in slum (19.6%) than urban (7%) area. Acid peptic diseases were found in 16.8% study subjects in urban area and 15.4% in slum area. The number of subjects had cataract was found in 11.2% in urban and 21% in urban slum area. The above table shows significant difference in the morbidities between two areas (p<0.0001).
DISCUSSION: The proportion of elderly found in urban area was 10.1% and in urban slum area was 7.9%, which was found higher in urban area and lower in urban slum area compared with recent statistics in NSSO survey 2007-084 (India:7.5%,Maharashtra: 8.7%)
Majority of the population as depicted in table no.1 was from the age group 60-69 years i.e. young old (urban slum=69.6%, urban=60.1%) which was similar to a study conducted by Sengupta et.al.7 had 60% respondents from the same age group. Another study conducted by Lena et. al.8 in rural area of Udapi taluk, Karnataka where it was 72.3%,which was on slightly higher side than this study. Female study subjects (urban= 50.3%, urban slum = 60.7%) were on higher side than male study subjects (urban =49.6%, urban slum = 39.3%) in both the study areas. In another study conducted by Barua et.al9 had 40.0% males and 60.0% females, showed similar results. Also in the NSSO survey 2007-085 females (7.7%) were on higher proportion than males (7.3%). Similar findings were seen in Lena et. al.,8 Joshi et.al.,10 Bansod et.al.11
It is evident from table no 2, illiteracy among both the groups combined was found 49.3%. While respondents in urban slum it was 80.7%, which was higher than urban area (21.6%). There was significant difference in the literacy rate between two areas (p <0.0001). This could be because of lack of awareness regarding the importance of education in urban slum population. Female study subjects were more illiterate than males in both the study areas. A study conducted by Lena et.al.8 female illiteracy (62%) was higher than male illiteracy (22.8%).
This could be due to educating females in those days was not considered as important as for a marriage at an early age. According to NSSO 2007-085 for geriatric group the literacy rate in urban area at national level was 61% which was higher in this study in urban area (78.9%) and in Maharashtra,5 males(61%) were more literate than females(23%) which was similarly found in this study.
In the urban slum area 56.1% were widows and 22.6% were widower. The widowers form 14.98 % as against 50.06% widows found in the Rajan et.al. study12 which was similar with current study. In S.V. Kamble et.al.13 (33.13%) and Bhatia et. al.14 (39.3%) study the proportion
of widowers was slightly lower side than this study. Widow’s form a large proportion of the
elderly, particularly with Indian women because; they were married to men 10-15 years who were older than themselves, therefore, has to endure longer periods of widowhood.
ORIGINAL ARTICLE
J of Evidence Based Med & Hlthcare, pISSN- 2349-2562, eISSN- 2349-2570/ Vol. 2/Issue 5/Feb 02, 2015 Page 519
It was observed from table no.5, 54.8% study subjects had tobacco habit in urban slum area and 28.8% in urban area. Only 6.5% from urban and 3.7% from urban slum study subjects were having alcohol addiction. In urban slum area 56.15% females were having tobacco addiction, while only 11.7% urban females having same addiction. As mishari a (one form of tobacco) user among females were more common in urban slum than urban area and was statistically significant. Another study conducted in urban slum by G. V. Niranjan et.al,16 showed 68.3% female subjects and 42.65% male subjects were addicted to tobacco and 27.1% male subjects were addicted to both alcohol and tobacco, which was similarly found in urban slum area in this study.
In Munshi et al,17 a study conducted in Kashmir valley showed 64.7% subjects were suffering from irregular sleeping habits which was found higher than present study which might be due to insecurity among the people in that area. Harshal et al18 study showed 40% subjects had insomnia which was slightly lower in the urban area. In Munshi et. al17 study, 37.2% subjects having poor appetite.
Urinary problems were more common among aged men seen in NSSO 0419 (at national
level 89 per 1000 urban males) which was found comparatively lower in our study area i.e. urban area. Such finding may be due to different study setting i.e. one at national level and other at town level.
Present study, case definition for different chronic diseases was taken as ‘known or diagnosed by a specialist and taking treatment’. In this study from table no.6 50.4% and 42% aged were suffering from arthritis in urban and slum area respectively. In the studies by Lena et al8 (43.7%)., Bhatia et al14 (45.7%) had similar findings. The studies by Lena et al.,8 Dharmvir et al,21 Chandwani et al.,22 prevalence found of Hypertension and diabetics as a leading problem which was similarly found in urban area in this study. The study conducted by Ingale et al23 in rural area of Pondichery showed 8% diabetics and 14% hypertensives, which was similarly found in urban slum area in present study.
The Upper Respiratory Infections were found more among respondents in slum (19.6%) than urban (7%) area. The prevalence of asthma was slightly higher in urban (6.3%) than slum subjects (5.6%). Prakash et al24, found 14% of study subjects were having asthma which was found higher than urban area in present study
CONCLUSION: Ageing is an universal phenomenon, with advanced fertility control, improvement in health and social services life expectancy has increased. Ageing has profound effect on the individual status in the family, the work force, goals and organization of health, social services, policies and practices of the government.
REFERENCES:
1. Mehta P, Sharma M, Chauhan K. ‘A Study on Health and Nutritional Status of Very Old
Elderly (85+ Years) and Centenarians.’ Indian Journal of Gerontology 2009;Vol. 23, No. 3: Pp 277-284.
ORIGINAL ARTICLE
J of Evidence Based Med & Hlthcare, pISSN- 2349-2562, eISSN- 2349-2570/ Vol. 2/Issue 5/Feb 02, 2015 Page 520
3. U.S. department of health and human services national institutes of health national institute on ageing world: 2001. www.hhs.gov/about/hhshist.html.
4. Situation Analysis of the Elderly in India. Central Statistics Office, Ministry of Statistics & Programme Implementation. Government of India; June 2011: page.no.1-50. Mospi.nic.in/mospi_new/upload/elderly_in_india.pd.
5. Sing C, Mathur Mathur JS, Mishra VN, Singh JV, Singh RB, Garg BS. ‘Social problems of aged
in a rural population.’ Indian J Community Med 1994;19:23-5.
6. Mahajan B.K., Gupta M.C. The textbook of preventive and social medicine. Jaypee Brothers Medical Publisher 2nd edition; 1995:620-23.
7. Sengupta P, Singh S, Benjamin A.I. ‘Health of the Urban Elderly in Ludhiana, Punjab’. Indian Journal of Gerontology 2007; 21(4):368-377.
8. Lena A, Ashok K, Padma M, Kamath V, Kamath A. ‘Health and social problems of the elderly: A cross-sectional study in Udupi Taluk, Karnataka.’ Indian J Community Med 2009; 34: pg131-4.
9. Barua A, Mangesh R, Harsha Kumar HN, Mathew S.’ A cross-sectional study on quality of life
in geriatric population.’ Indian Journal of Community Med 2007; 32:146-7.
10.Kamlesh Joshi, Ajit Avasthi, Rajesh Kumar. ‘Health-related quality of life (hrqol) among the elderly in northern India.’ Health and Population-Perspectives 2003; Vol. 26 (4): pg 141-153.
11.Bansod D. W. ‘Care and Support During Twilight Years: Perception of Descendants by Their
Elderly in Rural Maharashtra.’ Indian Journal of Gerontology2011;25(2):249-269.
12.Population ageing and health in india s Irudaya Rajan, The Centre for Enquiry into Health and Allied Themes (CEHAT), Mumbai july 2006: pg 1-12.
13.Kamble S.V, Dhumale G.B, Goyal R.C, Phalke D.B, Ghodake Y.D. ‘Depression among elderly persons in a primary Health centre Area in Ahmednagar, Maharashtra.’ Indian Journal of Public Health Oct-Dec 2009; Vol. 53, No.4.
14.Bhatia S, Swami HM, Thakur JS, Bhatia V. ‘A study of health problems and loneliness among
the elderly in Chandigarh’. Indian J Community Med 2007; Vol. 32: pg255.
15.Jain R.K, Aras Y. K.’ Depression in geriatric population in Mumbai.’ Indian Journal of public health April – June, 2007; vol 51, no 2.
16.Niranjan G.V., Vasundhara M.K. ‘A study of health status of aged persons in slums of urban
field practice area, Banglore.’ Indian Journal of Community Medicine jan-dec 1996; vol 21, no. 4.
17.Munshi Y.I,. Iqbal M,. Rafique H, Ahmad Z. ‘Geriatric Morbidity Pattern and Depression in Relation to Family Support in Aged Population of Kashmir Valley. ’The Internet Journal of Geriatrics and Gerontology 2008; Volume 4 Number 1.
18.Pandve HT, Deshmukh P. ‘Health Survey among Elderly Population Residing in an Urban
Slum of Pune City’. Journal of The Indian Academy of Geriatrics March, 2010; Vol. 6, No. 1. 19.Morbidity, Health Care and the Condition of the Aged, Jan.-June, 2004; Report No 507:
page.no. 46-53. www.calameo.com/books/00154971256116718dd66.
ORIGINAL ARTICLE
J of Evidence Based Med & Hlthcare, pISSN- 2349-2562, eISSN- 2349-2570/ Vol. 2/Issue 5/Feb 02, 2015 Page 521
Community Med 2007; vol. 32: 7 pg 7-8.
21. Bharati DR, Pal R, Rekha R., Yamuna T. V, Kar S, Radjou A.N ‘. Ageing in Puducherry,
South India: An overview of morbidity profile.’ Journal of Pharm Bioallied Sci. 2011 Oct-Dec; Vol. 3 (4): pg 537–542.
22.Chandwani H, Jivarajani P. ‘Health and Social problems of geriatric population in an Urban setting of Gujarath, India.’ The Internet Journal Of Health2009; Volume 9 Number 2.
23.Ingle GK, Nath A. ‘Geriatric health in India: Concerns and solutions.’ Indian Journal of Community Med 2008; Vol. 33: 214-8.
24.Prakash R, Choudhary S.K., Singh US. ‘A study of morbidity pattern among geriatric
population in an urban area of udaipur rajasthan.’ Indian Journal of Community Medicine Jan.-Mar., 2004; Vol. 29, No.1.
AUTHORS:
1. Leena Rahul Salunkhe
PARTICULARS OF CONTRIBUTORS: 1. Assistant Professor, Department of
Community Medicine, Shrinivas Institute of Medical Sciences and Research Centre, Mukka, Mangalore.
NAME ADDRESS EMAIL ID OF THE CORRESPONDING AUTHOR: Dr. Leena Rahul Salunkhe, # 406, Staff Quarters,
Shrinivas Institute of Medical Sciences & Research Centre, Mukka, Mangalore. E-mail: leenashete@yahoo.co.in