Quantitative Proteomic Analysis of Human Lung Tumor
Xenografts Treated with the Ectopic ATP Synthase
Inhibitor Citreoviridin
Yi-Hsuan Wu1, Chia-Wei Hu1, Chih-Wei Chien2, Yu-Ju Chen2, Hsuan-Cheng Huang3*, Hsueh-Fen Juan1* 1Institute of Molecular and Cellular Biology, Department of Life Science, National Taiwan University, Taipei, Taiwan,2Institute of Chemistry, Academia Sinica, Taipei, Taiwan,3Institute of Biomedical Informatics, Center for Systems and Synthetic Biology, National Yang-Ming University, Taipei, Taiwan
Abstract
ATP synthase is present on the plasma membrane of several types of cancer cells. Citreoviridin, an ATP synthase inhibitor, selectively suppresses the proliferation and growth of lung cancer without affecting normal cells. However, the global effects of targeting ectopic ATP synthasein vivohave not been well defined. In this study, we performed quantitative proteomic analysis using isobaric tags for relative and absolute quantitation (iTRAQ) and provided a comprehensive insight into the complicated regulation by citreoviridin in a lung cancer xenograft model. With high reproducibility of the quantitation, we obtained quantitative proteomic profiling with 2,659 proteins identified. Bioinformatics analysis of the 141 differentially expressed proteins selected by their relative abundance revealed that citreoviridin induces alterations in the expression of glucose metabolism-related enzymes in lung cancer. The up-regulation of enzymes involved in gluconeogenesis and storage of glucose indicated that citreoviridin may reduce the glycolytic intermediates for macromolecule synthesis and inhibit cell proliferation. Using comprehensive proteomics, the results identify metabolic aspects that help explain the antitumorigenic effect of citreoviridin in lung cancer, which may lead to a better understanding of the links between metabolism and tumorigenesis in cancer therapy.
Citation:Wu Y-H, Hu C-W, Chien C-W, Chen Y-J, Huang H-C, et al. (2013) Quantitative Proteomic Analysis of Human Lung Tumor Xenografts Treated with the Ectopic ATP Synthase Inhibitor Citreoviridin. PLoS ONE 8(8): e70642. doi:10.1371/journal.pone.0070642
Editor:Sumitra Deb, Virginia Commonwealth University, United States of America
ReceivedApril 8, 2013;AcceptedJune 20, 2013;PublishedAugust 21, 2013
Copyright:ß2013 Wu et al. This is an open-access article distributed under the terms of the Creative Commons Attribution License, which permits unrestricted use, distribution, and reproduction in any medium, provided the original author and source are credited.
Funding:This work was supported by the National Science Council, Taiwan (NSC 99-2621-B-002-005-MY3, NSC 99-2621-B-010-001-MY3) and National Taiwan University Cutting-Edge Steering Research Project (102R7602C3). The funders had no role in study design, data collection and analysis, decision to publish, or preparation of the manuscript.
Competing Interests:The authors have declared that no competing interests exist. * E-mail: hsuancheng@ym.edu.tw (H-CH); yukijuan@ntu.edu.tw (H-FJ)
Introduction
Lung cancer is the leading cause of cancer-related death worldwide, with nearly 1.4 million people dying from lung cancer each year [1]. One of the treatment strategies for lung cancer is based on the discovery that subsets of lung cancer harbor specific mutations in genes coding crucial proteins involved in signaling pathways of cell survival and proliferation. For example, gefitinib (Iressa) and erlotinib (Tarceva), two drugs inhibiting epidermal growth factor receptor (EGFR) tyrosine kinase, are effective therapies for non-small cell lung cancer (NSCLC) [2–4]. However, unavoidable drug resistance eventually develops in patients with objective responses to gefitinib or erlotinib initially [5,6]. Furthermore, 30% of patients receiving gefitinib showed not much change from pre-treatment conditions [7,8].
The oncogenic gene expression in cancer causes alterations to metabolism besides affecting signaling pathways. Nutrients are converted to biosynthetic building blocks, which are further converted to macromolecules for constituting new cells [9]. Glucose is the major source of cellular energy and building blocks for new cells. Hence, glucose metabolism and dependence are altered in cancer cells. In 1924, Otto Warburg observed that rapidly proliferating cancer cells exhibited higher glucose consumption than normal cells through higher levels of glycolysis, which turns glucose into lactate even in the presence of oxygen
[10,11]. This phenomenon is known as the Warburg effect, and is also called aerobic glycolysis to distinguish from traditional anaerobic glycolysis, where glucose is converted to lactate when limited oxygen is available. The major advantage of aerobic glycolysis is maintaining the level of glycolytic intermediates to sustain continuous building blocks for macromolecular synthesis, including generating nucleotides, lipids, and amino acids [12,13]. The understanding of cancer metabolism showed that aerobic glycolysis is a promising target for cancer therapies.
ATP synthase is nature’s smallest motor that is important in producing energy to drive many processes in cells. Although ATP synthase has been thought to be exclusively located on the inner membrane of mitochondria, several reports have showed that components of ATP synthase also exist on the plasma membrane of several types of cells. ATP synthase located on the plasma membrane is called ectopic ATP synthase or ecto-ATP synthase. In tumor cells, ectopic ATP synthase was recognized as a ligand of a cytolytic pathway used by naive natural killer (NK) and lymphokine-activated killer (LAK) cells [14,15]. Furthermore, ATP synthase was also found on the surface of breast cancer cells and was involved in cell proliferation, which showed that it could be a target for cancer therapy [16]. Diverse categories of ATP synthase inhibitors have been discovered and investigated, including peptides, polyphenolic phytochemicals, polyketides, polyenic a-pyrone derivatives, and so on [17]. One of the
compounds called citreoviridin is a polyene mycotoxin produced by several molds of genera, such asPenicillium and Aspergillus. It consists of an a-pyrone ring conjugated to a furan ring. Citreoviridin inhibits the activity of ATP synthase by interacting with thebsubunit of F1 ATP synthase [18,19]. It was shown to affect several metabolic enzymes, including glycogen synthase, glutamic-oxaloacetic transaminase and transketolase [20–22]. Citreoviridin has been proved to inhibit the proliferation of the lung adenocarcinoma cell lines A549 and CL1-0 by activating the unfolded protein response [23].
Proteomics, which measures mature proteins, could be used to closely observe biological functions in cells. There are two major methods available for mass spectrometry (MS) quantitation, the stable isotope-based and the label-free approaches [24]. A well-established and widely used stable isotope-based method is isobaric tags for relative and absolute quantitation (iTRAQ) [25]. iTRAQ reagents are amide reactive and covalently link to the N terminus and side chain of lysine residues of peptides. It provides multiplex protein quantitation by labeling peptides from different samples with different iTRAQ reagents. One of the most significant advantages of iTRAQ quantitation is that the intensities of peptide precursor ions in MS and fragment ions in MS/MS are enhanced
by combination of all iTRAQ-labeled samples prior to MS analysis, which increases the accuracy of quantitation. However, global biases can arise from the sample preparation, reducing the accuracy of protein quantitation [26]. Therefore, a good normalization method is of significant importance and should be performed to access accurate quantitation. Another key concern about iTRAQ is the integration of peptide-level information into the measurement of protein abundance [27]. A variety of algorithms were proposed and many software packages are also available for estimation of protein expression.
In this study, our major objective was to elucidate the effect induced by citreoviridin in a lung cancer xenograft model. Applying proteomic analysis, we investigated the proteomic changes and pathways leading to cell proliferation inhibition caused by citreoviridin in lung cancer. First, the reproducibility of the iTRAQ-based proteomic strategies was assessed, followed by the acquisition of the proteomic profiling of citreoviridin-treated tumors with iTRAQ proteomic experiments. For data analysis, we optimized the normalization of iTRAQ signals and quantified the expression of proteins identified. After selecting differentially expressed human proteins between control and citreoviridin-treated tumors, we investigated the pathways induced by
Figure 1. Tumor growth and cell proliferation analysis in the CL1-0 xenograft model.(A) Tumor regression in a xenograft model. The tumor volume was decreased after treatment with citreoviridin. 56106CL1-0 cells were implanted subcutaneously in SCID mice and the abdominal injection of citreoviridin was performed after tumor size reached 100 mm3. (B) The histology (left, H&E, 1006) and Ki67 staining (right, Ki67, 1006) within the same area of tumor tissues. (C) The percentage of proliferating cells in tumor sections using Ki67-immunohistochemistry. Ki67 staining showed a lower percentage of proliferating cells in citreoviridin-treated tumors. (D) Histological analysis of tumor tissues and mice organs. The histology of tumor and organ tissue sections was analyzed by H&E staining (tumor sections, 406; organ sections, 1006). No obvious histological damages were observed in citreoviridin-treated organ sections, including the heart, kidney and liver. All the staining was performed in 10mm cryostat
sections. H&E, hematoxylin and eosin. doi:10.1371/journal.pone.0070642.g001
citreoviridin in lung cancer xenograft tumors. Finally, the most significant pathway elucidated by bioinformatics methods was subsequently validated.
Results
The effect of an ATP synthase inhibitor on tumor xenografts
We investigated the effect of an ATP synthase inhibitor on lung cancer growthin vivoby monitoring the growth rate of tumors in a xenograft model. By measuring the tumor volume, our study showed a reduced tumor growth rate in citreoviridin-treated mice (Figure 1A). We further studied cell proliferation by immunohis-tochemical analysis of Ki67, an important marker of proliferating cells [28]. Our results showed that the percentage of Ki67 positive cells was significantly lower in citreoviridin-treated tumor tissues (Figure 1B and Figure 1C). All these results suggest a role for ATP synthase inhibitors that suppresses the malignant development of tumors. Moreover, the histological analysis of citreoviridin-treated tumor tissues and other organs (heart, kidney, and liver) also revealed a less serious condition of tumor development with low toxicity to major organs of mice (Figure 1D).
Reproducibility assessment by analysis of the iTRAQ duplicate experiment
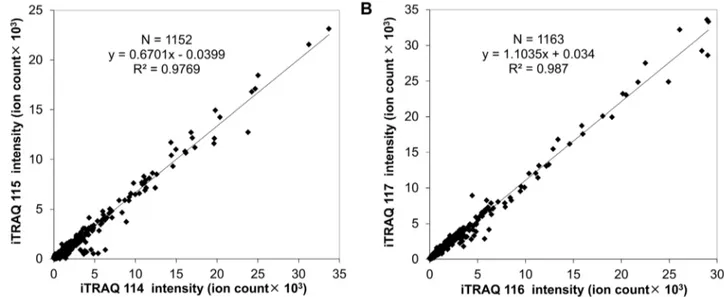
We applied proteomic analysis to investigate the effects of targeting ectopic ATP synthase in a human lung cancer xenograft model. Reproducibility is an important concern for quantitative proteomic studies. Any procedure, including protein extraction, reduction, alkylation, trypsin digestion and iTRAQ labeling, may affect the reproducibility and accuracy of quantitation. In order to check the reproducibility, two replicate preparations of proteins from both controls (C1aand C1b) and citreoviridin-treated (T1a and T1b) tumor samples were analyzed (Figure S1). Two replicate proteins were independently extracted from tumors and separately subjected to reduction, alkylation and trypsin digestion. For iTRAQ labeling, equal amounts of peptides from each sample were labeled with iTRAQ. Sample C1awas labeled with iTRAQ 114 tag while sample C1b was labeled with iTRAQ 115 tag. Sample T1awas labeled with iTRAQ 116 tag while sample T1b was labeled with iTRAQ 117 tag. All iTRAQ-labeled peptides were combined and analyzed by LC-MS/MS. The proteomic data were provided in Table S1 and the information of single-peptide-based protein identifications was in Spectra S1. After protein identification and peptide selection, the original intensity of each of the iTRAQ signature ions was plotted in Figure 2. There was a high correlation (the correlation coefficient R2= 0.9769) between two replicate control tumor samples, iTRAQ 114-labeled C1a and iTRAQ 115-labeled C1b (Figure 2A). Two replicate citreoviridin-treated tumor samples, iTRAQ 116-labeled T1a and iTRAQ 117-labeled T1b, also showed high correlation (the correlation coefficient R2= 0.987, Figure 2B). The high correlation of peptide iTRAQ signature ion intensity between duplicate samples indicated that the iTRAQ quantitative proteomic experiment has high reproducibility and accuracy.
Proteomic profiling of citreoviridin-treated tumors To investigate the proteomic change induced by citreoviridin, proteins of two control tumors (C1and C2) and two
citreoviridin-treated tumors (T1and T2) from a total of four different mice were
analyzed (Figure S2). We first performed a small-scale experiment, which analyzed 5mg peptides of each sample. For iTRAQ labeling, peptides from samples C1, C2, T1and T2were labeled
with iTRAQ 114, 115, 116 and 117 tags, respectively. The proteomic data of the small-scale experiment were provided in Table S2 and the information of single-peptide-based protein identifications was in Spectra S2. We identified 277 proteins with a false discovery rate (FDR) of 3.51%. It was confirmed that 99.72% of identified peptides were labeled with iTRAQ and a total of 1,185 peptides were qualified for protein quantitation (Table 1).
To identify more proteins, a large-scale experiment, which analyzed 150mg peptides of each sample, was performed to acquire the proteomic profiling of two control tumors (C1and C2)
and two citreoviridin-treated tumors (T1and T2) from a total of
four different mice (Figure S2). Peptides from samples C1, C2, T1
and T2were also labeled with iTRAQ 114, 115, 116 and 117 tags,
respectively. To reduce the sample complexity and increase the possibility of detecting low abundance proteins, the combined iTRAQ-labeled peptides were fractioned by strong cation exchange (SCX) chromatography. A total of 39 fractions were individually analyzed by LC-MS/MS. The SCX chromatogram and the number of proteins identified in each fraction were shown in Figure 3. The proteomic data of the large-scale experiment were provided in Table S3 and the information of single-peptide-based protein identifications was in Spectra S3, Spectra S4 and Spectra S5. In this large-scale experiment, we identified a total of 2,659 proteins with FDR of 2.22% (Table 1). Compared to the results of the small-scale experiment, SCX chromatography reduced the sample complexity and enhanced protein identification. It was also confirmed that 99.53% of identified peptides were labeled with iTRAQ and a total of 28,894 peptides were qualified for protein quantitation (Table 1).
Optimization of peptide iTRAQ signal normalization After protein identification, the peptides with qualified intensi-ties of iTRAQ signature ions were selected for further quantitative analysis. Deviation of the iTRAQ signature ions intensities of peptides (hereafter referred to as peptide iTRAQ signals) may exist due to measurement errors in the experiments and individual variations from biological replicates of samples. Therefore, normalization is necessary for accuracy in protein quantitation. We have tried seven different normalization methods. The details of the normalization methods and evaluation were described in Method S1. First, we use the dataset from the duplicate experiment (Figure S1), which contained 296 identified proteins and 1,159 qualified peptides for protein quantitation (Table 1). Briefly, the normalized peptide iTRAQ signals were used for calculation of the S values, which represent the errors of the protein abundance ratios, followed by the calculation of mean of all S values (Table S4). Considering normalization performed directly on the level of peptide iTRAQ signals, the methods 1 and 2, which had relative small mean of S values (Table 2) were selected.
To test whether method 1 and method 2 had the capability of normalizing larger datasets, we applied these two normalization methods to the dataset of the large-scale experiment (Figure S2), which contained 2,659 identified proteins and 28,894 qualified peptides for protein quantitation. Similarly, the mean ofSvalues was also calculated from the normalized peptide iTRAQ signals (Table S5). It was shown that method 1 had a smaller mean ofS values than method 2 (Table S6). Next, normalized peptide iTRAQ signals were used for the calculation of the protein abundance ratios,C2/C1andT2/T1, which should be close to 1
with a good normalization method. The results showed that the mode of log2 (T2/T1) was 20.2 with normalization method 1,
while the mode of log2(C2/C1) and log2(T2/T1) were both 0 with
normalization method 2 (Figure 4). Compared with method 1, Citreoviridin in Human Lung Tumor Xenografts
method 2 was able to correct both the protein abundance ratios, C2/C1andT2/T1. Therefore, we chose method 2 as the optimal
normalization approach for our data.
Quantitation of protein expression by iTRAQ signals The normalized peptide iTRAQ signals were used for the quantitation of proteins identified in the small-scale and large-scale experiments. We applied the sum of intensities in protein quantitation. The iTRAQ signature ion intensities of peptides matching the protein were summed and the protein abundance ratio was calculated as dividing a sample’s summation of intensities to another sample’s summation of intensities. This is a weighted calculation because the larger intensity has more contribution to the protein abundance ratio. For each protein, we calculated four protein abundance ratios,T1/C1,T2/C2,T2/C1andT1/C2. There
were over 90% of proteins quantified in both experiments (Table 1). The distribution of these four sets of protein abundance ratios in both experiments was shown in Figure 5, indicating that the expression level of most proteins remained unchanged with the treatment of citreoviridin. The R value of each protein, which represents the relative abundance of the protein, was calculated with the four protein abundance ratios,T1/C1,T2/C2,T2/C1and
T1/C2. The distribution ofRvalues in the small-scale and
large-scale experiments was shown in Figure 6A and Figure 6B,
respectively. The median of R values (MR) in the large-scale experiment was 0.0037.
Cut-off value calculation for selecting differentially expressed proteins
In order to elucidate the proteomic change induced by citreoviridin in lung cancer xenograft tumors, differentially expressed proteins were selected by their relative protein abundance between control and citreoviridin-treated tumors. However, differences observed between control and treatment groups may arise from measurement errors in experiments and individual variations among tumors from different mice. There-fore, to positively select the differentially expressed proteins, we first calculated the cut-off values that indicate a significant degree of up-regulation or down-regulation. The large-scale experiment, which contains two biological replicates for both control and citreoviridin-treated tumor samples, is suitable for measuring the errors. TheSvalue of each protein, which represents the error of protein abundance ratios, was calculated by its protein abundance ratios,T1/C1andT2/C2. Each protein had oneSvalue and the
distribution ofSvalues can be deemed as the distribution of errors (Figure 6C). Assuming that the errors follow a normal distribution, a 1.96-fold of the standard deviation (1.96 S.D.) of S values is statistically significant (P,0.05) and can be taken as the cut-off
Figure 2. iTRAQ quantitative proteomic experiments showed high reproducibility and accuracy.(A) Scattering plot of two replicate control tumor samples, iTRAQ 114-labeled C1aand iTRAQ 115-labeled C1b. (B) Scattering plot of two replicate citreoviridin-treated tumor samples,
iTRAQ 116-labeled T1aand iTRAQ 117-labeled T1b.
doi:10.1371/journal.pone.0070642.g002
Table 1.Statistics of three iTRAQ quantitative proteomic experiments.
iTRAQ quantitative proteomic experiment
Number of proteins
identified FDR (%)a
Percentage of iTRAQ-labeled peptides (%)
Number of qualified peptidesb
Percentage of quantified proteins (%)
Duplicate experiment 296 2.14 99.67 1,159 93.92
Small-scale experiment 277 3.51 99.72 1,185 98.56
Large-scale experiment 2,659 2.22 99.53 28,894 94.55
aFDR (false discovery rate) was calculated by the formula:D/R
6100%, whereDandRare the number of matches above identity threshold determined by searching decoy and real databases, respectively.
bQualified peptides are peptides satisfying all the four criteria (see Methods for details) and were used for protein quantitation.
doi:10.1371/journal.pone.0070642.t001
value. The standard deviation ofSvalues (sS) calculated from the large-scale experiment was 0.4256. The median ofRvalues (MR) in the large-scale experiment was 0.0037. The cut-off values were defined asMR61.96sS. Hence, we took 0.8379 and20.8306 as cut-off values for selecting differentially expressed proteins. The data of cut-off value calculation were provided in Table S7.
To select the differentially expressed proteins from the datasets of small-scale and large-scale experiments, the R value of each protein was compared with the cut-off values. In the small-scale experiment that identified 277 proteins, there were five proteins withRvalues larger than the cut-off value 0.8379 and can be taken as up-regulated proteins. On the other hand, three proteins, which hadRvalues smaller than the cut-off value20.8306, were down-regulated (Figure 6A). Among the 2,659 identified proteins in the
large-scale experiment, 84 proteins with R values larger than 0.8379 were up-regulated, while 60 proteins withRvalues smaller than20.8306 were down-regulated (Figure 6B).
The standard deviation of S values (sS) calculated from the large-scale experiment was the estimation of the errors from both of the experimental measurements and the individual variations among biological replicates of samples. We were also able to determine the errors only from the experimental measurements. TheSvalue of each protein identified in the duplicate experiment was calculated by its protein abundance ratios,T1a/C1aandT1b/ C1b. Samples C1aand C1bwere from the same control tumor and T1aand T1bwere from the same citreoviridin-treated tumor. In theory,T1a/C1aandT1b/C1bwere free from the error caused by the individual variations of biological replicates of samples. Therefore, the standard deviation ofSvalues from the duplicate experiment (sS(t)) can be deemed as the errors arising only from the
experimental measurements. The distribution ofSvalues and the sS(t) calculated from the duplicate experiment were shown in
Figure S3. With the sS, which represented the total errors of experimental measurements and individual variations among tumors, and thesS(t), which represented the errors only from the
experimental measurements, the errors arising from the individual variations of biological replicate of samples (sS(b)) can be estimated:
s2S(b)~s 2
S{s
2
S(t)
ThesS(b)calculated by the above equation was 0.2461 (Table S7).
Bioinformatics analysis of human differential proteomic profiling induced by citreoviridin
To elucidate the pathways induced by the ATP synthase inhibitor citreoviridin in tumors of lung cancer xenografts, we applied bioinformatics analysis to the differentially expressed proteins between control and citreoviridin-treated tumors. In the xenograft mouse model, mouse cells may be present in the subcutaneous tumors of human lung cancer. To exclude the contaminants of mouse proteins in our analysis, we selected only human proteins from the differential proteomes in the small-scale and large-scale experiments acquired previously. A total of 141 differentially expressed human proteins were selected, including 78 proteins with identified peptides only matched to human proteins
Figure 3. Strong cation exchange (SCX) chromatogram. The absorbance of peptide bonds occurs at 214 nm. Therefore, the left axis represents the contents of combined iTRAQ-labeled peptides. Fractions were collected every minute. The right axis is the number of identified proteins in each fraction. Error bars represent standard deviation of the replicate analysis of LC-MS/MS. Fraction 19: n = 5; fraction 47: n = 3; fraction 54: n = 4; other fractions: n = 2.
doi:10.1371/journal.pone.0070642.g003
Table 2.TheSvalues calculated by seven different normalization methods in the duplicate experiment.
Svalueb
Normalization level Method Descriptiona Mean S.D.c
Peptide iTRAQ signal 1 Equal summation of peptide iTRAQ signals 20.02026 0.34727
2 Median of log2(peptide iTRAQ ratio) to zero 0.01946 0.34727
3 Trend line of peptide iTRAQ signals 0.16265 0.29973
4 Trend line of log2(peptide iTRAQ signal) 0.04154 0.33903
5 Multi-Q normalization factor performing on peptide iTRAQ signals 0.02810 0.34727
Protein abundance ratio 6 Multi-Q normalization factor performing on protein abundance ratio 0.02810 0.34727
7 Median of log2(protein abundance ratio) to zero 0.00816 0.34727
aDetailed calculation methods are described in Method S1. bSvalue is in log2scale:
S~1 2log2
T1a:C1b T1b:C1a
~1 2 log2
T1a C1a
{log2
T1b C1b
whereT1a/C1ais the protein abundance ratio of citreoviridin-treated tumor sample T1ato control sample C1a,
whileT1b/C1bis the protein abundance ratio of citreoviridin-treated tumor sample T1bto control sample C1b. cS.D.: standard deviation.
doi:10.1371/journal.pone.0070642.t002
Citreoviridin in Human Lung Tumor Xenografts
and 63 proteins with identified peptides matched to both human and mouse proteins (Table S8).
To characterize the biological functions of differentially expressed proteins, first we performed functional annotation with Gene Ontology biological process by using DAVID Bioinformatics Resources [29,30]. The functional annotation clustering enriched in our dataset was shown in Table 3 and Table S9. The top two GO biological process clusters were related to glucose metabolism, indicating that several citreoviridin-regulated proteins were involved in glucose metabolism pathways. The protein
ubiquitina-tion process was also enriched in the differentially expressed protein dataset. In the proteomic profiling, we also identified ubiquitin to be up-regulated 3.31-fold in tumors treated with citreoviridin (Table S8).
Next, we used MetaCore to analyze the pathway maps that differentially expressed proteins were involved in. The level of intersection between pre-existing pathway maps in the MetaCore database and our differentially expressed protein dataset was calculated and ordered based on the significance of relevance (Figure 7A and Table S10). The top pathway map enriched in our
Figure 4. The distribution of log2 (C2/C1) and log2 (T2/T1) in the large-scale experiment by using normalization method 1 and
method 2.C
2/C1andT2/T1were the protein abundance ratios of sample C2to C1and sample T2to T1, respectively. doi:10.1371/journal.pone.0070642.g004
Figure 5. The distribution of four sets of treatment to control log2protein abundance ratios.(A) Small-scale experiment. (B) Large-scale experiment.T1/C1,T2/C2,T2/C1andT1/C2were the protein abundance ratios of sample T1to C1, sample T2to C2, sample T2to C1and sample T1to C2, respectively.
doi:10.1371/journal.pone.0070642.g005
data was the glycolysis and gluconeogenesis pathway map (p-value = 9.7661028). Besides, six of the ten most enriched pathway maps were related to glycolysis and gluconeogenesis. The eight differentially expressed proteins involved in the glycolysis and gluconeogenesis pathway map were all up-regulated in tumors treated with citreoviridin. The change in expression level of
enzymes involved in gluconeogenesis and glycolysis in the large-scale experiment were summarized in Figure 7B. The list of proteins involved in gluconeogenesis and glycolysis processes were in Table 4 and most enzymes were up-regulated with the treatment of citreoviridin.
We found that differentially expressed proteins involved in the glycolysis and gluconeogenesis pathway were all up-regulated with the treatment of citreoviridin. To investigate the functions of the 62 down-regulated proteins, they were annotated with Gene Ontology biological process by using DAVID. It was shown that several down-regulated proteins were involved in macromolecular complex assembly and mitosis (Table S9 and Table S11). To further investigate the interactions between the differentially expressed human proteins in citreoviridin treatment tumors, we performed network analysis with these proteins as seed nodes by using MetaCore. The top five networks related to the differentially expressed proteins were shown in Table S10 and Table S12. The top network was related to the macromolecule catabolic process and ubiquitin-regulated cell cycle (Figure S4).
In summary, three major pathways, i.e. glucose metabolism, protein ubiquitination and cell cycle regulation, were involved in the citreoviridin-induced effects on lung cancer xenograft tumors. Of the three major pathways induced by citreoviridin, glucose metabolism had the most prominent role. We identified and quantified most of the enzymes catalyzing glycolysis and gluco-neogenesis (Figure 7B). Besides, enzymes involved in glucose metabolism were identified with high confidence and their expression levels were significantly changed by citreoviridin (Table 4). Furthermore, gluconeogenic enzymes and the enzyme catalyzing the reaction of converting glucose tomyo-inositol was also up-regulated (Table 5). Therefore, we focused on the citreoviridin-induced gluconeogenesis process.
Validation of citreoviridin-induced gluconeogenesis in lung cancer xenograft tumors
To confirm the regulation of gluconeogenesis by citreoviridin in lung cancer xenograft tumors, we measured the protein expression
Figure 6. Quantitation of differentially expressed proteins.(A) The distribution of theRvalues in the small-scale experiment. TheR value of each protein was calculated by the protein abundance ratios T1/C1,T2/C2,T2/C1andT1/C2. There were 277 proteins identified and 8 proteins were differentially expressed as determined by comparing with the cut-off values. (B) The distribution of theRvalues in the large-scale experiment. There were 2,659 proteins identified and 144 proteins were differentially expressed as determined by comparing with the cut-off values. (C) The distribution of theSvalues in the large-scale experiment. TheSvalue of each protein was calculated by the protein abundance ratios T1/C1and T2/C2. The standard deviation of theS values was 0.4256.sS: standard deviation of theSvalues.
doi:10.1371/journal.pone.0070642.g006
Table 3.Gene Ontology biological process clustering enrichment analysis of the differential proteome induced by citreoviridin in humans.
GO biological process cluster Enrichment scorea
Carbohydrate catabolic process 6.20
Glucose metabolic process 5.96
Protein ubiquitination 5.25
Macromolecule catabolic process 3.15
Regulation of developmental growth 2.83
Intermediate filament organization 2.40
Cellular amide metabolic process 2.34
Protein modification by small protein conjugation
2.19
Regulation of programmed cell death 1.67
Cellular polysaccharide metabolic process
1.57
Macromolecular complex assembly 1.50
Negative regulation of apoptosis 1.47
aThe enrichment score is the geometric mean (in
2log scale) of the p-values of the members in the annotation cluster. It represents the significance of relevance between the group of annotations and the experimental dataset. doi:10.1371/journal.pone.0070642.t003
Citreoviridin in Human Lung Tumor Xenografts
level of seven proteins involved in glucose metabolism. L-lactate dehydrogenase B chain (LDH-B), a-enolase, phosphoglycerate kinase 1 (PGK-1), fructose-bisphosphate aldolase C (aldolase C) glucose-6-phosphate isomerase (GPI) are enzymes that shared by glycolysis and gluconeogenesis. On the other hand, mitochondrial phosphoenolpyruvate carboxykinase (PEPCK-M) and cytoplasmic
malate dehydrogenase (MDH1) are two the key eznymes catalyzing gluconeogenesis. The expression levels of these seven enzymes were all higher in citreoviridin-treated tumors than in control tumors (Table 4). We analyzed the proteins previously extracted from two control (C1 and C2) and two
citreoviridin-treated (T1 and T2) biological repeated tumor samples for
Figure 7. Bioinformatics analysis of human differential proteomic profiling induced by citreoviridin.(A) Pathways associated with differentially expressed human proteins by MetaCore pathway map analysis. The top associated pathway was the glycolysis and gluconeogenesis pathway and there were eight differentially expressed human proteins involved in the glycolysis and gluconeogenesis pathway. (B) The expression level of enzymes involved in gluconeogenesis and glycolysis in the large-scale experiment. Several enzymes were up-regulated with citreoviridin treatment. Enzymes specific for gluconeogenesis and glycolysis are shown in light blue and purple, respectively.
doi:10.1371/journal.pone.0070642.g007
Table 4.List of proteins in gluconeogenesis and glycolysis identified in the large-scale experiment.
No. Accession Gene
symbol Description Score
No. of unique peptidesa
Coverage (%)b
log2(T1/
C1)
log2(T2/
C2)
log2(T2/
C1)
log2(T1/
C2) Rvaluec sRd
T/C ratioe Mf
Both in gluconeogenesis and glycolysis
Lactate dehydrogenase
1 P00338 LDHA L-lactate dehydrogenase A chain 1740 15 48.2 1.06 0.95 0.81 1.20 1.01 0.14 2.01
2 P07195 LDHB L-lactate dehydrogenase B chain 2132 15 46.7 1.28 0.58 0.75 1.11 0.93 0.28 1.91
Enolase
3 P06733 ENO1 Alpha-enolase 9055 20 61.1 1.32 0.88 0.75 1.45 1.10 0.29 2.14
Phosphoglycerate mutase
4 P18669 PGAM1 Phosphoglycerate mutase 1 1599 9 57.9 0.51 0.77 0.56 0.72 0.64 0.11 1.56 +
Phosphoglycerate kinase
5 P00558 PGK1 Phosphoglycerate kinase 1 2588 18 52 1.08 1.43 1.35 1.16 1.25 0.14 2.38
Glyceraldehyde-3-phosphate dehydrogenase
6 P04406 GAPDH Glyceraldehyde-3-phosphate dehydrogenase 11276 15 63.3 0.58 0.61 0.79 0.41 0.60 0.14 1.52
Triose phosphate isomerase
7 P60174 TPI1 Triose phosphate isomerase 2671 13 53.8 0.61 0.66 0.66 0.61 0.64 0.03 1.55
Aldolase
8 P04075 ALDOA Fructose-bisphosphate aldolase A 3775 21 68.4 1.01 1.37 1.01 1.37 1.19 0.18 2.28
9 P09972 ALDOC Fructose-bisphosphate aldolase C 2223 7 28.3 0.74 0.94 0.49 1.19 0.84 0.26 1.79
Phosphohexose isomerase
10 P06744 GPI Glucose-6-phosphate isomerase 3426 17 42.3 1.09 1.06 0.94 1.20 1.07 0.09 2.11
Gluconeogenesis
Phosphoenolpyruvate carboxykinase
11 Q16822 PCK2 Phosphoenolpyruvate carboxykinase [GTP],
mitochondrial (PEPCK-M)
73 1 3.1 20.19 0.77 1.14 20.56 0.29 0.69 1.22
Mitochondrial malate dehydrogenase
12 P40926 MDH2 Malate dehydrogenase, mitochondrial 2910 11 42 0.24 0.28 0.08 0.44 0.26 0.13 1.20
Cytosolic malate dehydrogenase
13 P40925 MDH1 Malate dehydrogenase, cytoplasmic 1272 8 30.5 0.83 1.07 0.78 1.12 0.95 0.15 1.93
Glycolysis
Pyruvate kinase
14 P14618 PKM2 Pyruvate kinase isozymes M1/M2 6203 29 62 0.49 0.72 1.05 0.15 0.60 0.33 1.52
Phosphofructokinase-1
15 P08237 PFKM 6-phosphofructokinase, muscle type 1069 13 22.4 0.20 0.03 0.05 0.18 0.12 0.07 1.08
16 P17858 PFKL 6-phosphofructokinase, liver type 834 7 12.2 20.06 0.39 0.41 20.08 0.16 0.24 1.12
17 Q01813 PFKP 6-phosphofructokinase type C 1661 12 20.3 0.04 0.53 0.48 0.08 0.28 0.22 1.22
Citreoviridin
in
Human
Lung
Tumor
Xenografts
PLOS
ONE
|
www.ploson
e.org
9
August
2013
|
Volume
8
|
Issue
8
|
Table 5.List of glucose metabolism-related proteins identified in the large-scale experiment.
No. Accession Gene symbol Description Score
No. of unique
peptidesa Coverage(%)b log2
(T1/
C1)
log2(T2/
C2)
log2(T2/
C1)
log2(T1/
C2) Rvaluec sRd
T/C ratioe Mf
Glucose transporter GLUT-3
1 P11169 SLC2A3 Solute carrier family 2 1216 6 12.5 20.25 20.77 20.95 20.07 20.51 0.36 0.70
Conversion of glucose to myo-inositol
2 Q9NPH2 ISYNA1 Inositol-3-phosphate synthase 1 354 2 3.9 1.23 1.03 1.32 0.94 1.13 0.15 2.18
Conversion of glucose to sorbitol
3 P15121 AKR1B1 Aldose reductase 609 8 38.6 0.79 0.79 0.90 0.69 0.79 0.07 1.73
Glycogen synthesis
4 Q16851 UGP2 UTP-glucose-1-phosphate uridylyltransferase 343 3 10.8 0.35 1.07 0.63 0.79 0.71 0.26 1.64 +
5 P13807 GYS1 Glycogen [starch] synthase, muscle 147 2 4.3 0.51 20.29 20.04 0.25 0.11 0.30 1.08 +
6 P36871 PGM1 Phosphoglucomutase-1 179 3 8.2 0.93 0.61 0.70 0.85 0.77 0.12 1.71
7 Q96G03 PGM2 Phosphoglucomutase-2 324 4 10.5 0.90 0.46 0.22 1.13 0.68 0.36 1.60
Glycogen breakdown
8 P06737 PYGL Glycogen phosphorylase, liver form 565 6 9.3 0.43 1.25 0.63 1.05 0.84 0.32 1.79
9 P11216 PYGB Glycogen phosphorylase, brain form 518 5 9.7 20.02 0.14 0.07 0.06 0.06 0.06 1.04
10 P35573 AGL Glycogen debranching enzyme 109 1 1.1 0.16 20.47 20.47 0.16 20.16 0.32 0.90
aNumber of unique peptides: peptides that uniquely matched to the protein. bCoverage (%): percentage of protein sequence covered by assigned peptide matches. cRvalue was calculated by the protein abundance ratiosT1/C1,T2/C2,T2/C1andT1/C2.R~1
2log2
T1:T2 C1:C2
~1 2 log2
T1 C1
zlog2
T2 C2
h i
~1 2 log2
T2 C1
zlog2
T1 C2
h i
~1 4 log2
T1 C1
zlog2
T2 C2
zlog2
T2 C1
zlog2
T1 C2
h i
.
dsR: the standard deviation ofRvalues. s R~
ffiffiffiffiffiffiffiffiffiffiffiffiffiffiffiffiffiffiffiffiffiffiffiffiffiffiffiffiffiffiffiffiffiffiffiffiffiffiffiffiffiffiffiffiffiffiffiffiffiffiffiffiffiffiffiffiffiffiffi
1 2log2
C2 C1
h i2 z12log2
T2 T1
h i2
r
.
eT
/Cratio, the linear treatment to control ratio calculated by:T/Cratio = 2R.
fM: labeled with ‘‘
+’’ if the peptides matching this human protein also matched to mouse proteins. doi:10.1371/journal.pone.0070642.t005
Citreoviridin
in
Human
Lung
Tumor
Xenografts
PLOS
ONE
|
www.ploson
e.org
10
August
2013
|
Volume
8
|
Issue
8
|
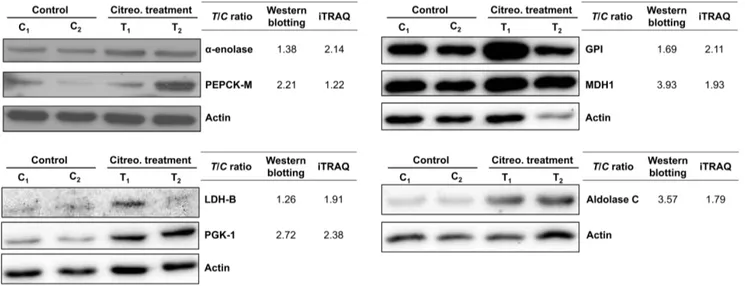
proteomic analysis by western blotting, and the protein expression levels of the enzymes were measured. Quantitation of the western blots showed that expressions of the seven glucose-metabolism-related proteins were all up-regulated in citreoviridin-treated tumor samples, which confirmed the results of the proteomic analysis (Figure 8). The up-regulation of both PEPCK-M and MDH1 also indicated the activation of gluconeogenesis in citreoviridin-treated tumors.
Discussion
Shotgun proteomics is a powerful strategy for large-scale studies of the proteome. However, the peptide-centric nature of it raises the protein inference problem and complicates the interpretation of the data [31]. A set of peptides might be assigned to multiple different proteins or protein isoforms, making the determination of protein identity ambiguous. In studies with xenograft models, tumor samples often contain both human and mouse cells and this complicates the protein inference problem. Many human and mouse proteins share a high degree of sequence homology, so it is hard to distinguish conserved human proteins from mouse proteins. The problem was also addressed and the assignment of human proteins was performed by the criteria of at least one peptide uniquely mapping to human entry [32]. Another similar method is searching the putative human peptides against the mouse sequence using BLAST and removing the peptides matching the mouse sequences [33,34]. A method combined searching the mouse database with BLAST and was also used to distinguished human proteins from mouse proteins [35]. Except the methods described above, most of the proteomic studies in xenograft models neglected to consider the protein inference problem of human and mouse proteins. In this study, we noticed the problem and adopted a more conservative strategy. For the protein identification step, the combined sequence database of the Swiss-Prot human database and Swiss-Prot mouse database was searched, and proteins matched only to human proteins or to both human and mouse ones were selected. Because we could not
exclude the possibility that double-matched proteins were of mouse-origin, the proteins were labeled in the protein identifica-tion table. By this way, proteins that may be of human-origin were not completely excluded and noting of this protein inference was retainable during the following analysis.
For protein quantitation, the intensities of iTRAQ signature ions should be normalized to diminish the global bias. We have tried seven methods of normalization (Method S1) and making the median of log2(peptide iTRAQ ratio) equal to zero is the best way
to minimize the errors. The optimal normalization method may depend on the structure of the dataset. For the calculation of protein abundance ratios, several algorithms and software tools are available [27] and there are three major algorithms used by the current software tools. ProteinPilot (AB Sciex, Foster, CA, USA), ProQuant (AB Sciex), Multi-Q [36], PEAKS (Bioinformatics Solutions Inc., Waterloo, ON, Canada) and MassTRAQ [37] apply the weighted average of peptide ratios; Phenyx (GeneBio, Geneva, Switzerland), VEMS [38] and Proteome Discoverer (Thermo Fisher Scientific, Waltham, MA, USA) apply the median of peptide ratios; Spectrum Mill (Agilent Technologies, Santa Clara, CA, USA) and Libra (Institute for Systems Biology, Seattle, WA, USA) apply the mean of peptide ratios as protein ratios. Mascot (Matrix Science) offers all the three major methods described above, while i-Tracker [39] only provide data in peptide level. We applied the sum of intensities in protein quantitation, which has similar idea as the weighted average. A previous study showed that compared to others, the sum of intensities (or the weighted average) provides lower errors, especially with the existence of outliers [40]. Besides, the sum of intensities has the advantage of being computationally simple. In this study, we provided the criteria for selecting peptides and a simple method for calculating protein abundance ratios. Furthermore, we proposed a robust workflow for selecting differentially expressed proteins by also considering measurement errors in experiments and individual variations among samples.
With the quantitative proteome, we found that citreoviridin-regulated proteins in lung cancer were associated with glucose
Figure 8. Citreoviridin induced the up-regulation of proteins catalyzing glucose metabolism.Protein expressions of seven proteins involved in glucose metabolism,a-enolase, PEPCK-M, GPI, MDH1, LDH-B, PGK-1 and aldolase C, were measured by western blotting. Actin was used as an internal loading control. The expression levels of two control tumors (C1and C2) and two citreoviridin-treated tumors (T1and T2) from a total of four different mice were quantified. The band intensities were normalized to actin, and the averages of intensities from two control samples and two treatment samples were calculated, respectively. Fold change of protein expression shown was obtained by dividing the intensity of control group by the intensity of treatment group. TheT/C(treatment to control) ratios from the iTRAQ large-scale experiment were listed for comparison. doi:10.1371/journal.pone.0070642.g008
Citreoviridin in Human Lung Tumor Xenografts
metabolism, especially gluconeogenesis and glycolysis. We identi-fied and quantiidenti-fied most of the enzymes involved in gluconeo-genesis and glycolysis processes (Figure 7B). The confidence for identification of these proteins was high so as to ensure the existence of these proteins in the samples (Table 4). Furthermore, the expression level of several proteins in the processes was significantly up-regulated with treatment of citreoviridin (Figure 7B), suggesting two possible results: the activation of gluconeogenesis or the activation of glycolysis. These two processes share almost the same set of enzymes except some catalyzing the irreversible reactions. We identified all eight enzymes shared by gluconeogenesis and glycolysis. All three enzymes catalyzing the irreversible steps in glycolysis were also identified, and we noticed that all of these enzymes were not up-regulated by citreoviridin. Regarding the major seven enzymes catalyzing the irreversible steps in gluconeogenesis, we identified and quantified three enzymes in our proteomic analysis, including PEPCK-M, MDH1 and mitochondrial malate dehydrogenase (MDH2). MDH1 was significantly up-regulated 1.93-fold with treatment of citreoviridin. Although the expression levels of MDH2 and PEPCK-M showed no significant up-regulation, these two enzymes had higher expression levels in citreoviridin-treated tumors than control tumors.
Is it possible that gluconeogenesis occurs in cancer cells when treated with citreoviridin? The whole proteomic profiling of control and citreoviridin-treated tumors may provide some hints. The expression level of several other proteins related to glucose metabolism was changed with citreoviridin treatment (Table 5). These proteins are involved in synthesis of glycogen from glucose, conversion of glucose to inositol or sorbitol (a sugar alcohol that the human body metabolizes slowly) and glucose transport. The expression levels of three enzymes, which convert glucose to other compounds, were higher in the citreoviridin-treated tumors. The first one is UTP-glucose-1-phosphate uridylyltransferase (UDP-glucose pyrophosphorylase, UDPGP), which catalyzes the reaction of converting glucose 1-phosphate to UDP-glucose, the immediate donor of glucose for glycogen synthesis. The second one is inositol-3-phosphate synthase 1 (IPS 1), which catalyzes the conversion of glucose 6-phosphate to 1-myo-inositol 3-phosphate. Third, aldose reductase reduces glucose to sorbitol, which accumulated in the cells in response to hyperosmotic stress that causes shrinkage of the cells [41,42]. Surplus glucose enters the polyol pathway by converting to sorbitol catalyzed by aldose reductase. From the above observations, glucose might be overproduced in cancer cells with treatment of citreoviridin. We also noticed that the expression level of glucose transporter GLUT-3 was lower (0.70-fold) with the treatment of citreoviridin, which indicated that excess glucose mainly came from gluconeogenesis.
Citreoviridin was shown to suppress lung adenocarcinoma growth by targeting ectopic ATP-synthase [23]. The observation of activated gluconeogenesis by citreoviridin in the proteomic profiling raised the question of whether there is a relationship between gluconeogenesis and inhibition of lung cancer cell proliferation. There are only limited literatures describing the effects of gluconeogenesis on cancer and most of them were reported in the 1970s. The role of gluconeogenesis in cancer cells can vary depending on the gluconeogenic precursors, including lactate, pyruvate, amino acids and other metabolites. It was suggested that gluconeogenesis from alanine is increased in cancer patients with cachexia, a syndrome with significant loss of appetite resulting in weakness and loss of weight [43,44]. A recent report showed that gluconeogenesis was down-regulated in hepatocellular carcinoma and the reduced gluconeogenesis may facilitate
tumorigenesis by accumulation of glucose 6-phosphate, the precursor for nucleotide synthesis [45].
The expression profile of proteomes in control and citreoviridin-treated tumors provides novel implications for understanding the antitumorigenic effect by activation of gluconeogenesis in cancer cells. First, the glucose synthesized could be converted intomyo -inositol, which has anti-cancer activity. We observed the up-regulation of the enzyme IPS 1 with treatment of citreoviridin (Table 5). This enzyme catalyzes the key rate-limiting step in the myo-inositol biosynthesis pathway. The level of myo-inositol was found to be higher in normal tissue compared to breast cancer tissue [46] but lower in lung tumors [47]. Besides,myo-inositol was shown to have anti-cancer activity by inhibiting tumor formation of colon, mammary, soft tissue and lung cancers. The phosphor-ylated myo-inositol, inositol hexaphosphate (IP6) was also
recog-nized for its effectiveness in cancer prevention [48]. IP6is able to
induce G1cell cycle arrest by modulating cyclins, CDKs, p27Kip1,
p21CIP1/WAF1, and pRb in prostate cancer and breast cancer [49– 52].
With the treatment of citreoviridin, the glucose synthesized from gluconeogenesis may also be converted to other compounds and escape from utilization by glycolysis. The reduction in glycolysis flux results in the decrease of glycolytic intermediates to sustain the continuous building blocks for macromolecular synthesis [12,13] and thereby inhibits the proliferation of cancer cells. We found that the expression level of aldose reductase that converts glucose to sorbitol was higher in citreoviridin-treated tumors (Table 5). The increased intracellular glucose results in its conversion to sorbitol. Although sorbitol entering the polyol pathway can be converted to fructose by sorbitol dehydrogenase, high glucose levels still favors the production of sorbitol.
Glucose synthesized from gluconeogenesis may also be polymerized into glycogen for storage. Thus, the decrease of glucose influx into glycolysis inhibits proliferation of cancer cells. A previous report showed that the expression level of UDPGP, activities of phosphoglucomutase (PGM) and glycogen synthase were all decreased in tumor tissues, so the defective glycogen synthesis process is unable to compete with glycolysis [53]. In our proteomic profiling data, we observed that the expression levels of PGM and UDPGP were higher with citreoviridin treatment in lung cancer (Table 5). Regarding glycogen breakdown, previous studies suggested that glycogen phosphorylase was expressed in tumor tissues and served as a target for anticancer therapy [54,55]. In our proteomic profiling data, we found that the glycogen phosphorylase liver form was up-regulated by citreoviridin. Why does there seem to be a contradiction between the expression levels of enzymes involved in glycogen synthesis and glycogen breakdown? In fact, glycogen synthase and glycogen phosphory-lase are both allosterically regulated by kinases and phosphatases, the activities of which are also post-translationally regulated. Therefore, the activities of glycogen synthase and glycogen phosphorylase in citreoviridin-treated tumors remain unknown. However, it is still possible that glucose from gluconeogenesis is converted into UDP-glucose in citreoviridin-treated lung cancer xenograft tumors.
individually. Based on the errors estimated, we calculated the cut-off values and selected 141 human proteins as differentially expressed. Bioinformatics analysis of the differentially expressed human proteins illustrated the enrichment of glucose metabolism-related processes. We found that citreoviridin may activate gluconeogenesis by up-regulation of the expression levels of gluconeogenic enzymes. Furthermore, the change in expression levels of other glucose metabolism-related enzymes may link gluconeogenesis to cell proliferation inhibition. This study helps to achieve a better understanding of the complexity of metabolic regulations and the plasticity of cancer cells, which may shed light on improvements to cancer therapy.
Materials and Methods
Reagents
Citreoviridin was obtained from Enzo Life Sciences (Farming-dale, NY, USA). Dimethyl sulfoxide (DMSO, cell culture grade) was purchased from AppliChem (Darmstadt, Germany). Optimal cutting temperature (O.C.T.) compound was obtained from Exibo Research (Taipei, Taiwan). 3,39-Diaminobenzidine was purchased from Kirkegaard & Perry Laboratories (Gaithersburg, MD, USA). Protease inhibitor was obtained from Bioman Scientific (Taipei, Taiwan). MatrigelTM was from BD Biosciences (Bedford, MA, USA). Glycerol was purchased from Scharlau (Barcelona, Spain). BCATM Protein Assay Reagent kit was obtained from Pierce (Rockford, IL, USA). Triethylammonium bicarbonate buffer (TEABC), tris(2-carboxyethyl)phosphine hydrochloride (TCEP), S-Methyl methanethiosulfonate (MMTS), N,N,N9,N9 -Tetramethy-lethylenediamine (TEMED), trifluoroacetic acid (TFA), Tween 20, anti-rabbit IgG-HRP and anti-mouse IgG-HRP were purchased from Sigma-Aldrich (St Louis, MO, USA). Acrylamide/bisacry-lamide (40%, v/v, 37.5:1) was obtained from Bioshop (Burlington, ON, Canada). Ammonium persulfate (APS, ACS grade) was from
Amresco (Solon, OH, USA). Acetonitrile (ACN) was obtained from Lab-Scan (Dublin, Ireland). Sequencing grade modified trypsin was purchased from Promega (Madison, WI, USA). iTRAQH Reagent kit (including iTRAQ Reagent 114, iTRAQ Reagent 115, iTRAQ Reagent 116, iTRAQ Reagent 117 and iTRAQ Dissolution buffer) was obtained from Applied Biosystems (Forster City, CA, USA). Ki67 antibody was purchased from Abcam (Cambridge, MA, USA). ENO1, PCK2, GPI, MDH1, PGK1, LDHB and ALDOC antibodies were purchased from GeneTex (Irvine, CA, USA). Anti-actin antibody clone 4 and Immobilon Chemiluminescent HRP substrate were from Milli-pore (Bedford, MA, USA).
Cell culture
The human lung adenocarcinoma cell line CL1-0 was kindly provided by Dr. Pan-Chyr Yang (Department of Internal Medicine, National Taiwan University Hospital, Taiwan) [56]. Cells were grown as previously described [56]. Briefly, cells were cultured in Dulbecco’s modified Eagle’s medium (Gibco, NY, USA) containing 10% fetal bovine serum (Gibco) at 37uC and 5% CO2.
Tumorigenicity assays in athymic mice
This study had been approved by the animal care and use committee of National Taiwan University (Permit Numbers: 97-47). All animal work was performed in accordance with NIH animal use guidelines.NOD.CB17-Prkdcscidfemale mice (4–5 weeks old) were purchased from National Taiwan University hospital and housed in an isolator and fedad libitumwith autoclaved food. For tumor growth in animals, 56106CL1-0 cells resuspended in 0.1 ml Hanks’ balanced salt solution (HBSS) were mixed with matrigel and injected subcutaneously into mice. The tumor masses were measured every two days and the tumor volume was calculated as 1/2 width26length in mm3. After tumor volumes
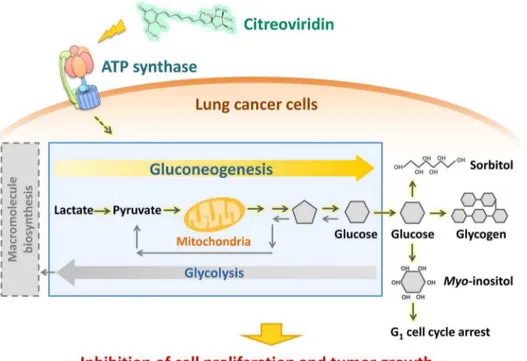
Figure 9. Citreoviridin affects the glucose metabolism in lung cancer xenograft tumors.Proteomic analysis of lung cancer xenograft tumors treated with citreoviridin indicated that differentially expressed proteins were involved in gluconeogenesis and the conversion of glucose to other compounds. The activation of these pathways may decrease glycolysis and thus cause the inhibition of cell proliferation and tumor growth. doi:10.1371/journal.pone.0070642.g009
Citreoviridin in Human Lung Tumor Xenografts
reached 100 mm3, animals were randomly assigned into two groups: those receiving intraperitoneal injection with the vehicle control (DMSO, N = 5) or the ATP synthase inhibitor (citreovir-idin, N = 4). The citreoviridin treatment (1 mg/kg) was adminis-tered three times a week to a final dosage of 12 mg/kg for 27 days. Tumor size was measured after treatment and the mice weights were monitored as a health indicator. Animals were sacrificed when the tumor volume of control animals reached 1000 mm3. At sacrifice, mice were anesthetized and cervical dislocation was performed. Tumors were excised and stored at280uC for further analysis. For immunohistochemistry, dissected organs and tumors were fixed in 10% paraformaldehyde.
Immunohistochemistry
Immunohistochemistry was performed with 3,39 -Diaminoben-zidine (DAB) as a detection agent. Cryostat sections prepared from O.C.T. compound embedded tissues were treated with blocking buffer (10% normal goat serum) to inhibit endogenous enzyme activity. Sections were then incubated with Ki67 antibody at 4uC overnight. A horseradish peroxidase containing polymer conju-gated with IgG antibody was applied at room temperature for 1 h. The enzymatic reaction was developed in freshly DAB solution as a chromogen for horseradish peroxidase. The sections were then counterstained with hematoxylin and mounted in xylene. The negative control, where the primary antibody was substituted with Tris-HCl buffer, was also included in each staining case.
Protein preparation
Tumor tissues were ground into a fine powder using a mortar and pestle in liquid nitrogen. Liquid nitrogen was added to the mortar frequently to ensure that the tissues did not thaw during grinding. Tissue power was then suspended in lysis buffer containing 1% (v/v) SDS, 50 mM Tris-HCl, 10% (v/v) glycerol and protease inhibitor. The amount of lysis buffer added was based on the amount of tissue powder. The solution containing tissue powder was resuspended by pipetting until there was almost no visible pellet. The sample solution was homogenized on ice using a homogenizer (LABSONICH M ultrasonic homogenizer; Sartorius AG, Go¨ttingen, Germany) with 60% amplitude, cycle = 0.6 (operated 0.6 s every 1 s) for 4–5 min. The lysate was centrifuged at 17,000g, 4uC for 30 min. The supernatant, which contained the crude extract proteins, was collected. The concentration of proteins was measured with the BCATMProtein Assay Reagent kit.
Reduction, alkylation and digestion of proteins
We followed the methods of a previous study by Han et al. for protein reduction, alkylation and digestion [57]. Equivalent amounts of proteins in control and treatment samples were used for further processing: 100mg/sample was used for the duplicate experiment, while 400mg/sample was used for the small-scale experiment and the large-scale experiment. Each sample was adjusted to have the same protein concentration by adding lysis buffer. We added 1 M TEABC to make the final concentration of 50 mM TEABC (pH was about 8.5) for every sample. Proteins were reduced by 5 mM TCEP in a dry bath at 37uC for 30 min and then alkylated by 2 mM MMTS at room temperature avoiding light for 30 min.
Next, we applied gel-assisted digestion for proteins. Acrylam-ide/bisacrylamide (40%, v/v, 37.5:1), 10% APS (w/v) and TEMED were mixed with the protein solution (protein solution: acrylamide/bisacrylamide: APS: TEMED = 14:5:0.3:0.3, v/v) to allow gel polymerization. The gel was cut into small pieces and washed with 25 mM TEABC and 25 mM TEABC/50% (v/v)
ACN several times. Briefly, buffer was added to the gel and then the solution was vortexed. The gel was further dehydrated with 100% ACN and dried completely with a centrifugal evaporator (CVE-2000; Eyela, Tokyo, Japan). 25 mM TEABC was added to rehydrate the gel and trypsin (protein: trypsin = 10:1, w/w) was subsequently added to the rehydrated gel. After ensuring the gel was fully covered by 25 mM TEABC, the sample was incubated at 37uC overnight (at least 16 h). Peptides were extracted from the gel with 0.1% (v/v) TFA, 50% (v/v) ACN/0.1% (v/v) TFA, and 100% ACN sequentially. Like the gel washing step, buffer was added to the gel and the gel solution was vortexed. The liquid part of the sample was collected and combined. The extracted peptide solution was dried with a sample concentrator (miVac Duo Concentrator; Genevac, Ipswich, UK).
iTRAQ labeling of peptides
The peptides were resuspended in iTRAQ Dissolution buffer. We confirmed that the solution was basic (about pH 8.5). The concentration of peptide was measured with the BCATMProtein Assay Reagent kit. For the duplicate experiment and small-scale experiment, 5mg of peptides from each sample were required for iTRAQ labeling. For the large-scale experiment, 150mg of peptides from each sample were required. Each vial (1 unit) of iTRAQ Reagent was brought to room temperature and dissolved in 70mL absolute ethanol by vortexing for 1 min. Equal amounts of peptides from different samples were labeled by adding iTRAQ Reagent 114, iTRAQ Reagent 115, iTRAQ Reagent 116, or iTRAQ Reagent 117, and vortexing at room temperature for 1 h. Labeled peptides were combined and dried with a centrifugal evaporator (CVE-2000; Eyela, Tokyo, Japan).
Strong cation exchange (SCX) chromatography
For the large-scale experiment, SCX chromatography was performed after iTRAQ labeling. The labeled peptides were resuspended in 2 mL buffer A (5 mM KH2PO4 and 25% (v/v)
ACN, pH 3) and fractioned by SCX chromatography. The peptide solution was subjected to a 2.16200 mm PolySUL-FOETHYL ATM column containing 5mm particles with 200 A˚ pore size (PolyLC, Columbia, MD, USA). A flow rate of 200ml/ min with a gradient of 0–25% buffer B (5 mM KH2PO4, 350 mM
KCl and 25% ACN (v/v), pH 3) for 30 min followed by a gradient of 25–100% buffer B for 20 min was applied for peptide elution. The eluate was monitored by the absorbance of the peptide bond at 214 nm, and fractions were collected every 1 min. Each fraction was dried with a sample concentrator (Savant SpeedVacH Plus SC210A Concentrator; Thermo Fisher Scientific).
ZipTip desalting
For the duplicate experiment and small-scale experiment, iTRAQ-labeled peptides were directly subjected to the desalting step. For the large-scale experiment, each fraction of peptides was desalted individually. We performed desalting using ZipTipH
Pipette Tips (Millipore, Bedford, MA, USA). Dried peptides were resuspended in 20–30mL of 0.1% (v/v) TFA, and 10% TFA was added to adjust the pH of the solution to about pH 2–3. The ZipTip was first wetted with 50% (v/v) ACN/0.1% (v/v) TFA and then equilibrated in 0.1% (v/v) TFA. The peptides were bound to the ZipTip by aspirating and dispensing the peptide solution for 20 cycles. Subsequently, the ZipTip was washed with 0.1% (v/v) TFA. At last, peptides were eluted with 20mL of 50% (v/v) ACN/ 0.1% (v/v) by aspirating and dispensing the eluate for 10 cycles. The eluate was dried with a centrifugal evaporator (CVE-2000; Eyela, Tokyo, Japan).
LC-MS/MS analysis
After ZipTip desalting, samples containing about 3mg peptides were reconstituted in 24mL buffer A (0.1% (v/v) formic acid (FA) in H2O) and analyzed by LC-ESI-Q-TOF mass spectrometry
(Waters SYNAPTH G2 HDMS; Waters Corp., Milford, MA, USA). Samples were injected into a 180mm62 cm capillary trap column and separated by a 75mm625 cm nanoACQUITY UPLCTM 1.7mm Ethylene Bridged Hybrid (BEH) C18 column using a nanoACQUITY Ultra Performance LCTM System (Waters Corp.). The column was maintained at 35uC. Buffer A was 0.1% FA in H2O and buffer B was 0.1% FA in ACN. Bound
peptides were eluted with a linear gradient of 6 to 50% buffer B at a flow rate of 300ml/min for 100 min. MS was operated in electrospray ionization sensitivity mode. NanoLockSprayTM source (Waters Corp.) was used for accurate mass measurements, and the lock mass channel was sampled every 30 s. The mass spectrometer was calibrated with a synthetic human [Glu1 ]-Fibrinopeptide B solution (1 pmol/ml; Sigma-Aldrich) delivered through the NanoLockSpray source. Data acquisition was performed using data directed analysis (DDA). The DDA method included one full MS scan (m/z350–1700, 1 s) and three MS/MS scans (m/z100–1990, 1.5 s for each scan) sequentially on the three most intense ions present in the full scan mass spectrum. Each sample was analyzed in duplicate.
Protein identification
The peak list resulting from MS/MS spectra was exported to mgf format by Mascot Distiller v2.3.2 (Matrix Science, London, United Kingdom) with charge state set to 2+, 3+, 4+, 5+, and other default parameters. Data files were merged and searched against the combined sequence database (containing 36,774 sequence entries) of the Swiss-Prot human database (April 2, 2012) and the Swiss-Prot mouse database (April 2, 2012) using Mascot search engine v2.3.02 (Matrix Science, London, United Kingdom). Search parameters for peptide and MS/MS mass tolerance were both 60.3 Da with allowance for two missed cleavages made from the trypsin digestion. Variable modifications of deamidated (NQ), oxidation (M), iTRAQ4plex (K), iTRAQ4-plex (N-term), and methylthio (C) were selected and none of the fixed modifications was selected. Peptide charge was set to Mr, instrument was set to ESI-QUAD-TOF and decoy database was searched. Mascot search results were filtered using ‘‘Significance threshold’’ set atP,0.05 and ‘‘Ions score or expect cut-off’’ set at 0.05. Only peptides with ion scores higher than the Mascot identity score (P,0.05) were confidently assigned. A protein hit required at least one ‘‘bold red’’ peptide match to have the most likely assignment. The peptide shown in ‘‘red’’ indicates the highest scoring match for the spectrum. When the peptide matched to the spectrum does not appear in any higher scoring protein, it is shown in ‘‘bold’’. Thus, the ‘‘bold red’’ match is the highest scoring match to a particular spectrum listed under the highest scoring protein containing that match. To evaluate the false discovery rate (FDR), we performed a decoy database search against a randomized decoy database created by Mascot using identical search parameters and validation criteria. FDR was calculated as D/R6100%, where D and R are the number of matches above identity threshold using the decoy and real databases, respectively.
Selecting peptides for quantitation
Mascot search results were exported in XML format and raw data files from Waters SYNAPTHG2 HDMS mass spectrometer were converted to mzXML format using massWolf (Institute for Systems Biology, Seattle, WA, USA). Data files in XML and
mzXML formats were analyzed using Multi-Q software (v1.6.5.4) [36] to detect signature ions (m/z= 114, 115, 116 and 117) and select peptides satisfying all the following four criteria: 1) the peptide is labeled with iTRAQ tags; 2) the peptide is considered as confidently identified (the peptide has ion score higher than the Mascot identity score (P,0.05)); 3) the peptide is unique (non-degenerate); 4) the iTRAQ signature ion peak intensity (ion count) of the peptide is within the dynamic range (the peak intensity of each iTRAQ signature ion must be.0, the average of the peak intensities of all iTRAQ signature ions must be $30). Only peptides satisfying the above four criteria were considered as qualified peptides and applied for further analysis. We ensured that the percentage of peptides indeed labeled with iTRAQ tags in every dataset was over 99%.
iTRAQ signal normalization
Before quantitation of the expression of each protein, we first normalized the peak intensity (ion count) of the iTRAQ signature ion (hereafter referred to as peptide iTRAQ signal), which was used for calculating protein abundance ratios. We have tried seven different normalization methods (Method 1 and 3–7 in Method S1) and chose the optimal normalization method (Method 2), as described below.
Each of the proteomic experiments performed in this study contained four different cell states, A, B, C, and D labeled with iTRAQ tags m/z= 114, 115, 116, and 117, respectively. For peptideiin cell state X, the original peptide iTRAQ ratiorXð Þi0is
calculated as follows:
rXð Þi0~
xi0
ai0
where xi0 and ai0 denote the original peptide iTRAQ signal
representing the abundance of peptide iin cell state X and A , respectively. The peptide iTRAQ ratio represents the relative peak intensity of the iTRAQ signature ionm/z114, 115, 116 or 117 to the iTRAQ signature ionm/z114.
Next, the original log2 peptide iTRAQ ratio of peptide i,
log2½rX(i)0is calculated.
The normalization is performed to make
MXði[IÞ~0
where MXði[IÞ denotes the median of the normalized log
2
peptide iTRAQ ratiolog2½rX(i)of all peptidesibelonging toIin
cell state X.I is the set containing all qualified peptides in the dataset, which satisfy the four criteria described above;rXð Þi is the
normalized peptide iTRAQ ratio calculated from the normalized iTRAQ peak intensityxi.
To achieve the above normalization, the normalized peptide iTRAQ signalxiis calculated as follows:
xi~xi0:NX
whereNXis the normalization factor, which is expressed as
NX~2{MX0
where MX0 denotes the median of log2½rX(i)0of all peptides i
belonging toI. Normalized peptide iTRAQ signals were used for calculating protein abundance ratios.
Citreoviridin in Human Lung Tumor Xenografts