Please cite this article as: Kalantar M, Khajali F & Yaghobfar A. 2016. Effect of cereal type and enzyme addition on performance, pancreatic enzyme activity, intestinal microflora and gut morphology of broilers. Poult. Sci. J. 4 (1): 63-71.
Poultry Science Journal
ISSN: 2345-6604 (Print), 2345-6566 (Online) http://psj.gau.ac.irEffect of Cereal Type and Enzyme Addition on Performance, Pancreatic Enzyme
Activity, Intestinal Microflora and Gut Morphology of Broilers
Kalantar M1,2, Khajali F2 & Yaghobfar A3
1Department of Animal Science, Qom Agriculture Research and Education Center, Agricultural Research Education and Extension Organization, Tehran, Iran
2Department of Animal Science, College of Agriculture, Shahrekord University, Shahrekord, Iran 3Department of Poultry Nutrition and Physiology, Animal Science Research Institute of Iran, Karaj, Iran
Poultry Science Journal 2016, 4 (1): 63-71
Introduction
Corn is considered as the main ingredient of poultry diet. However, increased demand for ethanol fuel products has shifted corn grain from animal nutrition to biofuel in the major
corn producing areas of the world. These two factors lead to the unprecedented rise of corn price for poultry nutrition (Donohue and Cunningham, 2009). Wheat and barley as Abstract
Keywords
Cereal Broiler Growth Enzyme Gut function
The effects of grain and carbohydrase enzyme supplementation were investigated on digestive physiology of chickens. A total of 625 one-day-old chicks (Ross 308) were randomly assigned to five treatments in a completely randomized design. Treatments included two different types of grains (wheat, and barley) with or without a multi-carbohydrase supplement. A corn-based diet was also considered to serve as a control. Feeding barley-based diet with multi-carbohydrase led to higher feed intake (P < 0.01) than those fed corn- and wheat-based diets. Birds fed on barley and wheat diets had lower weight gain despite a higher feed conversion ratio (P < 0.01). Total count and number of different type of bacteria including Gram-negative, E. coli, and Clostridia increased after feeding wheat and barley but the number of Lactobacilli and Bifidobacteria decreased (P < 0.01). Feeding barley and wheat diets reduced villus height in different parts of the small intestine when compared to those fed on a corn diet. However, enzyme supplementation of barley and wheat diets improved weight gain and feed conversion ratio and resulted in reduced number of E. coli and Clostridia and increased number of Lactobacilli and Bifidobacteria, and also restored the negative effects on intestinal villi height (P < 0.01). The
activities of pancreatic -amylase and lipase were (P < 0.01)
increased in chickens fed wheat and barley diets when compared to the control fed on a corn diet. Enzyme supplementation reduced the
activities of pancreatic -amylase and lipase (P < 0.01). In
conclusion, various dietary non-starch polysaccharides without enzyme supplementation have an adverse effect on digesta viscosity, ileal microflora, villi morphology, and pancreatic enzyme activity.
Corresponding author
Majid Kalantar [email protected]
Article history
alternative cereals could replace corn in poultry feed formulation and successfully grow in most areas with lower water requirement (Ravindran
et al., 1999; Lin et al., 2010).
After corn, other major energy sources for poultry diets are wheat and barley, but these two cereals have considerable amount of non-starch polysaccharides (NSPs) (Olukosi et al., 2007; Mirzaie et al., 2012), which impede the normal intestinal functions due to anti-nutritional factors (Jamroz et al., 2002). The content and structure of NSP polymers vary between different grains, which consequently affect the nutritive value of grains (Olukosi et al., 2007). The major NSPs of wheat are arabinoxylan polymers, whereas NSPs in barley comprises of polymers of (1→3)(1→4)- - glucans (Choct, 1997; Yin et al., 2000; Jamroz et al., 2002). It has been previously shown that combined multi-enzyme is required to degradation of NSPs in poultry diets for optimum digestion and performance (Ravindran et al., 1999; Olukosi et al., 2007; Slominski, 2011; Khajali and Slominski, 2012). Lower growth rate (Yin et al., 2000; Mirzaie et al., 2012), higher bacterial fermentative activity (Langhout et al., 1999; Olukosi et al., 2007), prevent the normal activity of intestinal enzymes (Zhao et al., 2007; Lin et al., 2010), and remodeling of gut enterocyte (Iji et al., 2001; Saki et al., 2011) are the main undesirable consequences due to NSPs.
Few researchers have shown the magnitude of the adverse effect of equal fractions of NSP from different sources (Ravindran et al., 1999; Yin et al., 2000; Lin et al., 2010).There is limited information on the efficacy of multi-carbohydrase supplements
under such circumstances. Therefore, in the present study, equal NSP fractions of wheat and barley were balanced in experimental diets supplemented with exogenous multi-enzyme to compare the impacts on growth, ileal microbial population, gut morphology, and pancreatic
enzyme activity of -amylase and lipase compared
to corn-based diet.
Materials and Methods
Animals, management, and treatments
A total of 625 one-day-old Ross-308 broiler chicks (initial weight 45±4 g) were randomly allocated to five treatments and five replicates with 25 chicks each. Each replicate was kept in a 1.5 × 2.2 m2 floor pen located in the animal science research institute of Karaj, Iran. Three experimental diets based on corn (control), wheat and barley were formulated for the starting (1 to 3 wk of age) and growing (3 to 6 wk of age) stages according to NRC (1994) recommendations. Two additional diets were prepared by supplementing exogenous multi- carbohydrases to the wheat- (Wheat + Enzyme) and barley- (Barley + Enzyme) based diets. The enzyme supplement (COMBO® enzyme blend produced by American Biosystem Co) contained 480 U/g multi-glycanase (including 200 U/g
xylanase, 200 U/g -glucanase, and 80 U/g
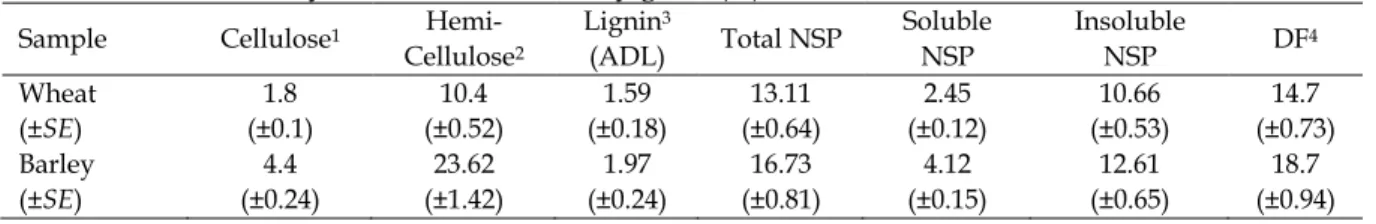
hemicellulase) and 1000 U/g phytase and was used at a level of 1 g/kg in the experimental diets. Wheat and barley samples were analyzed before the experiment for NSP constituents, depicted in Table 1 (AOAC, 2005).
Table 1. Chemical analysis of wheat and barley grain (%)
Sample Cellulose1
Hemi-Cellulose2
Lignin3
(ADL) Total NSP
Soluble NSP
Insoluble
NSP DF4 Wheat
(±SE)
1.8 (±0.1)
10.4 (±0.52)
1.59 (±0.18)
13.11 (±0.64)
2.45 (±0.12)
10.66 (±0.53)
14.7 (±0.73) Barley
(±SE)
4.4 (±0.24)
23.62 (±1.42)
1.97 (±0.24)
16.73 (±0.81)
4.12 (±0.15)
12.61 (±0.65)
18.7 (±0.94)
1Cellulose=ADF-ADL; 2Hemi-Cellulose=NDF-ADF; 3Lignin (ADL)=ADF-Cellulose; 4Dietary Fiber=Total NSP +ADL.
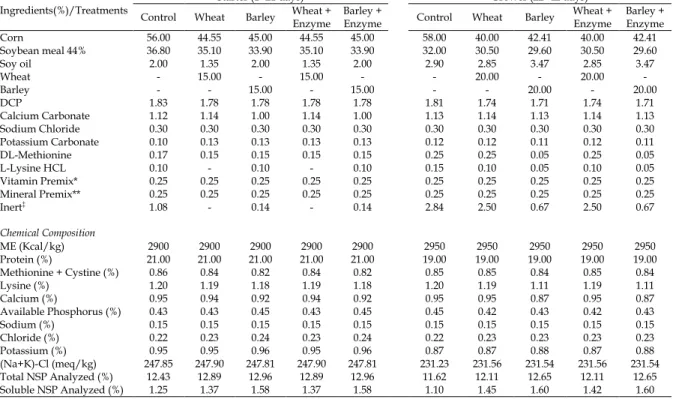
The composition of the experimental diets during the starting and growing stages is shown in Table 2. All diets were formulated to have the same contents of metabolizable energy, crude protein, and dietary electrolyte balance (DEB). Wheat- and barley-based diets were formulated to have equal fractions of soluble NSP.
Feed and water were provided with free
Table 2. Ingredients and chemical composition of diets during the starting and growing stages
Ingredients(%)/Treatments
Starter (1- 21 days) Grower (22- 42 days)
Control Wheat Barley Wheat + Enzyme Barley + Enzyme Control Wheat Barley Wheat + Enzyme Barley + Enzyme
Corn 56.00 44.55 45.00 44.55 45.00 58.00 40.00 42.41 40.00 42.41
Soybean meal 44% 36.80 35.10 33.90 35.10 33.90 32.00 30.50 29.60 30.50 29.60
Soy oil 2.00 1.35 2.00 1.35 2.00 2.90 2.85 3.47 2.85 3.47
Wheat - 15.00 - 15.00 - - 20.00 - 20.00 -
Barley - - 15.00 - 15.00 - - 20.00 - 20.00
DCP 1.83 1.78 1.78 1.78 1.78 1.81 1.74 1.71 1.74 1.71
Calcium Carbonate 1.12 1.14 1.00 1.14 1.00 1.13 1.14 1.13 1.14 1.13
Sodium Chloride 0.30 0.30 0.30 0.30 0.30 0.30 0.30 0.30 0.30 0.30
Potassium Carbonate 0.10 0.13 0.13 0.13 0.13 0.12 0.12 0.11 0.12 0.11
DL-Methionine 0.17 0.15 0.15 0.15 0.15 0.25 0.25 0.05 0.25 0.05
L-Lysine HCL 0.10 - 0.10 - 0.10 0.15 0.10 0.05 0.10 0.05
Vitamin Premix* 0.25 0.25 0.25 0.25 0.25 0.25 0.25 0.25 0.25 0.25
Mineral Premix** 0.25 0.25 0.25 0.25 0.25 0.25 0.25 0.25 0.25 0.25
Inert‡ 1.08 - 0.14 - 0.14 2.84 2.50 0.67 2.50 0.67
Chemical Composition
ME (Kcal/kg) 2900 2900 2900 2900 2900 2950 2950 2950 2950 2950
Protein (%) 21.00 21.00 21.00 21.00 21.00 19.00 19.00 19.00 19.00 19.00
Methionine + Cystine (%) 0.86 0.84 0.82 0.84 0.82 0.85 0.85 0.84 0.85 0.84
Lysine (%) 1.20 1.19 1.18 1.19 1.18 1.20 1.19 1.11 1.19 1.11
Calcium (%) 0.95 0.94 0.92 0.94 0.92 0.95 0.95 0.87 0.95 0.87
Available Phosphorus (%) 0.43 0.43 0.45 0.43 0.45 0.45 0.42 0.43 0.42 0.43
Sodium (%) 0.15 0.15 0.15 0.15 0.15 0.15 0.15 0.15 0.15 0.15
Chloride (%) 0.22 0.23 0.24 0.23 0.24 0.22 0.23 0.23 0.23 0.23
Potassium (%) 0.95 0.95 0.96 0.95 0.96 0.87 0.87 0.88 0.87 0.88
(Na+K)-Cl (meq/kg) 247.85 247.90 247.81 247.90 247.81 231.23 231.56 231.54 231.56 231.54
Total NSP Analyzed (%) 12.43 12.89 12.96 12.89 12.96 11.62 12.11 12.65 12.11 12.65
Soluble NSP Analyzed (%) 1.25 1.37 1.58 1.37 1.58 1.10 1.45 1.60 1.42 1.60
*Each kg of premix contained: 44000 IU A, 7200 IU D3, 440 mg E, 40 mg K3,70 mg B12, 65 mg B1, 320 mg B2, 290 mg Pantothenic acid, 1220 mg
Niacin, 65 mg B6, 22 mg Biotin, 270 mg Choline Chloride.
**Each kg of premix contained: 950 mg Mn, 450 mg Zn, 320 mg Fe, 100 mg Cu, 65 mg Se, 68 mg I and 45 mg Co.
‡Inert contained sand plus enzyme and enzyme supplementation included 1 kg per 1000 kg of diet for all treatments and contained 1000 active
units of Phytase and 480 active units of Multi-glycanase units per gram.
Measurements
Feed intake, weight gain, and feed to gain ratio were calculated for the 1-21 day, 22-42 day, and 1-42 day periods. At the end of the trial (42 days of age), three birds per pen (15 chickens from each treatment) were randomly selected and slaughtered. Intestinal microbiota was enumerated according to protocols from Langhout et al. (1999) with some modifications. In brief, aqueous digesta samples (3 mL) were taken from the distal segment of ileum and immediately transferred to sterile bottles containing 15 mL of anaerobic transport medium (TRM; pH=7.0), then weighed and stored at 4oC for further examination. Samples were homogenized and 1 mL of each sample was serially diluted 10- fold. An aliquot (0.1 mL) of each diluted sample was then cultivated on specific media and transferred to an incubator set at 37oC for 24 hrs. At the end of incubation period, bacterial colonies were counted. Specific media (described below) were used to culture different types of bacteria including Nutrient Agar (NA) for total bacterial count, Eosin Methylene Blue (EMB) Agar for Gram-negative
bacteria, MacConkey Agar (MCA) for coliforms, Rogosa Agar (RA) for lactic acids, Eugon Agar (EA) for bifidobacteria, and Reinforced Clostridial Agar (RCA) for clostridium bacteria.
reported by Saki et al. (2011). The mean of 10 measures per section was used for the analysis.
Digesta samples were obtained from selected birds to measure intestinal pH and viscosity. Ileal digesta were individually collected, homogenized at 4°C, and immediately measured for pH and viscosity (Brookfield viscometer, Model DV-II, MA, USA) according to Langhout
et al. (1999). Pancreas was harvested to measure
the activities of α-amylase and lipase enzymes. Sample sections (3 cm in length) were taken from the middle of the pancreas, rinsed with 0.01 M PBS (pH=7.2), and stored in liquid nitrogen at -80°C until analysis. The pancreatic samples were homogenized in ice-cold 0.2 mol/L Tris - HCl buffer and 0.05 mol/L NaCl as described by Li et al. (2004). The homogenates were centrifuged at 3000 × g for 15 min at 4°C and the supernatants were used for enzyme assay. The activity of -amylase (EC 3.2.1.1) was determined using a validated kit from Parsazmun Chemical Company (Parsazmun Co., Karaj, Iran TS.M.91.4.5). The activity of lipase (EC 3.1.1.3) was measured by a validated kit from ZiestChem Chemical Company (ZiestChem Co., Tehran, Iran Ver. Lipase. 10558). Total protein (g/dL) of samples was
performed using a validated kit from Parsazmun Chemical Company (Parsazmun Co., Karaj, Iran TS.M.91.45.4) according to the manufacturer’s instruction. The activities of amylase and lipase are expressed as unit per milligram of pancreatic protein content.
Statistical Analyses
The results were statistically analyzed by GLM procedure of SAS software (SAS Institute Inc., 2003). The statistical scheme was based on completely randomized design (CRD). Samples within pens (3 per each unit) were subjected to analysis. The statistical model used for growth data was Yij= µ+ Ti + eij and for sampling observation within pens was Yijk = µ+ Ti + eij + Seijk where Yij and Yijk are observations; µ is the overall mean; Ti is the effect of treatments (different diets); eij is random error, and eijk is the
effect of sampling error. Duncan’s multiple range
tests were used to separate the means.
Results
Growth performance
Table 3 depicts the results of feed intake, bodyweight, and feed conversion ratio of chickens during 1 to 21 and 22 to 42 days of the trial.
Table 3. Effect of different types of cereal grains and enzyme supplementation on broiler growth performance
Dietary treatments Feed intake (g/bird/day)
Weight gain (g/bird/day)
FCR (g/g) During 1-21 days
Corn (Control) 45.90a 37.10a 1.24 ab
Wheat 41.50b 32.80b 1.27 a
Wheat + Enzyme 45.20a 38.50a 1.17 b
Barley 43.20b 33.70b 1.28 a
Barley + Enzyme 45.10a 38.20a 1.18 b
SEM 1.11 1.03 0.03
P-value 0.001 0.001 0.001
During 22-42 days
Corn (Control) 147.40 a 67.90a 2.17 ab
Wheat 133.70c 61.10c 2.19 ab
Wheat + Enzyme 138.90b 63.20bc 2.20 a
Barley 142.40ab 64.50b 2.21 a
Barley + Enzyme 144.10a 67.40a 2.14 b
SEM 3.23 1.05 0.03
P-value 0.007 0.002 0.001
During 1-42 days
Corn (Control) 92.70a 52.50a 1.77b
Wheat 87.60c 46.90b 1.86ab
Wheat + Enzyme 92.10b 50.40ab 1.83ab
Barley 93.80ab 49.10ab 1.91a
Barley + Enzyme 95.10a 51.30a 1.85ab
SEM 2.19 1.25 0.08
P-value 0.006 0.001 0.001
Birds fed wheat significantly reduced feed intake compared to other dietary treatments, but supplementation with multiple carbohydrases to this diet remarkably restored feed intake so that the difference was insignificant with the control group fed on corn. On the other hand, birds fed wheat or barley had lower feed intake than other treatments but multiple carbohydrase supplement significantly increased feed intake compared to the corn diet. Nevertheless, birds fed
barley and wheat diets had a significantly lower weight gain but a higher FCR than chickens on corn diets. Enzyme supplementation of barley and wheat diets improved FCR (P < 0.01).
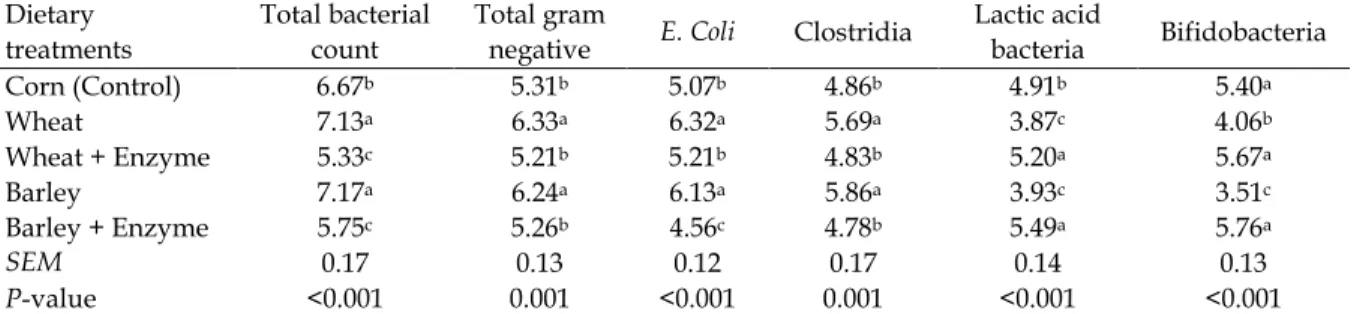
Intestinal microbial and gut morphology Total bacterial population and Gram-negative count including E. coli and clostridia in the intestinal content were higher in birds fed wheat and barley than the control (P < 0.01) (Table 4).
Table 4. Effect of different types of cereal grains and enzyme supplementation on ileal bacterial population in broiler chickens (log CFU/g digesta)
Dietary treatments
Total bacterial count
Total gram
negative E. Coli Clostridia
Lactic acid
bacteria Bifidobacteria Corn (Control) 6.67b 5.31b 5.07b 4.86b 4.91b 5.40a
Wheat 7.13a 6.33a 6.32a 5.69a 3.87c 4.06b
Wheat + Enzyme 5.33c 5.21b 5.21b 4.83b 5.20a 5.67a
Barley 7.17a 6.24a 6.13a 5.86a 3.93c 3.51c
Barley + Enzyme 5.75c 5.26b 4.56c 4.78b 5.49a 5.76a
SEM 0.17 0.13 0.12 0.17 0.14 0.13
P-value <0.001 0.001 <0.001 0.001 <0.001 <0.001
a-cMeans with different superscript letters within columns have a significant difference (P < 0.01).
On the other hand, the number of lactic acid bacteria and bifidobacteria were significantly lower in birds fed wheat and barley diets compared to the control. The inclusion of the multiple carbohydrases to the wheat and barley diets caused changes in gut microflora so that the number of lactic acid bacteria and bifidobacteria were significantly increased. Meanwhile, no significant differences were found between the enzyme-supplemented wheat and barley diets as well as the corn diet. Intestinal morphometric indices including villus height and width, as well as crypt depth of the duodenum, jejunum, and ileum were determined (Table 5).
Villus height of the three intestinal segments was lower but villus width and crypt depth were higher in birds fed wheat and barley than the control or enzyme supplemented diets (P < 0.01). On the other hand, the villus height: width and villus height: crypt depth ratios were significantly lower (P < 0.01) in birds that received wheat and barley diets compared to the control or enzyme supplemented diets. Inclusion of the multiple carbohydrases to the wheat and barley diets restored the situation so that no significant difference was found between the wheat and barley diets supplemented with the multi-enzyme and the corn diet.
Digesta pH, digesta viscosity and pancreatic enzyme activity
Digesta viscosity of chicks fed wheat and barley were significantly (P < 0.01) higher than a control group fed on corn (Table 6). Inversely, digesta pH of chicks fed wheat and barley were significantly lower than the control group (P < 0.01). Pancreatic -amylase and lipase activity of chicks fed wheat and barley were significantly (P < 0.01) increased compared to the control group fed on corn. Supplementation of carbohydrase enzyme mixture to the wheat and barley diets significantly reduced the digesta viscosity and activities of -amylase and lipase (Table 6).
Discussion
Consequently, birds fed wheat diet had lower body weight gain compared to those fed barley, corn or enzyme supplemented diets, primarily due to the differences in NSP constituent, the size of molecules, and the degree of digestion which can affect digesta viscosity and passage rate of gut content (Choct, 1997; Choct et al., 2006). The growth performance data are
consistent with the digesta pH, digesta viscosity and pancreatic enzyme activity as depicted in Table 6. These observations indicated that every change in the gut environment due to different dietary NSP sources could affect the physicochemical properties of the intestinal and consequently performance and/or physiology of birds.
Table 5. Effect of different types of cereal grains and enzyme supplementation on gut morphology at three parts of intestine in chickens
Duodenum Dietary treatments
H/CD ratio5
H/W ratio4
CD3 (µm)
VW2 (µm)
VH1 (µm)
14.39a 13.31a 108.33c 115.00c 1530.33ab Corn (Control) 11.86b 11.33b 114.67b 120.00b 1360.00c Wheat 15.44a 13.49a 108.00c 123.67ab 1668.00a
Wheat + Enzyme
12.10b 12.31ab 119.00a 117.00c 1440.04b Barley 14.59a 12.68ab 109.00c 125.33a 1589.82ab
Barley + Enzyme
0.52 0.54 2.39 2.18 63.80 SEM <0.001 <0.001 0.001 0.003 0.001 P-value Jejunum 11.61ab 9.18a 109.67b 138.67b 1273.67a Corn (Control) 10.26ab 7.93b 116.00a 150.00a 1190.00ab Wheat 12.01a 9.54a 108.00b 136.00b 1297.00a
Wheat + Enzyme
9.29b 8.20ab 110.33b 125.00c 1025.23b Barley 12.54a 8.83ab 95.00c 135.00b 1191.33ab
Barley + Enzyme
0.97 0.61 4.72 3.14 69.62 SEM <0.001 <0.001 0.005 0.001 0.001 P-value Ileum 12.50a 14.94a 105.00b 87.00d 1285.33ab Corn (Control) 9.88b 8.68c 115.00a 128.33b 1140.67b Wheat 12.61a 13.33ab 109.67ab 102.67c 1408.00a
Wheat + Enzyme
10.25b 8.23c 114.33a 142.33a 1172.00b Barley 12.12a 12.22b 108.00ab 107.00c 1308.00a
Barley + Enzyme
0.69 0.71 3.14 3.88 67.67 SEM <0.001 <0.001 0.002 0.001 0.001 P-value
a-cMeans with different superscript letters within columns have a significant difference (P < 0.01).
1 Villus Height, 2 Villus Width, 3 Crypt Depth, 4 Villus Height to Villus Width ratio, 5 Villus Height to Crypt Depth ratio.
Table 6. Effects of different types of cereal grains and enzyme supplementation on digesta pH, digesta viscosity, and pancreatic enzyme activity in chickens
Dietary treatments Digesta Viscosity (CP1)
Digesta pH
pancreatic enzyme activity (U/mg CP) 2
-amylase Lipase
Corn (Control) 1.59c 6.89a 0.71c 0.24b
Wheat 2.17a 5.93b 1.37a 0.42a
Wheat + Enzyme 1.60b 6.39a 0.88b 0.28b
Barley 1.95a 5.67b 1.43a 0.42a
Barley + Enzyme 1.60b 6.41a 0.91b 0.26b
SEM 0.04 0.16 0.06 0.03
P-value 0.005 0.001 0.001 0.005
a-cMeans with different superscript letters within columns have a significant difference (P < 0.01). 1 centipoise; 2 Units of enzymes per one milligram of pancreatic crude protein.
Birds fed wheat had the greatest viscosity of intestinal digesta, which was significantly (P < 0.01) greater than the control group fed corn.
anaerobic and Gram-negative bacteria as observed in this study. These conditions lead to increased production of volatile fatty acids which could decrease digesta pH due to production of short chain fatty acids in the lumen. These observations are in line with Jaroni
et al. (1999) and Langhout et al. (1999). Stagnant
intestinal digesta and low oxygen conditions due to non-degradable NSP provide a quiet environment for fermentative anaerobic bacteria proliferation (Langhout et al., 1999). Reduction in nutrient availability and production of detrimental by-products can result in microbial changes in the gut (Choct et al., 2006). The water soluble fraction of wheat and barley NSPs has a deleterious impact on intestinal physicochemical properties and microbial proliferation of chickens (Choct, 1997; Choct et al., 2006). Results of this experiment also indicate that NSP polymers of wheat and barley decreased the population of lactic acid bacteria and Bifidobacteria in the intestinal digesta. These bacteria are associated with beneficial effects on birds and are known as probiotic growth promotants. The impaired live performance of birds fed on wheat and barley can partly be explained by a decrease in population of Gram-positive bacteria including Lactobacilli and Bifidobacteria. The probiotic-type bacteria modulate innate immune system of the host animal (Christensen et al., 2002) and they are necessary for the development of gut-associated lymphoid tissue (GLUT) (Rhee et al., 2005).
The negative effects of NSP on the proliferation of bacteria in the intestine were significantly ameliorated after supplementation of wheat and barley diets with exogenous multiple enzymes (especially on probiotic-type bacteria). These results are in agreement with previous reports (Yin et al., 2000; Choct et al., 2006; Mirzaie et al., 2012). Degradation of NSP of wheat and barley by carbohydrases has been successful and promising in broilers (Olukosi et al., 2007; Slominski, 2011). Glycanase enzymes
including xylanases and - glucanases release
the encapsulated nutrients and reduce digesta viscosity. These processes are further facilitated by the action of phytases (Ravindran et al., 1999; Olukosi et al., 2007). As birds do not possess endogenous glycanases to degrade NSP, the application of exogenous NSP-degrading enzymes seems to be necessary when wheat and barley replace corn.
Reduced villus height, and in contrast, increased villus width and crypt depth can result from an increase in digesta viscosity. This leads to quick changes in the intestinal mucosa due to the proximity of the mucosal surface to the intestinal viscose content (Saki et al., 2011). The crypt can act as villus factory and a large crypt indicates a fast tissue turnover and a high demand for new tissue. Therefore, the addition of a viscose matter (such as NSP) to the diet can produce deeper crypts with a high rate of cell proliferation and tissue renewal (Iji et al., 2001). Therefore the shorter villus height induced by wheat and barley diets is related to NSP viscosity and is associated with a reduction in absorptive potential through the intestine, further growth efficiency, and normal physiological conditions (Saki et al., 2011).
Pancreas -amylase and lipase activities of broiler chickens were significantly increased in birds fed wheat and barley diets compared to those fed a corn diet or a wheat and barley diet supplemented with enzymes. This finding reflects the fact that water-soluble NSP of wheat and barley impede pancreatic -amylase and lipase activities (Li et al., 2004). This finding may indicate needs for greater secretion of pancreatic enzymes (Williams, 1996; Denbow, 2000). Intestinal enzyme activity depends on the source of dietary nutrient, quantity and/or quality of anti-nutrients in the gut (Li et al., 2004; Mirzaie et al., 2012). Diet type also affects the rate of secretion from the pancreas. Diets with high in fat or carbohydrates increase the secretion rate and serum concentration of amylase and lipase (Brenes et al., 1993; Zhao et al., 2007; Lin et al., 2010). Amylase is secreted in saliva, intestinal fluid, and pancreatic juices while lipase is secreted in stomach and pancreatic juices (Denbow, 2000). In normal conditions, pancreas-derived amylase and lipase contribute a small portion of serum enzymes, but with abnormal conditions such as a change in diet cereal type and anti-nutritional factors, acute pancreatitis and leakage of enzymes can occur, increasing the total serum concentration of enzymes (Williams, 1996).
Conclusion
barley have adverse effects on digesta viscosity, villi morphology and bacterial population of the gut and subsequent transmission of hydrolyzed products to the enterocyte cells and nutrient absorption. NSP polymers of wheat and barley increase the pancreatic activities of -amylase and lipase. Such changes are remarkably restored by
supplementing NSP-degrading enzymes to broiler diets.
Acknowledgment
Authors appreciate financial support of the Iran National Sciecnes Foundation Sciences (INFS) deputy of presidency.
References
AOAC (Association of Official Analytical Chemists). 2005. Official Methods of Analysis of the Association of Analytical Chemists International, 18th ed., 1st Suppl. Gaithersburg, MD U.S.A. [Link]
Brenes A, Smith M, Guener W & Marquardt RR. 1993. Effect of enzyme supplementation on the performance and digestive tract size of broiler chickens fed wheat and barley based diets. Poultry Science, 72: 1731-1739. [Link] Choct M. 1997. Feed non-starch polysaccharides:
chemical structures and nutritional significance. Journal of Feed Milling International. June Issue, pp. 13-26. [Link] Choct M, Sinlae M, Al-Jassim RAM& Pettersson,
D. 2006. Effects of xylanase supplementation on between-bird variation in energy metabolism and the number of Clostridium perfringens in broilers fed a wheat-based diet. Australian Journal of Agriculture Research, 57: 1017-1021. [Link]
Christensen HR, Frokiar H & Pestka JJ. 2002. Lactobacilli differentially modulate expression of cytokines and maturation surface markers in murine dendritic cells. Journal of Immunology, 168: 171- 178. [Link] Denbow DM. 2000. Gastrointestinal anatomy
and physiology. In: Sturkie’s avian
physiology, 5th ed. Academic Press, San Diego. pp, 299-325. [Link]
Donohue M & Cunningham DL. 2009. Effects of grain and oilseed prices on the costs of US poultry production. Journal of Applied Poultry Research, 18: 325- 337. [Link]
Iji PA, Saki AA& Tivey DR. 2001. Intestinal development and body growth of broiler chicks on diets supplemented with non-starch polysaccharides. Journal of Animal Feed Science and Technology, 89: 175-188. [Link]
Jamroz D, Jacobsen K, Bach Knudsen KE, Wiliczkiewicz A & Orda J. 2002. Digestibility and energy value of non-starch
polysaccharides in young chickens, ducks and geese, fed diet containing high amount of barley. Journal of Comparative Biochemistry and Physiology, 131: 657-668. [Link]
Jaroni D, Scheideler SE, Beck MM & Wyatt C. 1999. The effect of dietary wheat middling and enzyme supplementation. II: Apparent nutrient digestibility, digestive tract size, gut viscosity and gut morphology in two strains of leghorn hens. Poultry Science, 78: 841-847. [Link]
Khajali F & Slominski BA. 2012. Factors that affect the nutritive value of canola meal for poultry. Poultry Science, 91: 2564- 2575. [Link]
Langhout DJ, Schutte JB, Van Leeuwen P, Wiebenga J & Tamminga S. 1999. Effect of dietary high-and low-methylated citrus pectin on the activity of the ileal micro flora and morphology of the small intestinal wall of broiler chicks. Journal of British Poultry Science, 40: 340-347. [Link]
Li WF, Feng J, Xu ZR & Yang CM. 2004. Effects of non-starch polysaccharides enzymes on pancreatic and small intestinal digestive enzyme activities in piglet fed diets containing high amounts of barley. World Journal of Gastroenterology, 10: 856-859. [Link]
Lin PH, Shih BI & Hsu JC. 2010. Effects of different source of dietary non-starch polysaccharides on the growth performance, development of digestive tract and activities of pancreatic enzymes in goslings. British Poultry Science, 51: 270-277. [Link]
NRC (National Research Council). 1994. Nutrient Requirements of Poultry. 9th Rev.
Ed. National Academy
Press. Washington, DC. 176 Pages. [Link] Olukosi OA, Cowieson AJ & Adeola O. 2007.
Age-related influence of a cocktail of xylanase, amylase, and protease or phytase individually or in combination in broilers. Poultry Science, 86: 77-86. [Link]
Ravindran V, Selle PH & Bryden WL. 1999. Effects of phytase supplementation, individually and in combination, with glycanase, on the nutritive value of wheat and barley. Poultry Science, 78: 1588-1595. [Link]
Rhee KJ, Jasper PJ, Sethupathi P, Shanmugam N, Lanning D & Knight KL. 2005. Positive selection of the peripheral B cell repertoire in gut-associated lymphoid tissues. Journal of Experimental Medicine, 201: 55-62. [Link] Saki AA, Hematti Matin HR, Zamani P,
Tabatabai MM. and Vatanchian, M. 2011. Various ratios of pectin to cellulose affect intestinal morphology, DNA quantitation,
and performance of broiler chickens. Journal of Livestock Science, 139: 237-244. [Link] SAS (Statistical Analysis System). 2003.
SAS/STAT® 9.1. User's Guide. SAS Institute Inc. Cary, North Carolina. [Link]
Slominski BA. 2011. Recent advances in research on enzymes for poultry diets. Poultry Science, 90: 2013-2023. [Link]
Williams DA. 1996. The pancreas. In:
Strombeck’s small animal gastroenterology.
3rd ed. Saunders, Philadelphia. pp, 381-410. [Link]
Yin YL, Baidoo SK & Boychuk JLL. 2000. Effect of enzyme supplementation on the performance of broilers fed maize, wheat, barley or micronized dehulled barley diets. Journal of Animal Feed Science and Technology, 9: 493-504. [Link]