ACPD
15, 6337–6372, 2015NOx emission
estimates during the 2014 Youth Olympic
Games in Nanjing
J. Ding et al.
Title Page
Abstract Introduction
Conclusions References
Tables Figures
◭ ◮
◭ ◮
Back Close
Full Screen / Esc
Printer-friendly Version Interactive Discussion
Discussion
P
a
per
|
Discussion
P
a
per
|
Discussion
P
a
per
|
Discussion
P
a
per
|
Atmos. Chem. Phys. Discuss., 15, 6337–6372, 2015 www.atmos-chem-phys-discuss.net/15/6337/2015/ doi:10.5194/acpd-15-6337-2015
© Author(s) 2015. CC Attribution 3.0 License.
This discussion paper is/has been under review for the journal Atmospheric Chemistry and Physics (ACP). Please refer to the corresponding final paper in ACP if available.
NO
x
emission estimates during the 2014
Youth Olympic Games in Nanjing
J. Ding1,2, R. J. van der A1, B. Mijling1, P. F. Levelt1,2, and N. Hao3
1
Royal Netherlands Meteorological Institute (KNMI), De Bilt, the Netherlands
2
Delft University of Technology, Delft, the Netherlands
3
German Aerospace Center (DLR), Oberpfaffenhofen, Germany
Received: 12 February 2015 – Accepted: 23 February 2015 – Published: 4 March 2015
Correspondence to: J. Ding ([email protected])
ACPD
15, 6337–6372, 2015NOx emission
estimates during the 2014 Youth Olympic
Games in Nanjing
J. Ding et al.
Title Page
Abstract Introduction
Conclusions References
Tables Figures
◭ ◮
◭ ◮
Back Close
Full Screen / Esc
Printer-friendly Version Interactive Discussion
Discussion
P
a
per
|
Discussion
P
a
per
|
Discussion
P
a
per
|
Discussion
P
a
per
|
Abstract
The Nanjing Government has taken temporary environmental regulations to guaran-tee good air quality during the Youth Olympic Games (YOG) in 2014. We study the effect of those regulations by applying the emission estimate algorithm DECSO (Daily Emission estimates Constrained by Satellite Observations) to measurements of the
5
Ozone Monitoring Instrument (OMI). We improved DECSO by updating the chemical transport model CHIMERE from v2006 to v2013 and by adding an Observation minus Forecast (OmF) criterion to filter outlying satellite retrievals due to high aerosol concen-trations. The comparison of model results with both ground and satellite observations indicates that CHIMERE v2013 is better performing than CHIMERE v2006. After
filter-10
ing the satellite observations with high aerosol loads that were leading to large OmF values, unrealistic jumps in the emission estimates are removed. Despite the cloudy conditions during the YOG we could still see a decrease of tropospheric NO2 column concentrations of about 32 % in the OMI observations as compared to the average NO2
concentrations from 2005 to 2012. The results of the improved DECSO algorithm for
15
NOxemissions show a reduction of at least 25 % during the YOG period. This indicates that air quality regulations taken by the local government were successful. The algo-rithm is also able to detect an emission reduction of 10 % during the Chinese Spring Festival. This study demonstrates the capacity of the DECSO algorithm to capture the change of NOxemissions on a monthly scale. We also show that the observed
concen-20
trations and the derived emissions show different patterns that provide complimentary information. For example, the Nanjing smog episode in December 2013 led to a strong increase in NO2 concentrations without an increase in NOx emissions. Furthermore,
DECSO gives us important information of the non-trivial seasonal relation between NOxemissions and NO2concentrations on a local scale.
ACPD
15, 6337–6372, 2015NOx emission
estimates during the 2014 Youth Olympic
Games in Nanjing
J. Ding et al.
Title Page
Abstract Introduction
Conclusions References
Tables Figures
◭ ◮
◭ ◮
Back Close
Full Screen / Esc
Printer-friendly Version Interactive Discussion
Discussion
P
a
per
|
Discussion
P
a
per
|
Discussion
P
a
per
|
Discussion
P
a
per
|
1 Introduction
Reducing air pollution is one of the biggest environmental challenges currently in China. Nearly 75 % of urban areas are regularly polluted in a way that is considered un-suitable for their inhabitants in 2004 (Shao et al., 2006). In mega cities and their imme-diate vicinities, air pollutants exceed the Chinese Grade-II standard (80 µg m−3for daily
5
NO2) on 10–30 % of the days (Chan and Yao, 2008). Air pollution is directly related to
the economic growth in China and its accompanying increase of energy consumption. In the last two decades, air pollutants persistently increased in China. For instance, satellite measurements showed that NO2 concentrations increased about 20 % year−
1
from 1996 to 2005 (van der A et al., 2006). By combining satellite observations with air
10
quality models, Itahashi et al. (2014) showed that the strong increase of NO2
concen-trations over East China is caused by a doubling of NOx(NOx=NO+NO2) emissions
during 2000 to 2010. Zhang et al. (2007) found that NOx emissions increased with 70 % between 1995 and 2006 and Lamsal et al. (2011) found that anthropogenic NOx
emissions increased with 18.8 % during the period 2006 to 2009.
15
Nanjing, the capital of Jiangsu Province, is a highly urbanized and industrialized city located in East China, in the northwest part of the Yangtze River Delta (YRD). By 2012, the area of Nanjing had a population of 8.2 million (Nanjing statistical Bureau, 2013). The YRD is one of the largest economic and most polluted regions in China. Tu et al. (2007) found that the largest fraction of air pollution by NOx and SO2 can be
20
attributed to local sources in Nanjing. Li et al. (2011) concluded that air pollutant con-centrations and visibility demanded urgent air pollution regulations in the YRD region. From 16 to 29 August 2014, the Youth Olympic Games (YOG) was held in Nanjing. To guarantee good air quality during the Games, the city government carried out tempo-rary strict environmental regulations with 35 directives from May to August. Other cities
25
ACPD
15, 6337–6372, 2015NOx emission
estimates during the 2014 Youth Olympic
Games in Nanjing
J. Ding et al.
Title Page
Abstract Introduction
Conclusions References
Tables Figures
◭ ◮
◭ ◮
Back Close
Full Screen / Esc
Printer-friendly Version Interactive Discussion
Discussion
P
a
per
|
Discussion
P
a
per
|
Discussion
P
a
per
|
Discussion
P
a
per
|
Also for previous major international events in China, local authorities have tried to comply the air quality standards of the World Health Organization (WHO), which has a limit of 200 µg m−3 for hourly NO2 concentrations. For each event, the local
gov-ernment imposed restrictions on heavy industry, construction and traffic. In 2008 the Beijing Municipal Government implemented a series of air pollution control measures
5
for Beijing and surrounding cities to guarantee good air quality for the 29th Olympic Games. These control measures significantly reduced the emissions and concentra-tions of pollutants. Satellite data show the NO2column concentrations decreased with
at least 40 % compared to previous years (Mijling et al., 2009; Witte et al., 2009). Both bottom-up and top-down emission estimates show a decrease of about 40 % in NOx
10
emissions (Wang et al., 2009, 2010; Mijling et al., 2013). During the 2010 World Expo in Shanghai the NO2concentration was reduced by 8 % from May to August according to
an analysis of Hao et al. (2011) of space-based measurements compared to previous years. In November 2010 emission reduction measures introduced by the Guangzhou authorities also successfully improved air quality for the Asian Games. Wu et al. (2013)
15
claimed a NOx emission reduction of 43.5 % based on mobile DOAS measurements.
The emission reduction of NOxbased on model simulations was estimated to be about 40 % (Liu et al., 2013).
However, to study the effectiveness of the air quality measures, it is not enough to look at the concentration measurements alone, as the reduction of air pollutants
20
can also be affected by favorable meteorological conditions. Emissions need to be derived to better show the effect of temporary air quality regulations carried out for the Games. Up-to-date emission data is difficult to obtain, as most emission inventories are developed by a bottom-up approach based on statistics on source sector, land-use and sector specific emission factors.
25
ACPD
15, 6337–6372, 2015NOx emission
estimates during the 2014 Youth Olympic
Games in Nanjing
J. Ding et al.
Title Page
Abstract Introduction
Conclusions References
Tables Figures
◭ ◮
◭ ◮
Back Close
Full Screen / Esc
Printer-friendly Version Interactive Discussion
Discussion
P
a
per
|
Discussion
P
a
per
|
Discussion
P
a
per
|
Discussion
P
a
per
|
concentration to scale a priori emissions. They used optimal estimation to weigh the a priori emission inventory with the top-down estimates, resulting in an a posteriori inventory with error estimates. This method assumes that the relationship between emissions and concentrations is not affected by transport. Non-linear and non-local re-lations between emission and concentration can be indirectly solved by applying the
5
method iteratively (e.g. Zhao and Wang, 2009), although a posteriori error estimates are lost in this way. Kurokawa et al. (2009) and Stavrakou et al. (2008) used 4DVAR techniques to estimate emissions by applying an adjoint model of the chemistry trans-port model to calculate the sensitivities. Another popular data assimilation method is the Ensemble Kalman Filter (Evensen, 2003), which does not require an adjoint model
10
and is relatively easy to implement. As an extension of the Kalman filter, it employs a Monte Carlo approach to represent the uncertainty of the model system with a large stochastic ensemble. Whenever the filter requires statistics such as mean and covari-ance, these are obtained from the sample statistics of the ensemble (Miyazaki et al., 2012).
15
To get fast updates for short lived air pollutants, Mijling and van der A (2012) de-signed a Daily Emission estimates Constrained by Satellite Observation (DECSO) gorithm. DECSO is an inversion method based on an extended Kalman filter. The al-gorithm only needs one forward model run of a chemical transport model (CTM) to calculate all local and non-local emission/concentration relations. It updates emissions
20
by addition instead of scaling, enabling the detection of unaccounted emission sources. In this study, we use the latest version of DECSO with OMI satellite data to study how the environmental regulations affect the NOxemissions in Nanjing during the 2014
YOG. Detecting emission changes for Nanjing is challenging, as it is a smaller city than e.g. Beijing. In addition, Nanjing is in one of the most populated areas of China close
25
ACPD
15, 6337–6372, 2015NOx emission
estimates during the 2014 Youth Olympic
Games in Nanjing
J. Ding et al.
Title Page
Abstract Introduction
Conclusions References
Tables Figures
◭ ◮
◭ ◮
Back Close
Full Screen / Esc
Printer-friendly Version Interactive Discussion
Discussion
P
a
per
|
Discussion
P
a
per
|
Discussion
P
a
per
|
Discussion
P
a
per
|
satellite observations of OMI, taking advantage of its high spatial resolution needed to resolve the changes in the Nanjing area. With this improved algorithm we will compare the NOxemissions during the YOG with NOxemissions of the previous year in Yangtze
Delta River.
2 Methods
5
2.1 Emission estimates
For the emission estimates of NOx over China we use the DECSO algorithm (Mijling
and van der A, 2012). It uses a CTM to simulate the NO2 concentrations and daily
satellite observations of NO2 column concentrations to constrain NOx emissions. The algorithm is based on an extended Kalman filter to get new emission estimates by
op-10
timizing NO2column concentrations of model and satellite observations. The inclusion
of sensitivities of NO2column concentrations on the NOx emissions in other locations is an essential part of DECSO. A terrain-following trajectory analysis is used in this calculation to describe the transport of NO2over the model domain for a time interval
between two overpasses of the satellite instrument. This approach results in a fast
al-15
gorithm suitable for daily estimates of NOxemissions. A detailed description of DECSO
v1 can be found in Mijling and van der A (2012).
The CTM used in DECSO is CHIMERE (Schmidt, 2001; Bessagnet et al., 2004; Menut et al., 2013). CHIMERE is implemented on a 0.25◦×0.25◦spatial grid over East
Asia from 18 to 50◦N and 102 to 132◦E. It contains 8 atmospheric layers up to 500 hPa.
20
The meteorological input for CHIMERE is the operational meteorological forecast of the European Centre for Medium-Range Weather Forecasts (ECMWF) with a horizontal resolution of approximately 25 km×25 km. The Multi-resolution Emission Inventory for
China (MEIC) (He, 2012) for 2010 gridded to a resolution of 0.25◦×0.25◦, is used for the
initial emissions in DECSO. Outside China, where no MEIC emissions are defined, the
25
ACPD
15, 6337–6372, 2015NOx emission
estimates during the 2014 Youth Olympic
Games in Nanjing
J. Ding et al.
Title Page
Abstract Introduction
Conclusions References
Tables Figures
◭ ◮
◭ ◮
Back Close
Full Screen / Esc
Printer-friendly Version Interactive Discussion
Discussion
P
a
per
|
Discussion
P
a
per
|
Discussion
P
a
per
|
Discussion
P
a
per
|
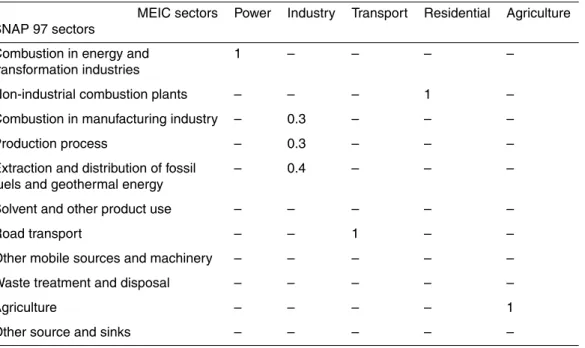
definition used in MEIC and INTEX-B does not match the 11 activity sectors according to the SNAP (Selected Nomenclature for Air Pollution) 97, which are internally used in the CHIMERE model, we redistribute the emissions over the sectors according to Table 2.
To compare CHIMERE simulations with satellite observations, we extend the
mod-5
elled vertical profiles from 500 hPa to the tropopause by adding a climatological partial column. The simulated NO2column concentrations on the model grid are redistributed to the satellite footprints. To enable direct comparison between simulated and observed tropospheric vertical column, the averaging kernel from the satellite retrieval is then ap-plied to the modelled vertical profile.
10
In this study, we used an updated version of DECSO, which is referred to as DECSO v3. Especially the calculation speed has been improved in this update. Furthermore, the emission injection height has been made sector-dependent and the forward trajec-tory calculation is changed to a backward calculation. In DECSO v3, the errorEobs of a satellite observation is recalculated according to:
15
Eobs=f ·Esat+(1−f)·(0.5·Esat), with f =e
−csat2
(1) whereEsat is the observation error from the retrieval method and csat is the retrieved NO2column of the satellite observation. The modified errors give more weight to
satel-lite observations with high values during the assimilation by reducing their relative er-ror while maintaining the dominating absolute erer-ror for low values (typically around
20
0.5×10¹⁵molecules cm−2).
2.2 Satellite observations
In this study, satellite observations from the Dutch-Finnish Ozone Monitoring Instru-ment (OMI) on NASA’s (National Aeronautics and Space Administration) Aura satellite (Levelt et al., 2006) are used in DECSO. The satellite was launched on 15 July 2004
25
spec-ACPD
15, 6337–6372, 2015NOx emission
estimates during the 2014 Youth Olympic
Games in Nanjing
J. Ding et al.
Title Page
Abstract Introduction
Conclusions References
Tables Figures
◭ ◮
◭ ◮
Back Close
Full Screen / Esc
Printer-friendly Version Interactive Discussion
Discussion
P
a
per
|
Discussion
P
a
per
|
Discussion
P
a
per
|
Discussion
P
a
per
|
trometer measuring the atmosphere-backscattered solar light in the ultraviolet-visible (UV/VIS) range from 270 to 500 nm with a spectral resolution of about 0.5 nm. The 114◦ wide view of OMI results in swath width of 2600 km providing daily global coverage in about 14 orbits. The local overpass time is around 13:30 LT. The pixel size of OMI is 24 km×13 km at nadir and increases to about 150 km×28 km at the end of the swath.
5
We use the tropospheric NO2vertical column concentrations retrieved with the Dutch
OMI NO2retrieval (DOMINO) algorithm version 2 (Boersma et al., 2011). The dataset
is available on the Tropospheric Emissions Monitoring Internet Service (TEMIS) portal (http://www.temis.nl). The DOMINO algorithm first obtains NO2slant columns from the OMI reflectance spectra by using Differential Optical Absorption Spectroscopy (DOAS).
10
After separating the stratospheric and tropospheric contribution to the slant column, DOMINO converts the tropospheric slant column to a vertical column with the tropo-spheric air mass factor (AMF) (Boersma et al., 2007, 2011). DOMINO v2.0 mainly improves the NO2 air mass factor by improved radiative transfer, surface albedo,
ter-rain height, clouds and a priori vertical NO2profiles. The bias between DOMINO v2.0
15
and Multi-Axis Differential Optical Absorption Spectroscopy (MAX-DOAS) ground ob-servations at 5 locations is only−10±14 % over China and Japan (Irie et al., 2012).
The DOMINO algorithm does not explicitly account for the effect of aerosols on the so-lar radiation. Rather it is indirectly accounted for by the higher cloud fraction in aerosol contaminated scenes. However, Lin et al. (2014) concluded that especially in China the
20
effects of aerosols and surface reflectance anisotropy have implications for retrievals of NO2from OMI and suggested that exclusion of high aerosol scenes supports better
emission estimates at fine spatial and temporal scales.
Since 25 June 2007, OMI data has been affected by the so-called row anomaly, which deteriorates the spectral observations for particular viewing directions of OMI (Boersma
25
et al., 2011; Kroon et al., 2011). 29 out of the 60 rows are affected by the row anomalies and no longer used after 1 January 2011. We also filter out the 4 pixels at either side of the swath. This makes the largest footprint about 75 km×21 km. To reduce the influence
ACPD
15, 6337–6372, 2015NOx emission
estimates during the 2014 Youth Olympic
Games in Nanjing
J. Ding et al.
Title Page
Abstract Introduction
Conclusions References
Tables Figures
◭ ◮
◭ ◮
Back Close
Full Screen / Esc
Printer-friendly Version Interactive Discussion
Discussion
P
a
per
|
Discussion
P
a
per
|
Discussion
P
a
per
|
Discussion
P
a
per
|
only observations having a surface albedo lower than 20 %. The observations with clouds below 800 hPa are also filtered out as these retrievals are very sensitive to small differences in the NO2profile shape and the retrieved cloud height. Mijling and van der
A (2012) filter out the observations with a cloud fraction higher than 20 %. Based on this filtering, there are no tropospheric NO2satellite observations over Nanjing during
5
the YOG due to the cloudy conditions at the overpass time of the satellite. Thus, to obtain more NO2 satellite observations, we use observations with a cloud radiance fraction lower than 70 % (comparable with a cloud fraction of about 30–35 %) instead of the cloud fraction lower than 20 %. After checking the monthly averages and the distribution of the satellite data, we find that the selected data is still of sufficient quality
10
while the number of observations increases with about 37 %.
2.3 Ground observations
To validate the model results in Nanjing, we use available independent measurements from the national in-situ observation network, which are collected and maintained by the China National Environmental Monitoring Center (CNEMC). The aqicn.org
15
team publishes the hourly Air Quality Index (AQI) of different air pollutants, such as NO2, SO2, and particulate matter, on their website based on the measurements from CNEMC. The AQI is calculated by the conversion table from the Technical Regulation on Ambient Air Quality Index in China published by the Ministry of Environmental Pro-tection. We use the same table to convert the AQI back to the surface concentration
20
unit of µg m−3
. For this study, the NO2hourly ground measurements of Nanjing for the period of April 2013 to December 2014 are used. The location of these measurements is the Nanjing People’s Government building, which is located in the center of Nanjing. Interpretation of the validation results is troubled by the absence of peripheral informa-tion of the ground measurements. For instance, the type of instrument is unknown and
25
ACPD
15, 6337–6372, 2015NOx emission
estimates during the 2014 Youth Olympic
Games in Nanjing
J. Ding et al.
Title Page
Abstract Introduction
Conclusions References
Tables Figures
◭ ◮
◭ ◮
Back Close
Full Screen / Esc
Printer-friendly Version Interactive Discussion
Discussion
P
a
per
|
Discussion
P
a
per
|
Discussion
P
a
per
|
Discussion
P
a
per
|
3 Improvements of DECSO
3.1 Model improvement
The performance of the CTM is important for the DECSO results. CHIMERE v2006 is an outdated model version which has been used in DECSO algorithm versions up to v3a. To improve the emission estimation results, we updated the CTM to CHIMERE
5
v2013 (DECSO v3b).
The new model adds biogenic emissions of six species: isoprene, α-ioporene, α -pinene, β-pinene, limonene, ocimene and NO. These biogenic emissions are calcu-lated by the model preprocessor using the MEGAN model and land use data (Menut et al., 2013). The added biogenic emissions can affect the emissions estimated for
ru-10
ral areas as biogenic NO emissions in rural areas cannot be negligible in summertime. Compared to the old version of CHIMERE, the new model version includes a more advanced scheme for secondary organic aerosol chemistry. In addition, the chemical reaction rates are updated and a new transport scheme is used in the new CHIMERE model. For CHIMERE v2013 we use the same input data except for the land use data.
15
We use land use data from the GlobCover Land Cover (GCLC version 2.3) database, which is updated for the year 2009, while the land use database included in CHIMERE v2006 is the Global Land Cover Facility (GLFC) giving the land use of 1994. As China is a fast developing country, the land use may have large differences in 15 years due to urbanization. Thus, the updated land use database will positively affect the model
20
simulations over China.
To assess the effect of the new CTM, we run DECSO v3a and DECSO v3b for the period January 2013 to August 2014. Figure 1 shows the comparison of the aver-age diurnal cycle of surface NO2 concentrations from the two CHIMERE models with in-situ observations in Nanjing averaged for January to August 2014. We select the
25
0.25◦×0.25◦model grid cell that contains the in-situ measurement location. According
ACPD
15, 6337–6372, 2015NOx emission
estimates during the 2014 Youth Olympic
Games in Nanjing
J. Ding et al.
Title Page
Abstract Introduction
Conclusions References
Tables Figures
◭ ◮
◭ ◮
Back Close
Full Screen / Esc
Printer-friendly Version Interactive Discussion
Discussion
P
a
per
|
Discussion
P
a
per
|
Discussion
P
a
per
|
Discussion
P
a
per
|
for CHIMERE v2006. Our earlier model evaluations of CHIMERE showed that the noc-turnal surface NO2concentrations simulated by CHIMERE v2006 are usually too high
in urban areas caused by unrealistically low boundary layer heights and too little vertical diffusion. In CHIMERE v2013, the boundary layer heights over urban areas are limited by a minimum boundary layer height. As expected, v2013 improves the surface
con-5
centration simulation at nighttime, while improvements during daytime are rather small. We calculate the bias and Root Mean Square Error (RMSE) between the model results and in-situ observations. The bias of CHIMERE v2013 is 3.7 µg m−3which is 10 µg m−3 smaller than for CHIMERE v2006. The difference of RMSE between the two models is very small, the RMSE of CHIMERE v2013 is 28 µg m−3 and of CHIMERE v2006 is
10
31 µg m−3
. For the satellite overpass time, the bias improves from 4.4 to 1.8 µg m−3
while the RMSE remains the same. However, in urban areas the local sources have transient influences on in-situ observations. Blond et al. (2007) concluded that urban in-situ observations of NO2cannot be used for the validation of a CTM model with low spatial resolution because the representativeness of the in-situ measurement for the
15
grid cell is very low. In spite of this, we still see some improvements for averaged NO2
concentrations in CHIMERE v2013.
In order to get a more comprehensive validation of the model results, we compare the two CHIMERE models with OMI satellite observations. During the data assimilation of DECSO the daily “Observation minus Forecasts” (OmF) values have been stored.
20
The OmF is a common measure for the forecasting capabilities of the model in the data assimilation. We compare the absolute OmF of both models for the summer (June to August) of 2014 in Fig. 2. In the Figure a linear regression is fitted through the data points that shows the absolute OmF of CHIMERE v2013 is lower than that of CHIMERE v2006 indicating a better performance of CHIMERE v2013 in summertime. However,
25
ACPD
15, 6337–6372, 2015NOx emission
estimates during the 2014 Youth Olympic
Games in Nanjing
J. Ding et al.
Title Page
Abstract Introduction
Conclusions References
Tables Figures
◭ ◮
◭ ◮
Back Close
Full Screen / Esc
Printer-friendly Version Interactive Discussion
Discussion
P
a
per
|
Discussion
P
a
per
|
Discussion
P
a
per
|
Discussion
P
a
per
|
3.2 Improvement of the satellite data
Earlier studies showed that the DOMINO v2 retrievals do not account enough for the effect of high aerosol concentrations on NO2columns (see Sect. 2.2) and at the same
time we know that high aerosol concentrations are a significant problem in most mega cities in China. When checking the time series of NOxemissions over Nanjing for 2013
5
by DECSO v3b, we find some suspicious fluctuations at particular days. At these dates the NOx emissions are almost entirely removed in one day and then slowly increase again. These unrealistic emission updates are related to extreme OmF values (lower than−5 or higher than 10×1015molecules cm−2) with relative small OmF variances,
which are calculate as the quadratic sum of model and observation errors (Fig. 3).
10
In the time period of our study there are 20 days with these extreme OmF values, 6 are positive and 14 are negative. All are having a significant impact on the NOx
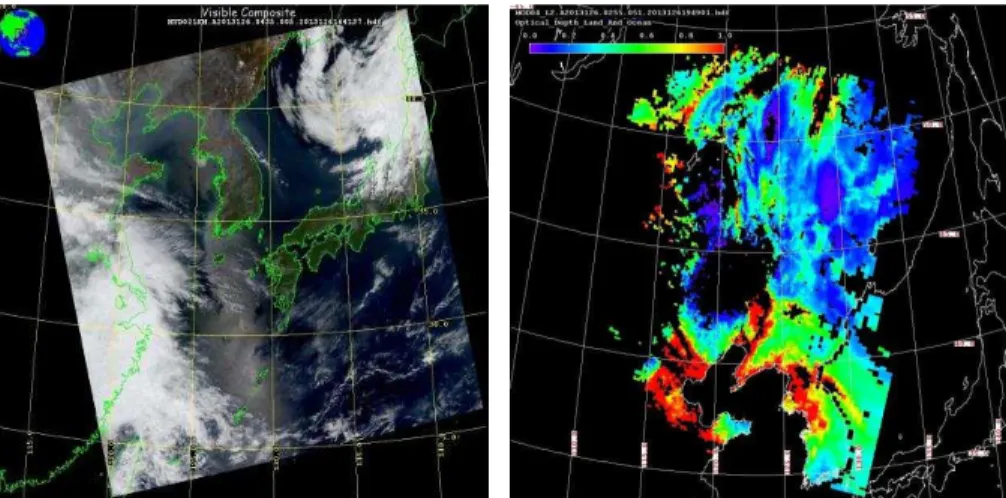
emis-sions. For most of those 20 days, the in-situ observations of PM10 show high aerosol concentrations, which are above 100 µg m−3 in Nanjing. We also see a strong haze above Nanjing for all the 20 days from visual inspection of the MODIS RGB images.
15
In addition, we noticed that the MODIS images show higher cloud fractions than the fractions retrieved from OMI observations. The underestimation of cloud fraction infor-mation from the OMI satellite retrieval is probably due to the aerosol conditions, which are not taken into account in the cloud retrieval algorithm. High aerosol concentra-tions can not only complexly affect the cloud fraction and cloud pressure retrieval but
20
also directly affect the NO2retrieval and results in either over- or underestimated NO2
concentrations (Lin et al., 2014).
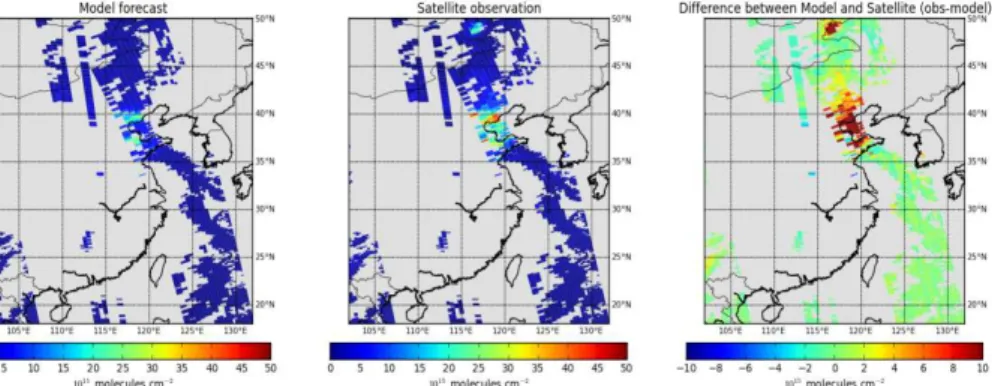
Figure 4 shows an example of such an extreme case for East China on 6 May 2013 with high (positive) OmF values in combination with low observational uncertainties. In the image we identify two areas with satellite observations that are at least 10×
25
ACPD
15, 6337–6372, 2015NOx emission
estimates during the 2014 Youth Olympic
Games in Nanjing
J. Ding et al.
Title Page
Abstract Introduction
Conclusions References
Tables Figures
◭ ◮
◭ ◮
Back Close
Full Screen / Esc
Printer-friendly Version Interactive Discussion
Discussion
P
a
per
|
Discussion
P
a
per
|
Discussion
P
a
per
|
Discussion
P
a
per
|
images on that day (Fig. 5). The MODIS AOD image shows high aerosol values around the Bohai Bay and over the Hulunbuir sand land. The RGB image of MODIS shows haze around the Bohai Bay, which indicates that the high aerosol concentrations are near the surface. However, the aerosol information is not used in the retrieval of the DOMINO NO2 product leading to NO2 observations that are strongly deviating from
5
the model forecast.
In the data assimilation it is assumed that the OmF distribution is Gaussian and OmF can be used to filter outliers from the data. So far, no OmF outlier criterion has been used in DECSO. Our previous analysis, however, shows the need for the detection of outliers. A filter has to be implemented with care, to avoid that the algorithm becomes
10
insensitive to new emission sources such as new power plants. We select a OmF filter criterion in the range of [−5, 10]×1015molecules cm−2.
The distribution of OmF of all pixels over our domain from January 2013 to September 2014 is Gaussian and 97 % of the OmF is in the interval of [−5, 10]×
1015molecules cm−2. However, over highly polluted areas both satellite observations
15
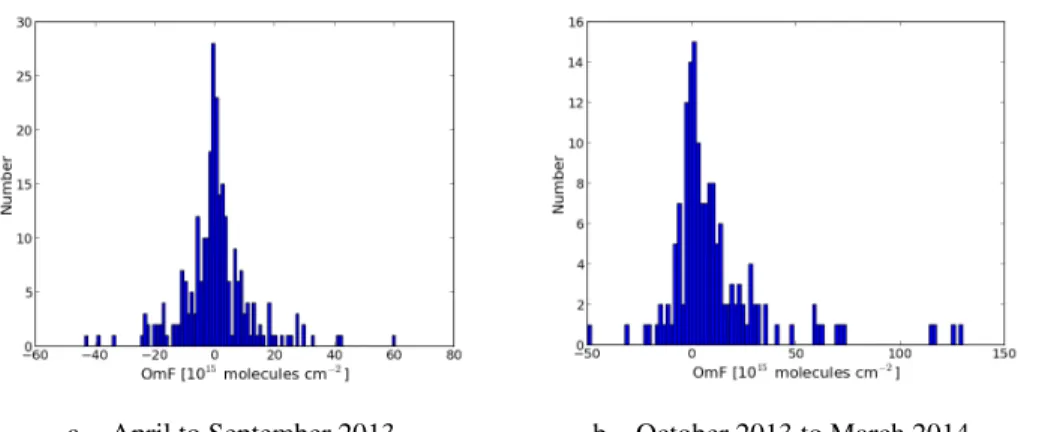
and model results have larger errors resulting in higher OmF values. In addition, the lifetime of NO2is much longer in winter than in summer which may lead to large OmF values in winter time. We choose 15 high polluted cities in China based on AQI and study the distribution of the OmF for the summer period (April to September 2013) and the winter period (October 2013 to March 2014) (Fig. 6). As expected, the distribution
20
of OmF is wider in winter than in summer. In summer 70 % of the OmF values are in the interval of [−5, 10]×1015molecules cm−2, while in winter 50 % of the OmF values are
within [−5, 10]×1015molecules cm−2. We select an asymmetric interval because the
assimilation is especially sensitive to very negative outliers in OmF caused by low ob-servations (having small observational errors associated), as opposed to very positive
25
outliers caused by high observations, which are associated with large observational errors.
To figure out the effect of a large OmF on NO2 emission estimates, we compare
ACPD
15, 6337–6372, 2015NOx emission
estimates during the 2014 Youth Olympic
Games in Nanjing
J. Ding et al.
Title Page
Abstract Introduction
Conclusions References
Tables Figures
◭ ◮
◭ ◮
Back Close
Full Screen / Esc
Printer-friendly Version Interactive Discussion
Discussion
P
a
per
|
Discussion
P
a
per
|
Discussion
P
a
per
|
Discussion
P
a
per
|
v3b assimilation. During the summertime, the mean difference in NO2 column con-centrations between these two runs is 4.8×10¹⁵molecules cm−2 in the Nanjing area
(six grid cells). This column difference is caused by the NOx emission difference
of 9.2×10¹⁵molecules cm−2h−1. From a simple back-of-the-envelope calculation we
derive that a negative 5×10¹⁵molecules cm−2 difference in NO2 columns requires
5
a 9.6×10¹⁵molecules cm−2h−1 emission change, which would mean that all NOx
emissions in Nanjing would be removed in a single day. This change in emission is comparable to the total emissions of 2 large-sized coal-fired power plants. In addi-tion, when the pixel size of the satellite is twice that of the model grid cell, the up-dates of emissions in that grid will even be doubled. This shows that a change in
10
OmF of 5×10¹⁵molecules cm−2 is very unrealistic even in the most extreme cases.
Therefore, this limit will be used as a criterion to filter outliers, which are in general caused by wrong NO2retrievals. To avoid the influence of the extreme OmF on
emis-sion estimates and still be able to monitor real emisemis-sion changes, we filter out negative OmF values lower than 5×10¹⁵molecules cm−2 and positive OmF values more than
15
10×1015molecules cm−2to be conservative. After applying the OmF filter criteria, we
filter out 16 % of the extreme OmF in the polluted cities and less than 3 % in the whole domain. The large unrealistic jumps in emission disappear from the time series.
4 Emission analysis for the Nanjing Youth Olympic Games
First, we compare NO2monthly average concentrations in 2014 with previous years
us-20
ing in-situ and satellite observations. For the in-situ observations we select the monthly mean at 13:00 LT to be able to compare the results with the satellite observations whose overpass time is about 13:30 LT (see Fig. 7). Compared to the year 2013 the in-situ measurements show no significant improvement in the surface NO2concentration at 13:00 LT for the period (May to August 2014) when the government took air quality
25
ACPD
15, 6337–6372, 2015NOx emission
estimates during the 2014 Youth Olympic
Games in Nanjing
J. Ding et al.
Title Page
Abstract Introduction
Conclusions References
Tables Figures
◭ ◮
◭ ◮
Back Close
Full Screen / Esc
Printer-friendly Version Interactive Discussion
Discussion
P
a
per
|
Discussion
P
a
per
|
Discussion
P
a
per
|
Discussion
P
a
per
|
local traffic) and weather. We also calculate the monthly average using all measure-ments and we still see no improvemeasure-ments of the NO2concentration for the YOG period.
Therefore, we assume that the in-situ measurements are not representative for the whole city of Nanjing.
Figure 8 shows the land-use over Jiangsu Province. The rectangle referred to as the
5
Nanjing area, covers the whole of Nanjing including all industrial areas along Yangtze River. According to the MEIC sector distribution, the power plants in the selected area are dominating the NOx emissions. To study the effects of the air quality regulations
for the YOG on tropospheric NO2 concentrations, we compare the monthly averages
of satellite observations over the Nanjing area for each year from 2005 to 2014 by
10
regridding the observational data on the model grid over the area.
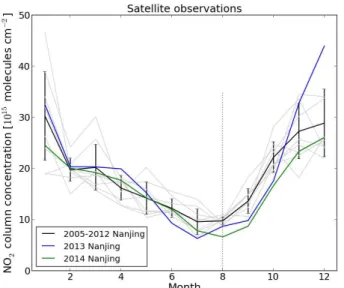
The satellite observations show that on average the NO2 concentrations are rather
similar from year to year (Fig. 9). Although a small trend is visible in the satellite data, we include this in the SD. It is clear that the NO2concentrations have a seasonal cycle that is lower in summer than in winter due to the seasonal change of the NO2lifetime
15
(van der A et al., 2006). Note that the small decrease in concentrations in February might be caused by the reduced emissions during the Spring Festival (Q. Zhang et al., 2009). We see that the NO2concentration during the YOG period (August 2014) is on
average only 6.6 molecules cm−2, which is the lowest value among the last 10 years and more than 3 SD from the mean. Consequently, due to the effect of the air
qual-20
ity regulations for the YOG, the NO2 concentrations of the following months are also
lower than for previous years. In November, the local government took similar air quality regulations for the first National Memorial ceremony held on 13 December 2014. That might explain the lower NO2concentrations of the last two months of 2014 compared to
those of 2013 and compared to the average of the last 8 years. However, it is still within
25
the range of the SD of NO2 concentrations for the last 8 years. Differences from year to year can also be attributed to the meteorological conditions. Particularly in Decem-ber 2013, NO2 concentrations are very high. This episode is well known as a heavy
ACPD
15, 6337–6372, 2015NOx emission
estimates during the 2014 Youth Olympic
Games in Nanjing
J. Ding et al.
Title Page
Abstract Introduction
Conclusions References
Tables Figures
◭ ◮
◭ ◮
Back Close
Full Screen / Esc
Printer-friendly Version Interactive Discussion
Discussion
P
a
per
|
Discussion
P
a
per
|
Discussion
P
a
per
|
Discussion
P
a
per
|
pollution. Compared to the averaged NO2concentration in August from 2005 to 2012, the NO2concentration of August in 2014 is decreased with 32 % in Nanjing. However,
this significant decrease can be caused by the rainy weather during that month. Thus, NO2 emission estimates are needed to show if the air quality regulations were really effective.
5
To compare the NOx emissions in Nanjing in 2014, especially during the YOG, with
the same period of the year 2013, we run DECSO v3b with the OmF criterion as de-scribed in Sect. 3.2 from October 2012 to December 2014, where the first three months are used as spin-up period. Figure 10 shows the monthly NOxemissions in Nanjing for
the year 2013 and 2014 estimated by this version of DECSO. For comparison the initial
10
MEIC inventory is also plotted in the Figure. The NO2 emissions have a different sea-sonal cycle compared to the NO2 concentrations of satellite observations in Nanjing.
The months with high emissions are June and July while the highest NO2
concentra-tions of the satellite observaconcentra-tions appear in January and December. According to the sector distribution in the MEIC inventory, the emissions of power plants and industrial
15
activities are the main sources in Nanjing. At least 50 % of the total NOx emissions are
from power plants and 40 % are from the industrial activities. H. Zhang et al. (2009) showed that the seasonal cycle of the electricity consumption in Nanjing for the 6 years from 2000 to 2006 peaks in the summertime, because the electricity consumption and power load are highly correlated with temperature in summer. The seasonality of
elec-20
tricity consumption is caused by the increasing usage of air conditioning in the hot season, while there is no heating system used in winter time in Nanjing. The opposite cycles of concentrations (Fig. 9) and emissions (Fig. 10) show that the high NO2 con-centrations in winter in Nanjing are mainly affected by the long lifetime of NOx, while
the seasonal cycle of NOxemissions is reversed as a result of the increased electricity
25
consumption in summertime.
We see a drop in NOxemissions in February for both years calculated with DECSO,
ACPD
15, 6337–6372, 2015NOx emission
estimates during the 2014 Youth Olympic
Games in Nanjing
J. Ding et al.
Title Page
Abstract Introduction
Conclusions References
Tables Figures
◭ ◮
◭ ◮
Back Close
Full Screen / Esc
Printer-friendly Version Interactive Discussion
Discussion
P
a
per
|
Discussion
P
a
per
|
Discussion
P
a
per
|
Discussion
P
a
per
|
to the neighboring months. Compared to the neighboring months, the NOx emission reduction in February is about 10 % in 2013 and 2014. This NOx emission decrease
was also noticed by Q. Zhang et al. (2009) in the INTEX-B inventory and likely to be caused by the reduced industrial activities during the Spring Festival. Interestingly, we do not see an increase of NOx emissions in the December 2013 smog period. This
5
shows that the smog is caused by the meteorological conditions rather than increased emissions.
Figure 10 shows a large reduction of NOxemissions in September 2014. This
reduc-tion is caused by the air quality regulareduc-tions taken by the local government to reduce air pollutants during the YOG period. The total NOxemissions in September in Nanjing are
10
4.5 Gg N. Compared to the same time of the year 2013, the reduction is about 25 %. However, the emission reduction in this case seems to have a delay of one month. This is a consequence of the lack of satellite observations due to the rainy (and there-fore cloudy) weather in the second half of August 2014 when the YOG took place. For this kind of conditions, DECSO only detects the full extent of the emission reduction in
15
September. We also see a NOxemission reduction of 10 % in August 2013, compared
to the neighboring months. One likely reason for this reduction is that the Asian Youth Games were held during that time. The local government also took measures to ensure good air quality for that event but not as strict as for the YOG in 2014. We conclude that the NOxemission reduction detected by DECSO for the YOG period was at least 25 %,
20
showing that the air quality regulations taken by the local government were effective.
5 Discussion and conclusions
In this study the effect of the air quality regulations of the local government during the YOG in Nanjing in 2014 has been quantified by analyzing observations on the ground and from the satellite. The focus in this study was on the reduced NO2concentrations
25
ACPD
15, 6337–6372, 2015NOx emission
estimates during the 2014 Youth Olympic
Games in Nanjing
J. Ding et al.
Title Page
Abstract Introduction
Conclusions References
Tables Figures
◭ ◮
◭ ◮
Back Close
Full Screen / Esc
Printer-friendly Version Interactive Discussion
Discussion
P
a
per
|
Discussion
P
a
per
|
Discussion
P
a
per
|
Discussion
P
a
per
|
noisy, even after averaging on a monthly basis. This is probably caused by the variability of local sources and it indicates that these in-situ observations are not representative for the larger area of Nanjing. The in-situ data shows no significant decrease during the YOG period. Since we have no error estimates of the in-situ observations and very little information on the instrument and measurement techniques we discard the results of
5
the in-situ observations in our conclusions.
For the view from space we limited ourselves to retrievals of tropospheric NO2 from OMI, taking advantage of the high spatial resolution of OMI observations compared to similar instruments. The monthly OMI satellite observations showed a 32 % decrease of the NO2 concentration during the YOG period in Nanjing compared to the average
10
value for the last 10 years. However, the decrease of NO2concentrations observed by the satellite is not an objective measure to verify the impact of the air quality regulations taken by the local government, because changes in NO2concentrations can have more
causes such as horizontal transport of NO2 or increased deposition due to the rainy weather. Furthermore, due to cloudy conditions, the August average of 2014 is based
15
on few observations. Therefore, it is important to analyze the emissions to show if the air quality regulations has really affected the NO2concentrations.
The results of our improved emission estimate algorithm DECSO show that NOx
emissions decreased with at least 25 % in September 2014, which shows that the air quality regulations were effective during the YOG period and that only a small part of
20
the reduced NO2concentrations were caused by the weather conditions. However, the
reduction has one month delay in our results. This is because satellite observations were scarce in the Nanjing area during the YOG (16 to 29 August) causing the DECSO algorithm to converge slower to the new emissions, which is typical for the Kalman filter approach used in DECSO.
25
We were able to see the emission reduction of NOx in the selected 6 grid cells representative for the Nanjing area. That means that DECSO at least is able to estimate NOx emissions on a spatial resolution of about 50 km×90 km. If we apply the same
ACPD
15, 6337–6372, 2015NOx emission
estimates during the 2014 Youth Olympic
Games in Nanjing
J. Ding et al.
Title Page
Abstract Introduction
Conclusions References
Tables Figures
◭ ◮
◭ ◮
Back Close
Full Screen / Esc
Printer-friendly Version Interactive Discussion
Discussion
P
a
per
|
Discussion
P
a
per
|
Discussion
P
a
per
|
Discussion
P
a
per
|
covers on average a larger area than a single grid cell. To achieve emission estimates in a smaller area, either satellite observations with a higher spatial resolution are required, or longer time periods should be considered.
The quality of our emission estimates is highly related to the quality of the model and the satellite observations. We improved the DECSO algorithm by using a new version
5
of the CTM: CHIMERE v2013 instead of CHIMERE v2006. The comparison of OmF be-tween two models showed that CHIMERE v2013 has a better performance in summer-time. Good quality of satellite observations is also essential for emission estimates. The DOMINO retrieval algorithm does not properly account for the effects of high aerosol concentrations, which are common in China, on the retrieved NO2columns. In case of
10
high aerosol concentrations, the difference of the model simulations and the retrievals is very large, which leads to wrong updates of NOxemission in DECSO. To improve the satellite observations we have set an OmF criterion to filter out erroneous observations and to avoid unrealistic NOxemission updates. We set the limitation to the range−5 to
10×1015molecules cm−2for the OmF. With this filter criterion, the unrealistic updates
15
of NOx emissions are mostly prevented. We will further analysis the impact of high
aerosol concentrations on the retrieved NO2columns in future research.
Furthermore, we observed an opposite seasonal cycle of NOxemissions compared to the NO2concentrations observed by OMI satellite. The seasonal cycle of NOx
emis-sions is not the same for the whole China domain since the different climate in the North
20
and the South of China leads to a different variability of energy consumption during the year. In Nanjing, as in most parts of Southern China, people use air conditioning in summer and do not use heating systems in winter. This leads to larger electricity con-sumptions of power plants in summer causing higher NOx emissions. Tu et al. (2007) studied the air pollutants in Nanjing and also found high NO2 concentrations in winter
25
but concluded that the high NO2 concentrations were caused by high NOx emissions
re-ACPD
15, 6337–6372, 2015NOx emission
estimates during the 2014 Youth Olympic
Games in Nanjing
J. Ding et al.
Title Page
Abstract Introduction
Conclusions References
Tables Figures
◭ ◮
◭ ◮
Back Close
Full Screen / Esc
Printer-friendly Version Interactive Discussion
Discussion
P
a
per
|
Discussion
P
a
per
|
Discussion
P
a
per
|
Discussion
P
a
per
|
sults of south China showed the same seasonal cycle of NO2columns but a very weak seasonality of NOx emissions and they also concluded that the NOx lifetime mainly
determines the NO2columns.
In conclusion, in the emission estimates we not only found a reversed seasonal cycle peaking in summertime, but also indications for reduced emissions during the Spring
5
Festival, the Asian Youth Games in 2013 and the YOG 2014. Based on our emission estimates the air quality regulation during the YOG 2014 reduced the NOx emissions with at least 25 % . This, together with favorable meteorological conditions, was respon-sible for the decrease of 32 % in NO2column concentrations observed from space. For
the case of the YOG, our results can help the local government to identify the impact
10
of their air quality regulations on reducing NOxemissions.
Acknowledgements. The research was part of the GlobEmission Project funded and supported
by the European Space Agency. We acknowledge Tsinghua University for providing the MEIC inventory and the ESA GlobCover 2009 Project for the land use dataset. The MODIS images used in this study were acquired as part of the NASA’s Earth-Sun System Division and archived
15
and distributed by the MODIS Adaptive Processing System (MODAPS). The OMI is part of the NASA Earth Observing System (EOS) Aura satellite payload. The OMI project is managed by the Netherlands Space Office (NSO) and the Royal Netherlands Meteorological Institute (KNMI).
References 20
Bessagnet, B., Hodzic, A., Vautard, R., Beekmann, M., Cheinet, S., Honoré, C., Liousse, C., and Rouil, L.: Aerosol modeling with CHIMERE – preliminary evaluation at the continental scale, Atmos. Environ., 38, 2803–2817, doi:10.1016/j.atmosenv.2004.02.034, 2004.
Blond, N., Boersma, K. F., Eskes, H. J., van der A, R. J., Van Roozendael, M., De Smedt, I., Bergametti, G., and Vautard, R.: Intercomparison of SCIAMACHY nitrogen dioxide
observa-25
ACPD
15, 6337–6372, 2015NOx emission
estimates during the 2014 Youth Olympic
Games in Nanjing
J. Ding et al.
Title Page
Abstract Introduction
Conclusions References
Tables Figures
◭ ◮
◭ ◮
Back Close
Full Screen / Esc
Printer-friendly Version Interactive Discussion
Discussion
P
a
per
|
Discussion
P
a
per
|
Discussion
P
a
per
|
Discussion
P
a
per
|
Boersma, K. F., Eskes, H. J., Veefkind, J. P., Brinksma, E. J., van der A, R. J., Sneep, M., van den Oord, G. H. J., Levelt, P. F., Stammes, P., Gleason, J. F., and Bucsela, E. J.: Near-real time retrieval of tropospheric NO2from OMI, Atmos. Chem. Phys., 7, 2103–2118, doi:10.5194/acp-7-2103-2007, 2007.
Boersma, K. F., Eskes, H. J., Dirksen, R. J., van der A, R. J., Veefkind, J. P., Stammes, P.,
5
Huijnen, V., Kleipool, Q. L., Sneep, M., Claas, J., Leitão, J., Richter, A., Zhou, Y., and Brun-ner, D.: An improved tropospheric NO2column retrieval algorithm for the Ozone Monitoring Instrument, Atmos. Meas. Tech., 4, 1905–1928, doi:10.5194/amt-4-1905-2011, 2011. Chan, C. and Yao, X.: Air pollution in mega cities in China, Atmos. Environ., 42, 1–42,
doi:10.1016/j.atmosenv.2007.09.003, 2008.
10
Evensen, G.: The Ensemble Kalman Filter: theoretical formulation and practical implementa-tion, Ocean Dynam., 53, 343–367, doi:10.1007/s10236-003-0036-9, 2003.
Hao, N., Valks, P., Loyola, D., Cheng, Y. F., and Zimmer, W.: Space-based measurements of air quality during the World Expo 2010 in Shanghai, Environ. Res. Lett., 6, 044004, doi:10.1088/1748-9326/6/4/044004, 2011.
15
He, K.: Multi-resolution Emission Inventory for China (MEIC): model framework and 1990– 2010 anthropogenic emissions, in: International Global Atmospheric Chemistry Conference, Beijing, China, 17–21 September, available at http://adsabs.harvard.edu/abs/2012AGUFM. A32B..05H (last access: 4 February 2015), 2012.
Irie, H., Boersma, K. F., Kanaya, Y., Takashima, H., Pan, X., and Wang, Z. F.: Quantitative bias
20
estimates for tropospheric NO2columns retrieved from SCIAMACHY, OMI, and GOME-2 us-ing a common standard for East Asia, Atmos. Meas. Tech., 5, 2403–2411, doi:10.5194/amt-5-2403-2012, 2012.
Itahashi, S., Uno, I., Irie, H., Kurokawa, J.-I., and Ohara, T.: Regional modeling of tropospheric NO2 vertical column density over East Asia during the period 2000–2010: comparison with
25
multisatellite observations, Atmos. Chem. Phys., 14, 3623–3635, doi:10.5194/acp-14-3623-2014, 2014.
Kroon, M., de Haan, J. F., Veefkind, J. P., Froidevaux, L., Wang, R., Kivi, R., and Hakkarainen, J. J.: Validation of operational ozone profiles from the Ozone Monitoring In-strument, J. Geophys. Res., 116, D18305, doi:10.1029/2010JD015100, 2011.
30
ACPD
15, 6337–6372, 2015NOx emission
estimates during the 2014 Youth Olympic
Games in Nanjing
J. Ding et al.
Title Page
Abstract Introduction
Conclusions References
Tables Figures
◭ ◮
◭ ◮
Back Close
Full Screen / Esc
Printer-friendly Version Interactive Discussion
Discussion
P
a
per
|
Discussion
P
a
per
|
Discussion
P
a
per
|
Discussion
P
a
per
|
Lamsal, L. N., Martin, R. V., Padmanabhan, A., van Donkelaar, A., Zhang, Q., Sioris, C. E., Chance, K., Kurosu, T. P., and Newchurch, M. J.: Application of satellite observations for timely updates to global anthropogenic NOx emission inventories, Geophys. Res. Lett., 38, L05810, doi:10.1029/2010GL046476, 2011.
Levelt, P. F., van den Oord, G. H. J., Dobber, M. R., Malkki, A., Stammes, P., Lundell, J. O. V.,
5
and Saari, H.: The ozone monitoring instrument, IEEE T. Geosci. Remote, 44, 1093–1101, doi:10.1109/TGRS.2006.872333, 2006.
Li, L., Chen, C. H., Fu, J. S., Huang, C., Streets, D. G., Huang, H. Y., Zhang, G. F., Wang, Y. J., Jang, C. J., Wang, H. L., Chen, Y. R., and Fu, J. M.: Air quality and emissions in the Yangtze River Delta, China, Atmos. Chem. Phys., 11, 1621–1639, doi:10.5194/acp-11-1621-2011,
10
2011.
Liu, H., Wang, X., Zhang, J., He, K., Wu, Y., and Xu, J.: Emission controls and changes in air quality in Guangzhou during the Asian Games, Atmos. Environ., 76, 81–93, doi:10.1016/j.atmosenv.2012.08.004, 2013.
Martin, R. V., Jacob, D. J., Kurosu, T. P., Chance, K., Palmer, P. I., and Evans, M. J.: Global
15
inventory of nitrogen oxide emissions constrained by space-based observations of NO2 columns, J. Geophys. Res., 108, 4537, doi:10.1029/2003JD003453, 2003.
Menut, L., Bessagnet, B., Khvorostyanov, D., Beekmann, M., Blond, N., Colette, A., Coll, I., Curci, G., Foret, G., Hodzic, A., Mailler, S., Meleux, F., Monge, J.-L., Pison, I., Siour, G., Tur-quety, S., Valari, M., Vautard, R., and Vivanco, M. G.: CHIMERE 2013: a model for regional
20
atmospheric composition modelling, Geosci. Model Dev., 6, 981–1028, doi:10.5194/gmd-6-981-2013, 2013.
Mijling, B., van der A, R. J., Boersma, K. F., Van Roozendael, M., De Smedt, I., and Kelder, H. M.: Reductions of NO2 detected from space during the 2008 Beijing Olympic Games, Geophys. Res. Lett., 36, L13801, doi:10.1029/2009GL038943, 2009.
25
Mijling, B. and van der A, R. J.: Using daily satellite observations to estimate emissions of short-lived air pollutants on a mesoscopic scale, J. Geophys. Res.-Atmos., 117, D17302, doi:10.1029/2012JD017817, 2012.
Miyazaki, K., Eskes, H. J., Sudo, K., Takigawa, M., van Weele, M., and Boersma, K. F.: Simulta-neous assimilation of satellite NO2, O3, CO, and HNO3data for the analysis of tropospheric
30
ACPD
15, 6337–6372, 2015NOx emission
estimates during the 2014 Youth Olympic
Games in Nanjing
J. Ding et al.
Title Page
Abstract Introduction
Conclusions References
Tables Figures
◭ ◮
◭ ◮
Back Close
Full Screen / Esc
Printer-friendly Version Interactive Discussion
Discussion
P
a
per
|
Discussion
P
a
per
|
Discussion
P
a
per
|
Discussion
P
a
per
|
Schmidt, H.: A comparison of simulated and observed ozone mixing ratios for the sum-mer of 1998 in Western Europe, Atmos. Environ., 35, 6277–6297, doi:10.1016/S1352-2310(01)00451-4, 2001.
Shao, M., Tang, X., Zhang, Y., and Li, W.: City clusters in China: air and sur-face water pollution, Front. Ecol. Environ., 4, 353–361,
doi:10.1890/1540-5
9295(2006)004[0353:CCICAA]2.0.CO;2, 2006.
Stavrakou, T., Müller, J.-F., Boersma, K. F., De Smedt, I., and van der A, R. J.: Assessing the distribution and growth rates of NOxemission sources by inverting a 10-year record of NO2 satellite columns, Geophys. Res. Lett., 35, L10801, doi:10.1029/2008GL033521, 2008. Streets, D. G., Canty, T., Carmichael, G. R., de Foy, B., Dickerson, R. R., Duncan, B. N.,
Ed-10
wards, D. P., Haynes, J. A., Henze, D. K., Houyoux, M. R., Jacob, D. J., Krotkov, N. A., Lamsal, L. N., Liu, Y., Lu, Z., Martin, R. V., Pfister, G. G., Pinder, R. W., Salawitch, R. J., and Wecht, K. J.: Emissions estimation from satellite retrievals: a review of current capability, Atmos. Environ., 77, 1011–1042, doi:10.1016/j.atmosenv.2013.05.051, 2013.
Tu, J., Xia, Z.-G., Wang, H., and Li, W.: Temporal variations in surface ozone and its
pre-15
cursors and meteorological effects at an urban site in China, Atmos. Res., 85, 310–337, doi:10.1016/j.atmosres.2007.02.003, 2007.
Van der A, R. J., Peters, D. H. M. U., Eskes, H., Boersma, K. F., Van Roozendael, M., De Smedt, I., and Kelder, H. M.: Detection of the trend and seasonal variation in tropospheric NO2over China, J. Geophys. Res., 111, D12317, doi:10.1029/2005JD006594, 2006.
20
Wang, S., Zhao, M., Xing, J., Wu, Y., Zhou, Y., Lei, Y., He, K., Fu, L., and Hao, J.: Quantifying the air pollutants emission reduction during the 2008 olympic games in Beijing, Environ. Sci. Technol., 44, 2490–2496, 2010.
Wang, Y., McElroy, M. B., Martin, R. V., Streets, D. G., Zhang, Q., and Fu, T. M.: Sea-sonal variability of NOx emissions over east China constrained by satellite observations:
25
implications for combustion and microbial sources, J. Geophys. Res.-Atmos., 112, 1–19, doi:10.1029/2006JD007538, 2007.
Wang, Y., Hao, J., McElroy, M. B., Munger, J. W., Ma, H., Chen, D., and Nielsen, C. P.: Ozone air quality during the 2008 Beijing Olympics: effectiveness of emission restrictions, Atmos. Chem. Phys., 9, 5237–5251, doi:10.5194/acp-9-5237-2009, 2009.
30
dur-ACPD
15, 6337–6372, 2015NOx emission
estimates during the 2014 Youth Olympic
Games in Nanjing
J. Ding et al.
Title Page
Abstract Introduction
Conclusions References
Tables Figures
◭ ◮
◭ ◮
Back Close
Full Screen / Esc
Printer-friendly Version Interactive Discussion
Discussion
P
a
per
|
Discussion
P
a
per
|
Discussion
P
a
per
|
Discussion
P
a
per
|
ing the 2008 Beijing Olympics and Paralympics, Geophys. Res. Lett., 36, L17803, doi:10.1029/2009GL039236, 2009.
Zhang, H., Sun, Z., Zhen, Y., Zhang, X., and Yu, B.: Impact of temperature change on urban electric power load in Nanjing, Trans. Atmos. Sci., 32, 536–542, 2009.
Zhang, Q., Streets, D. G., He, K., Wang, Y., Richter, A., Burrows, J. P., Uno, I.,
5
Jang, C. J., Chen, D., Yao, Z., and Lei, Y.: NOx emission trends for China, 1995–2004: the view from the ground and the view from space, J. Geophys. Res., 112, D22306, doi:10.1029/2007JD008684, 2007.
Zhang, Q., Streets, D. G., Carmichael, G. R., He, K. B., Huo, H., Kannari, A., Klimont, Z., Park, I. S., Reddy, S., Fu, J. S., Chen, D., Duan, L., Lei, Y., Wang, L. T., and Yao, Z. L.: Asian
10
emissions in 2006 for the NASA INTEX-B mission, Atmos. Chem. Phys., 9, 5131–5153, doi:10.5194/acp-9-5131-2009, 2009.
Zhao, C. and Wang, Y.: Assimilated inversion of NOx emissions over east Asia using OMI NO2column measurements, Geophys. Res. Lett., 36, L06805, doi:10.1029/2008GL037123, 2009.
ACPD
15, 6337–6372, 2015NOx emission
estimates during the 2014 Youth Olympic
Games in Nanjing
J. Ding et al.
Title Page
Abstract Introduction
Conclusions References
Tables Figures
◭ ◮
◭ ◮
Back Close
Full Screen / Esc
Printer-friendly Version Interactive Discussion
Discussion
P
a
per
|
Discussion
P
a
per
|
Discussion
P
a
per
|
Discussion
P
a
per
|
Table 1.Air quality regulations taken by the Nanjing authorities in the year of YOG2014.
Period Regulations
1 May–30 Jun The local government started to shut down the coal-burning facto-ries.
1 Jul–15 Jul All coal-burning factories have been shut down.
16–31 Jul The work on one third of construction sites was stopped. The parking fees in downtown increased sevenfold.
1–15 Aug The work on 2000 construction sites was stopped. Heavy-industry factories reduced manufacturing by 20 %. Vehicles with high emis-sions were banned from the city. Open space barbecue restaurants were closed. 900 electric buses and 500 taxis have been put into operation.
ACPD
15, 6337–6372, 2015NOx emission
estimates during the 2014 Youth Olympic
Games in Nanjing
J. Ding et al.
Title Page
Abstract Introduction
Conclusions References
Tables Figures
◭ ◮
◭ ◮
Back Close
Full Screen / Esc
Printer-friendly Version Interactive Discussion
Discussion
P
a
per
|
Discussion
P
a
per
|
Discussion
P
a
per
|
Discussion
P
a
per
|
Table 2.Redistribution of MEIC sectors over SNAP 97 sectors.
MEIC sectors Power Industry Transport Residential Agriculture
SNAP 97 sectors
Combustion in energy and transformation industries
1 – – – –
Non-industrial combustion plants – – – 1 –
Combustion in manufacturing industry – 0.3 – – –
Production process – 0.3 – – –
Extraction and distribution of fossil fuels and geothermal energy
– 0.4 – – –
Solvent and other product use – – – – –
Road transport – – 1 – –
Other mobile sources and machinery – – – – –
Waste treatment and disposal – – – – –
Agriculture – – – – 1
ACPD
15, 6337–6372, 2015NOx emission
estimates during the 2014 Youth Olympic
Games in Nanjing
J. Ding et al.
Title Page
Abstract Introduction
Conclusions References
Tables Figures
◭ ◮
◭ ◮
Back Close
Full Screen / Esc
Printer-friendly Version Interactive Discussion
Discussion
P
a
per
|
Discussion
P
a
per
|
Discussion
P
a
per
|
Discussion
P
a
per
|
Figure 1.The diurnal cycle in Nanjing from January to August 2014 according in-situ
ACPD
15, 6337–6372, 2015NOx emission
estimates during the 2014 Youth Olympic
Games in Nanjing
J. Ding et al.
Title Page
Abstract Introduction
Conclusions References
Tables Figures
◭ ◮
◭ ◮
Back Close
Full Screen / Esc
Printer-friendly Version Interactive Discussion
Discussion
P
a
per
|
Discussion
P
a
per
|
Discussion
P
a
per
|
Discussion
P
a
per
|
Figure 2.The comparison of the absolute OmF (1015molecules cm−2
ACPD
15, 6337–6372, 2015NOx emission
estimates during the 2014 Youth Olympic
Games in Nanjing
J. Ding et al.
Title Page
Abstract Introduction
Conclusions References
Tables Figures
◭ ◮
◭ ◮
Back Close
Full Screen / Esc
Printer-friendly Version Interactive Discussion
Discussion
P
a
per
|
Discussion
P
a
per
|
Discussion
P
a
per
|
Discussion
P
a
per
|
Figure 3.The time series of the OmF from January 2013 to September 2014. The error bar is
ACPD
15, 6337–6372, 2015NOx emission
estimates during the 2014 Youth Olympic
Games in Nanjing
J. Ding et al.
Title Page
Abstract Introduction
Conclusions References
Tables Figures
◭ ◮
◭ ◮
Back Close
Full Screen / Esc
Printer-friendly Version Interactive Discussion
Discussion
P
a
per
|
Discussion
P
a
per
|
Discussion
P
a
per
|
Discussion
P
a
per
|
Figure 4.The comparison of the CHIMERE v2013 forecast (left) with OMI satellite observations
ACPD
15, 6337–6372, 2015NOx emission
estimates during the 2014 Youth Olympic
Games in Nanjing
J. Ding et al.
Title Page
Abstract Introduction
Conclusions References
Tables Figures
◭ ◮
◭ ◮
Back Close
Full Screen / Esc
Printer-friendly Version Interactive Discussion
Discussion
P
a
per
|
Discussion
P
a
per
|
Discussion
P
a
per
|
Discussion
P
a
per
|
Tianjin, Wuhan, Xi’an,
a. April to September 2013 b. October 2013 to March 2014
Figure 6.The distribution of the OmF values over 15 polluted cities in summer(a)and in winter