ACPD
13, 17519–17544, 2013Regional nitrogen oxides emission trends in East Asia observed from space
B. Mijling et al.
Title Page
Abstract Introduction
Conclusions References
Tables Figures
◭ ◮
◭ ◮
Back Close
Full Screen / Esc
Printer-friendly Version
Interactive Discussion
Discussion
P
a
per
|
D
iscussion
P
a
per
|
Discussion
P
a
per
|
Discuss
ion
P
a
per
|
Atmos. Chem. Phys. Discuss., 13, 17519–17544, 2013 www.atmos-chem-phys-discuss.net/13/17519/2013/ doi:10.5194/acpd-13-17519-2013
© Author(s) 2013. CC Attribution 3.0 License.
Atmospheric Chemistry and Physics
Open Access
Discussions
Geoscientiic Geoscientiic
Geoscientiic Geoscientiic
This discussion paper is/has been under review for the journal Atmospheric Chemistry and Physics (ACP). Please refer to the corresponding final paper in ACP if available.
Regional nitrogen oxides emission trends
in East Asia observed from space
B. Mijling1, R. J. van der A1, and Q. Zhang2
1
Royal Netherlands Meteorological Institute (KNMI), Department of Climate Observations, P.O. Box 201, 3730 AE De Bilt, the Netherlands
2
Center for Earth System Science, Tsinghua University, Beijing 100084, China
Received: 23 April 2013 – Accepted: 4 June 2013 – Published: 3 July 2013
Correspondence to: B. Mijling (mijling@knmi.nl)
ACPD
13, 17519–17544, 2013Regional nitrogen oxides emission trends in East Asia observed from space
B. Mijling et al.
Title Page
Abstract Introduction
Conclusions References
Tables Figures
◭ ◮
◭ ◮
Back Close
Full Screen / Esc
Printer-friendly Version
Interactive Discussion
Discussion
P
a
per
|
D
iscussion
P
a
per
|
Discussion
P
a
per
|
Discuss
ion
P
a
per
|
Abstract
Due to changing economic activity, emissions of air pollutants in East Asia change rapidly in space and time. Monthly emission estimates of nitrogen oxides derived from satellite observations provide valuable insight in the evolution of anthropogenic activity on a regional scale. We present the first results of a new emission estimation algo-5
rithm, specifically designed to use daily satellite observations of column concentrations for fast updates of emissions of short-lived atmospheric constituents on a mesoscopic scale (∼0.25◦×0.25◦). The algorithm is used to construct a monthly NOxemission time series for 2007–2011 from tropospheric NO2 observations of GOME-2 for East Chi-nese provinces and surrounding countries. The new emission estimates correspond 10
well with the bottom-up inventory of EDGAR v4.2, but are smaller than the inventories of INTEX-B and MEIC. They reveal a strong positive trend during 2007–2011 for almost all Chinese provinces, related to the country’s economic development. We find a 41 % increment of NOxemissions in East China during this period, which shows the need to update emission inventories in this region on a regular basis. Negative emission trends 15
are found in Japan and South Korea, which can be attributed to a combined effect of local environmental policy and global economic crises. Analysis of seasonal variation distinguishes between regions with dominant anthropogenic or biogenic emissions. For regions with a mixed anthropogenic and biogenic signature, the opposite season-ality can be used for an estimation of the separate emission contributions. Finally, the 20
ACPD
13, 17519–17544, 2013Regional nitrogen oxides emission trends in East Asia observed from space
B. Mijling et al.
Title Page
Abstract Introduction
Conclusions References
Tables Figures
◭ ◮
◭ ◮
Back Close
Full Screen / Esc
Printer-friendly Version
Interactive Discussion
Discussion
P
a
per
|
D
iscussion
P
a
per
|
Discussion
P
a
per
|
Discuss
ion
P
a
per
|
1 Introduction
The Chinese economy grew rapidly over the past two decades. The unprecedented increase in energy demand, industrial production, urbanization and car ownership has resulted in significantly increasing air pollutant emissions, and has changed geograph-ical emission patterns. These changes are not adequately described by bottom-up 5
emission inventories, which, despite the sustained efforts to provide complete and ac-curate databases, are easily out-dated. Especially the emission estimates of short-living species as NO2, SO2 and PM allow for the monitoring of emission trends, giving important insight in the environmental impact of socio-economic events.
For SO2, the most important sources are point sources by power plants and heavy 10
industry. Li et al. (2010) finds that the SO2 trend is in line with the NO2 trend during 2005–2007. Afterwards, however, a sharp drop is observable from spaceborn obser-vations, due to installation of flue-gas desulphurisation devices on power plants and phasing out of small power generating units. The Chinese Ministry of Environmental Protection reports a 9 % reduction of total SO2emissions during 2005–2009 (Li et al., 15
2010).
Based on aerosol optical depth data from OMI, Lin et al. (2010a) see a rapid growth of PM2.5 concentrations over northeast China in October 2004–September 2008, de-spite national efforts to control emissions of primary PM and SO2. The growth is at-tributed to increased formation of secondary aerosols by increased emissions of pre-20
cursors such as NH3, volatile organic compounds, and – most importantly – NOx. The total Chinese emissions of anthropogenic NOx showed an increase from 3.8 Tg N yr−1
in 2000 (Zhang et al., 2007) to 6.3 Tg N yr−1
in 2006 (Zhang et al., 2009a). The economic downturn, which affected Chinese economy between late 2008 and late 2009, caused a decrease in emissions of 20 % when comparing January 2008 with 25
ACPD
13, 17519–17544, 2013Regional nitrogen oxides emission trends in East Asia observed from space
B. Mijling et al.
Title Page
Abstract Introduction
Conclusions References
Tables Figures
◭ ◮
◭ ◮
Back Close
Full Screen / Esc
Printer-friendly Version
Interactive Discussion
Discussion
P
a
per
|
D
iscussion
P
a
per
|
Discussion
P
a
per
|
Discuss
ion
P
a
per
|
compared with the emissions in the months before the event (Mijling et al., 2009; Mijling and Van der A, 2012). For the World Expo 2010 in Shanghai also air quality measures were taken, which, according to Hao et al. (2011), resulted in a decrease of 8 % of NO2 over the city during May–October 2010 when compared to mean NO2 concentrations of the same period in the three previous years.
5
In this study, we use the Daily Emission estimates Constrained by Satellite Ob-servations (DECSO) algorithm to construct monthly NOx emission estimates based on GOME-2 observations of tropospheric NO2 between 2007 and 2011. The yearly emission totals for East China are compared with other satellite derived estimates and bottom-up inventories in Sect. 3. The relative high resolution of the emission estimates 10
enables us to assess the evolution of NOx emissions of individual Chinese provinces and peripheral countries. Applying a trend model to the monthly emission time series reveals regional differences in emission trends (Sect. 4.1) and seasonalities (Sect. 4.2). In Sect. 5, the non-local concentration/emission relationships are used to quantify the transport effect of regional NOx emissions on tropospheric NO2 concentrations else-15
where.
2 The DECSO algorithm applied to East Asia
The DECSO algorithm (Mijling and Van der A, 2012) is specifically designed to use daily satellite observations of column concentrations for fast updates of emission esti-mates of short-lived atmospheric constituents on a mesoscopic scale (0.25◦×0.25◦). 20
Central in the algorithm is the approximation of the sensitivity Hi j of a NO2 column concentrationcin grid celli on the mean emissionein grid cellj:
Hi j=dc
NO2 i
deNOx
j
=γiaj ai
T
Z
0
exp(−t/τ
ACPD
13, 17519–17544, 2013Regional nitrogen oxides emission trends in East Asia observed from space
B. Mijling et al.
Title Page
Abstract Introduction
Conclusions References
Tables Figures
◭ ◮
◭ ◮
Back Close
Full Screen / Esc
Printer-friendly Version
Interactive Discussion
Discussion
P
a
per
|
D
iscussion
P
a
per
|
Discussion
P
a
per
|
Discuss
ion
P
a
per
|
The integral is taken over a time window [0,T] between two satellite overpasses (24 h).
Ωi j(t) describes the transport of NOx from cellj toi during [t,T], based on trajectory analysis. After emission, NOx is decayed with an effective lifetime τj. Modulation fac-torfj(t) relates the time dependent emissionse(t) to the daily averaged emission e: e(t)=f(t)e. The factoraj/ai accounts for the ratio in grid cell area, andγj represents 5
the NO2/NOx ratio. Lifetimeτj is found by minimizing the difference at t=T between the NOx columns of the chemical transport model (CTM) and the NOx columns cal-culated with the transport kernelΩ. The sensitivities Hare interpolated to the satellite footprints and are corrected for by the averaging kernel of the retrieval method. A de-tailed description can be found in (Mijling and Van der A, 2012). For short lived species 10
such as NOx,His a sparse matrix, facilitating a fast calculation of the inversion by data assimilation, in our case a Kalman filter.
We use the DECSO algorithm together with the regional CTM CHIMERE (Schmidt et al., 2001; Bessagnet et al., 2004), driven by operational meteorological forecast of the European Centre for Medium-Range Weather Forecasts (ECWMF). The CTM is 15
adjusted for application on a 0.25◦ resolution covering East China from 18◦N to 50◦N and 102◦E to 132◦E, as described in more detail by Mijling et al. (2009).
Tropospheric NO2 column retrievals are calculated with the DOMINO v2 algorithm (Boersma et al., 2011) for the GOME-2 satellite instrument from spectral measure-ments between 426–451 nm. Cloud fraction and cloud height are derived from the 20
oxygen-A band (Koelemeijer et al., 2001). NO2retrievals at cloud fractions larger than 20 % are filtered out to reduce the influence of the modelled NO2 column below the clouds. Retrievals with low clouds (below 800 hPa) are also rejected because the in-tersection of the cloud with the NOx bulk makes the retrieval too sensitive for the exact cloud height.
25
ACPD
13, 17519–17544, 2013Regional nitrogen oxides emission trends in East Asia observed from space
B. Mijling et al.
Title Page
Abstract Introduction
Conclusions References
Tables Figures
◭ ◮
◭ ◮
Back Close
Full Screen / Esc
Printer-friendly Version
Interactive Discussion
Discussion
P
a
per
|
D
iscussion
P
a
per
|
Discussion
P
a
per
|
Discuss
ion
P
a
per
|
size of the GOME-2 foot print (∼40 km×80 km) is smaller than the smallest province area under consideration, which prevents the attribution of emissions to neighbouring provinces.
The quality of the estimated emissions depends on the quality of the satellite obser-vation, the model simulation and the inversion scheme. Lin (2012) show that modelled 5
NO2columns are especially sensitive to the correct cloud optical depth and the uptake rate of HO2 on aerosols. In their setting (GEOS-Chem simulations at OMI overpass time), NO2 emissions can be overestimated by 8 % (in winter) to 18 % (in summer), due to underestimated NO2 column simulations. It is unclear, however, how these re-sults translate to our setup (an elaborate bias analysis will be subject for future study). 10
A positive emission bias during summer is plausible, as CHIMERE also underestimates NO2column in summer with respect to OMI (Huijnen et al., 2010). However, the earlier overpass time of GOME-2 might reduce this effect. Note that relative emission trends are unlikely to be affected by biases.
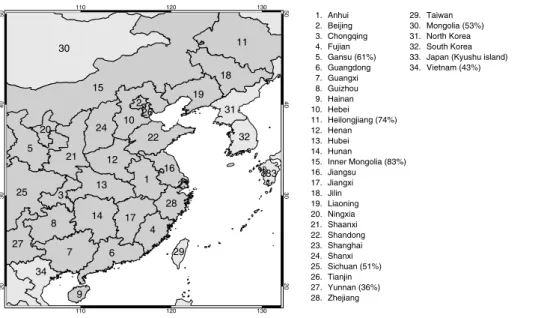
Figure 1 shows the model domain that is completely or partially covering 28 15
provinces of mainland China, which (according to the EDGAR v4.2 inventory, EC-JRC/PBL, 2011) accounts for approximately 94 % of the total Chinese anthropogenic emissions. Apart from East China, the domain contains North and South Korea, Japanese Kyushu Island, and significant parts of Mongolia and Vietnam.
3 Comparison of DECSO NOxestimates with other inventories
20
The yearly emission totals for East China by the DECSO algorithm for 2007 to 2011 are listed in the first row of Table 1. Direct comparison with other space derived emission estimates found in literature is troubled by the different periods and regions which are considered.
Miyazaki et al. (2012) found 5.0 Tg N yr−1for East China in 2005, for a 4 month mean 25
ACPD
13, 17519–17544, 2013Regional nitrogen oxides emission trends in East Asia observed from space
B. Mijling et al.
Title Page
Abstract Introduction
Conclusions References
Tables Figures
◭ ◮
◭ ◮
Back Close
Full Screen / Esc
Printer-friendly Version
Interactive Discussion
Discussion
P
a
per
|
D
iscussion
P
a
per
|
Discussion
P
a
per
|
Discuss
ion
P
a
per
|
an emission time series with the IMAGES CTM and its adjoint code, based on a com-bined record of GOME and SCIAMACHY observations between 1997 and 2006. Total Chinese emissions in 1997 were found to be 3.33 Tg N yr−1, with an annual growth rate of 7.3 % yr−1, which results in 5.52 Tg N yr−1for China in 2006. Lin (2012) used OMI re-trievals for 2006 together with the GEOS-Chem model. They estimated the emissions 5
to be 7.06 Tg N yr−1 for anthropogenic sources in East China in 2006. However, this number might be overestimated by 8–18 % due to errors in their model simulations (Lin et al., 2012). Zhao and Wang (2009) found 7.48 Tg N yr−1 for fossil fuel emissions in China (6.78 Tg N yr−1for East China) in July 2007, based on local inversion of OMI ob-servations using the method by Martin et al. (2003) in combination with the REAM CTM. 10
Lin et al. (2010b) used the difference in overpass time between GOME-2 and OMI to estimate NOx emissions. For July 2008, they found as best estimate 6.8 Tg N yr
−1 for China, and 5.5 Tg N yr−1for East China (103.75–123.75◦E, 19–45◦N).
The yearly emission totals by DECSO emission estimates have been compared with the bottom-up inventories INTEX-B (Zhang et al., 2009a), MEIC, EDGAR v4.2, and 15
REAS v1.1 (Ohara et al., 2007). The regional INTEX-B inventory contains Asian emis-sions in 2006 on a 0.2◦
resolution divided over the sectors power, industry, transport, and residential. In this study, it is also used as initial emission inventory for the DECSO algorithm. The MEIC inventory developed by Tsinghua University contains monthly emissions for China, and is available on a 0.25◦
resolution for 2008 and 2010 through 20
http://www.meicmodel.org. MEIC does not contain emission information outside China. The global EDGAR v4.2 inventory contains yearly emission totals for the period 1970 to 2008 on a 0.1◦
resolution. Only the last two years (referred to as EDGAR 2007 and EDGAR 2008) are of interest for comparison with the DECSO estimates. The REAS inventory describes emissions in Asia on a 0.5◦resolution. It uses 2000 as a base year 25
ACPD
13, 17519–17544, 2013Regional nitrogen oxides emission trends in East Asia observed from space
B. Mijling et al.
Title Page
Abstract Introduction
Conclusions References
Tables Figures
◭ ◮
◭ ◮
Back Close
Full Screen / Esc
Printer-friendly Version
Interactive Discussion
Discussion
P
a
per
|
D
iscussion
P
a
per
|
Discussion
P
a
per
|
Discuss
ion
P
a
per
|
The bottom-up inventories cover only anthropogenic emissions, whereas the DECSO emission totals include both anthropogenic and biogenic sources. However, due to strong industrial activity, NOx emissions in East China are predominantly an-thropogenic. Lin (2012) estimate that biogenic emissions of lightning and soil account for less than 6 % of the total emissions in East China, annually. In July, when lightning 5
and soil emissions are most dominant, a contribution of 9 % and 12 % respectively of total emissions is found. Areas with important biogenic sources are mostly found in In-ner Mongolia and West China. Anthropogenic emissions are largest in cities and areas with extensive use of coal.
As can be seen in Table 1, there is reasonable agreement between the EDGAR 10
2007 and EDGAR 2008 NOx inventory with the corresponding estimates from space by the DECSO algorithm, which gives confidence in the results. However, the DECSO estimates are significantly smaller than the NOxinventories of INTEX-B and MEIC. On the other hand, the DECSO emissions are larger than the projected REAS emissions. Apparently, the REAS scenarios underestimate the development of NOx emissions in 15
East China. According to the DECSO estimates, the NOx emission estimates for East China increased by 41 % between 2007 and 2011, which shows the need for regular updates of East Asian emission inventories.
Of the 28 provinces, DECSO 2007 estimates for 8 provinces are within 10 % of the INTEX-B 2006 inventory. 4 provinces are estimated higher, and 16 are estimated lower. 20
Compared to the EDGAR 2007 inventory, for 7 provinces the DECSO 2007 results are within 10 %; 11 are estimated higher, and 10 are estimated lower.
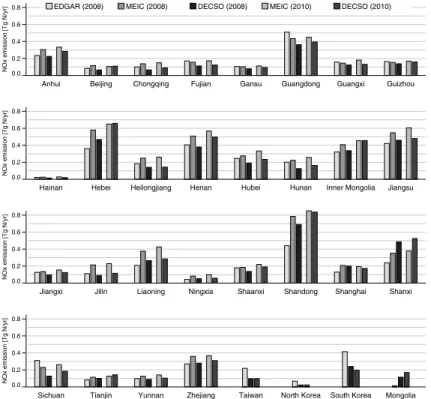
Figure 2 shows the comparison between the different inventories for economically important Chinese provinces and some neighbouring countries. In general, a reason-able agreement is found between the MEIC inventory and DECSO. Some areas with 25
ACPD
13, 17519–17544, 2013Regional nitrogen oxides emission trends in East Asia observed from space
B. Mijling et al.
Title Page
Abstract Introduction
Conclusions References
Tables Figures
◭ ◮
◭ ◮
Back Close
Full Screen / Esc
Printer-friendly Version
Interactive Discussion
Discussion
P
a
per
|
D
iscussion
P
a
per
|
Discussion
P
a
per
|
Discuss
ion
P
a
per
|
large coal deposit, industry in Shanxi is centred around heavy industries such as power generation and metal refining. The emission differences might originate from industrial activity which is unaccounted for in the bottom-up inventories. In Mongolia, the DECSO estimates are significant larger than EDGAR. This is however partly due to the fact that DECSO estimates include biogenic emissions, which in Mongolia are of importance 5
(see Sect. 4.2), but are not accounted for in the bottom-up anthropogenic inventory.
4 Emission time series analysis
Analogous to the trend analysis of NO2concentrations by van der A et al. (2006, 2008), we describe the monthly DECSO NOx emission time series E(t) with a trend model which contains a linear trend and a seasonal cycle:
10
E(t)=E0+ 1
12Bt+Asin(ωt+ϕ)+r(t) (2)
wheret represents the number of months after January 2007, r(t) is the residue (the part of the emission that is unexplained by the fit function).E0,B,A,ϕare the fit param-eters of the model. The angular frequencyωis takenπ/6, representing a periodicity of one year.E0is the emission offset,B is the annual trend in emissions,Ais the ampli-15
tude of the seasonal cycle,ϕis the phase of the seasonality (ϕ=π/2 corresponding to a maximum in January,ϕ=−π/2 corresponding to a maximum in July). The abso-lute error on the monthly estimates is taken a constant valueσ. To compensate for the spin-up error of the algorithm due to wrong initial emissions, we increase the error for January 2007 to 3σ, and decrease the error linearly toσin the 4 following months. 20
ACPD
13, 17519–17544, 2013Regional nitrogen oxides emission trends in East Asia observed from space
B. Mijling et al.
Title Page
Abstract Introduction
Conclusions References
Tables Figures
◭ ◮
◭ ◮
Back Close
Full Screen / Esc
Printer-friendly Version
Interactive Discussion
Discussion
P
a
per
|
D
iscussion
P
a
per
|
Discussion
P
a
per
|
Discuss
ion
P
a
per
|
4.1 Linear trend in NOxemissions
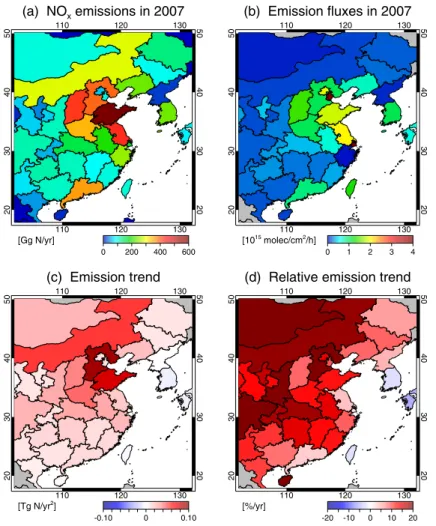
The linear trend results for the East Chinese provinces and peripheral countries are shown in Fig. 3. The largest NOx emitting provinces are clustered in northeast China: Shandong (606 Gg N yr−1
), Jiangsu (431 Gg N yr−1
), Shanxi (423 Gg N yr−1 ), Hebei (395 Gg N yr−1), followed by Guangdong (361 Gg N yr−1) in south China.
5
All provinces of mainland China show positive trends for the 2007–2011 pe-riod. In absolute sense, the strongest increase of NOx emissions are found in Hebei (91 Gg N yr−2), Shandong (77 Gg N yr−2), Inner Mongolia (55 Gg N yr−2), and Henan (44 Gg N yr−2). NOx emission growth rates over 20 % are found for Shaanxi (24.6 % yr−1), Hebei (23.2 % yr−1), Hainan (22.5 % yr−1), and Sichuan (21.8 % yr−1). 10
The strong relative emission growth in peripheral provinces might reflect that they are catching up economically with the richer areas of China. In relative sense, the strongest increase of NOxemissions is found in East Mongolia (24.7 % yr
−1 ).
The linear trend model does not work well for Beijing, due to the trend break during the Olympic Games in 2008 (see Sect. 5.3). The absolute emission trend for the entire 15
2007–2011 period is 9 Gg N yr−2, but is in fact higher for the last three years.
Shanghai has the largest NOx emission flux of all Chinese provinces: it is estimated to be 8.8×10¹⁵molecules cm−2h−1 in 2007. Between 2007 and 2010 its population increased from 18 to 23 million inhabitants, and private car ownership increased from 2 million in 2004 to 3.1 million in 2010 (Chen and Zhao, 2013). However, Shanghai does 20
not show a significant emission trend. One of the reasons for this atypical disagreement between growth and emissions might be the effectiveness of local air quality measures, such as vehicle emission control and the migration of coal-fired power plants away from the metropolitan area (Wang et al., 2012).
NOxemissions in Inner Mongolia are dominated by power plants and heavy industry. 25
ACPD
13, 17519–17544, 2013Regional nitrogen oxides emission trends in East Asia observed from space
B. Mijling et al.
Title Page
Abstract Introduction
Conclusions References
Tables Figures
◭ ◮
◭ ◮
Back Close
Full Screen / Esc
Printer-friendly Version
Interactive Discussion
Discussion
P
a
per
|
D
iscussion
P
a
per
|
Discussion
P
a
per
|
Discuss
ion
P
a
per
|
additional 18.6 GW electricity production from coal-fired power plants was installed in Inner Mongolia, which increased the NOx emissions by power plants by 51 % in this province (Wang et al., 2012).
Negative trends are found for the Japanese Kyushu island (−5.6 % yr−1), for South Korea (−2.2 % yr−1), and for Taiwan (−2.1 % yr−1). These trends can be attributed to 5
a combined effect of local environmental policy and global economic crisis since 2008.
4.2 Seasonal variability of NOxemissions
In most regions a distinct seasonal cycle in NOx emissions is found, as is illustrated in Fig. 4. This variability can be used to derive more information about the dominant emission source. Van der A et al. (2006) showed that anthropogenic sources cause 10
NO2 concentration to peak in wintertime, while soil emissions peak in summertime. Biomass burning is an unimportant source of NOx in East China (Wang et al., 2007), contributing less than 2 % to the total emissions.
In regions with dominant anthropogenic emissions, such as Hebei and Shandong, we find that emissions peak typically in February–March. Anthropogenic emission totals 15
in the MEIC inventory typically peak in January as is expected, which might indicate that our method introduces a time lag of about 1 month in its response to emission changes. Important biogenic emissions are found in e.g. Mongolia, where grasslands dominate 97 % of the country. Soil emissions of NOx are related to the rainy season: 70–80 % of the annual precipitation falls as rain in the summer season, with a maximum 20
in August (Iwasaki, 2005). Lightning emissions of NOx are not dominant (Van der A, 2006). Again, a time delay of about one month in the observed seasonal emission peaks (September 2007, August 2008, September 2009, September 2010, September 2011) is observed. The underlying linear trend in Mongolia is associated to increasing anthropogenic emissions.
25
In Inner Mongolia both anthropogenic and biogenic sources are of importance. The positive linear trend (19.1 % yr−1
ACPD
13, 17519–17544, 2013Regional nitrogen oxides emission trends in East Asia observed from space
B. Mijling et al.
Title Page
Abstract Introduction
Conclusions References
Tables Figures
◭ ◮
◭ ◮
Back Close
Full Screen / Esc
Printer-friendly Version
Interactive Discussion
Discussion
P
a
per
|
D
iscussion
P
a
per
|
Discussion
P
a
per
|
Discuss
ion
P
a
per
|
The lack of a strong seasonal cycle can be explained by the trend being a mixed signal of anthropogenic and biogenic emissions. The opposite seasonality of these sources can be used for a rough estimate of the separate anthropogenic emissions and bio-genic emissions. Using Eq. (2), we can write anthropobio-genic emissionsEaas:
Ea=E0a+ 1
12B at
+Aacosωt (3)
5
The biogenic emissionsEbcan be written as
Eb=E0b(1−cosωt) (4)
assuming that they are perfectly anti-cyclic with anthropogenic emissions, that they have no trend, and that there are no emissions in winter. The yearly averaged biogenic emission isE0b. The total emissionE can now be written as:
10
E=(E0a+E0b)+ 1
12B at
+(Aa−Eb
0) cosωt (5)
The 10 provinces with dominant anthropogenic emissions which peak at February– March (Anhui, Hebei, Henan, Jiangsu, Jiangxi, Shaanxi, Shandong, and Tianjin) ex-hibit a remarkably constant ratio r between amplitude and offset for anthropogenic emissions:Aa=rE0a, withr=0.25±0.08. Using this relation, and assuming that the fit 15
results for Mongolia and Inner Mongolia are adequately described by Eq. (5), we can separate the biogenic from the anthropogenic contribution. We find for East Mongolia (i.e. the 53 % within the model domain) an average biogenic emission of 56 Gg N yr−1
, and an anthropogenic emission in 2007 of 41 Gg N yr−1 with an absolute trend of 24 Gg N yr−2. For Inner Mongolia (i.e. the 83 % within the model domain), we find an 20
average biogenic emission of 65 Gg N yr−1
ACPD
13, 17519–17544, 2013Regional nitrogen oxides emission trends in East Asia observed from space
B. Mijling et al.
Title Page
Abstract Introduction
Conclusions References
Tables Figures
◭ ◮
◭ ◮
Back Close
Full Screen / Esc
Printer-friendly Version
Interactive Discussion
Discussion
P
a
per
|
D
iscussion
P
a
per
|
Discussion
P
a
per
|
Discuss
ion
P
a
per
|
5 Non-local contribution to tropospheric NO2
In the DECSO algorithm, the relation between the observable tropospheric NO2column cat footprinti at timet=T and the mean NOx emissionsein grid cellj during time interval [0,T] is described as:
ci(T)=bi+ n
X
j=1
Ψi jej ≡bi+ n
X
j=1
pi j (6)
5
bi represents the part of the NO2column which has been emitted before this time in-terval (i.e. having an age larger thanT), and whose relation with emission sources is not accounted for. The summation sums over allngrid cells. MatrixΨ represents the sensitivity matrix Hfrom Eq. (1) after interpolating towards the observation footprints and applying the averaging kernel (see Mijling and Van der A (2012)). The quantity 10
pi j= Ψi jej can be regarded as the partial NO2column in footprinti due to NOx emis-sions in grid cellj during [0,T]. This can be used to study the origin of the tropospheric NO2observed in a certain region.
The mean observed tropospheric column for a regionR frommobservations can be written as an weighted average:
15
cR = m
X
i=1
wici ≡bR+ n
X
j=1
pR,j, with m
X
i=1
wi =1 (7)
in whichwi corrects for the fraction of the footprint coveringR (wi =0 if the footprint is completely outsideR). The mean partial column observed in regionR originating from emissions in a source regionS is obtained by summation over all grid cells associated withS:
20
cR,S=
X
j∈S pR,j =
X
j∈S n
X
i=1
ACPD
13, 17519–17544, 2013Regional nitrogen oxides emission trends in East Asia observed from space
B. Mijling et al.
Title Page
Abstract Introduction
Conclusions References
Tables Figures
◭ ◮
◭ ◮
Back Close
Full Screen / Esc
Printer-friendly Version
Interactive Discussion
Discussion
P
a
per
|
D
iscussion
P
a
per
|
Discussion
P
a
per
|
Discuss
ion
P
a
per
|
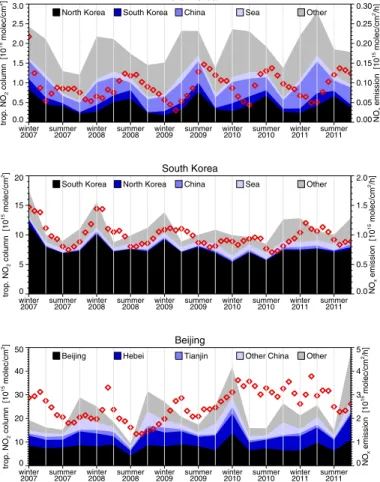
We use this relation to study the origin of the tropospheric NO2 over North Korea, South Korea, and Beijing during 2007–2011. To get sufficient sampling of the selected regions (all observations with a cloud fraction larger than 20 % are filtered out), we look at quarterly averages of NO2.
Note that Eq. (8) calculates the direct contribution to regionRfrom source regionS, 5
i.e. the NOxwhich has been emitted during [0,T] before observation. The time interval corresponds to the times between two satellite overpasses, i.e.T =24 h. It does not account for NOx which has been emitted before this time window, or NOx which has been transported in reservoir species such as PAN. Theoretically, based on sensitivity matricesHfrom previous periods, the source regions of the background fieldbcould 10
be resolved. This information, however, we have not stored during the processing.
5.1 North Korea
As can be seen in Fig. 5, mean emissions in North Korea are small compared to in-dustrialized countries. Emissions are high in the first three months, due to an overesti-mation of the initial emissions by INTEX-B, and the time the DECSO algorithm needs 15
to adjust to the new emission levels. North Korean emission peaks are in summer time, as are the associated concentration maxima. This is characteristic for dominating biogenic soil emissions; see Van der A et al. (2008). The total NO2 concentrations, however, usually peak in wintertime, indicating that a significant part of NO2 in the North Korean troposphere is from anthropogenic origin, imported from elsewhere. 20
Local emissions of NOx account for 22 % of the average tropospheric NO2 concen-trations in North Korea. The Chinese contribution to the NO2 concentration in North Korea is at least 21 %. Due to predominant northwest winds, they originate mainly from emissions in Liaoning province, where the city of Shenyang is a strong source. South Korea contributes at least 7 %, mainly originating from the Seoul area, which is 25
cor-ACPD
13, 17519–17544, 2013Regional nitrogen oxides emission trends in East Asia observed from space
B. Mijling et al.
Title Page
Abstract Introduction
Conclusions References
Tables Figures
◭ ◮
◭ ◮
Back Close
Full Screen / Esc
Printer-friendly Version
Interactive Discussion
Discussion
P
a
per
|
D
iscussion
P
a
per
|
Discussion
P
a
per
|
Discuss
ion
P
a
per
|
responding tobR in Eq. (7). Because it is unknown how its origin is distributed over the different source areas, the above-mentioned fractions are lower limit values.
Based on the 9 yr dataset of tropospheric NO2retrievals from SCIAMACHY between 2002 and 2011, Schneider and Van der A (2012) find a relative trend of 5–15 % yr−1 over North Korea. Since DECSO gives a trend in emissions in North Korea of only 6 %, 5
the concentration trend is most probably due to increased emissions in neighbouring China.
5.2 South Korea
NOx emissions in South Korea are 8–10 times higher than in North Korea, and have generally maxima in wintertime (apart from 2010). From 2008 onward they show 10
a downward trend of 2.2 % yr−1, related to economic recession. Local emissions con-tribute at least 68 % to tropospheric NO2. Contributions from China account for only 2 %, which is less than in North Korea in both relative and absolute sense. Winds also transport NO2 from shipping around the peninsula into South Korea, which accounts for at least 7 % of the average tropospheric NO2concentration.
15
5.3 Beijing
On average, 35 % of its tropospheric NO2originates from local emissions, and has an age less than 24 h. Because of the relative small size of Beijing, large part of its NO2 is emitted elsewhere. At least 23 % and 5 % come from its neighbouring provinces Hebei and Tianjin. 12 % of Beijing’s NO2 is imported from more remote provinces. 20
The average concentration shows a remarkable dip in summer 2008, related to the air quality measures taken for the Beijing Olympic Games. Compared with summer 2007, NO2 concentrations dropped 38 %. Contributions by local emissions dropped 45 %, while NO2due to emissions in Hebei, Tianjin, and other provinces dropped 38 %, 42 %, and 32 %, respectively. Compared to the previous summer, the emissions in Beijing 25
ACPD
13, 17519–17544, 2013Regional nitrogen oxides emission trends in East Asia observed from space
B. Mijling et al.
Title Page
Abstract Introduction
Conclusions References
Tables Figures
◭ ◮
◭ ◮
Back Close
Full Screen / Esc
Printer-friendly Version
Interactive Discussion
Discussion
P
a
per
|
D
iscussion
P
a
per
|
Discussion
P
a
per
|
Discuss
ion
P
a
per
|
in Hebei), showing that an important part of the improvement in air quality (in terms of NO2) was also due to favourable meteorological conditions. In the months after the events Beijing emissions start to rise steadily to reach a new record value in April 2011 (127 Gg N yr−1).
6 Conclusions
5
The DECSO estimates agree well with the bottom-up inventories of EDGAR v4.2 for 2007 and 2008, which gives confidence in the algorithm. However, estimates for 2008 and 2010 are generally lower than in the MEIC inventory. The projected NOx emission by REAS v1.1 for 2007–2010 are apparently too low. The DECSO estimates for 2011 are significantly higher for most provinces than the INTEX-B and EDGAR inventories 10
(the DECSO NOxemission estimates for East China increased by 41 % between 2007 and 2011), showing the need to update emission inventories in China on a regular basis.
Largest NOxemitting provinces are clustered in northeast China: Shandong, Hebei, Shanxi, Jiangsu, followed by Guangdong in south China. All provinces of mainland 15
China show positive trends for 2007–2011, due to the country’s economic development. Yearly emission growing rates over 20 % are found in Shaanxi, Hebei, Hainan, Sichuan, and Mongolia.
Probably due to air quality measures and the economic crisis, Japan, South Korea, and Taiwan show a negative relative trend of 5.6 % yr−1 for Japanese Kyushu island, 20
2.2 % yr−1 for South Korea, and 2.1 % yr−1 for Taiwan, taking 2007 as the reference year.
The seasonality of the emissions shows that anthropogenic emissions dominate in most Chinese provinces and peripheral countries. Emissions in Mongolia and Inner Mongolia, however, show a mixed anthropogenic and biogenic signature. The opposite 25
bio-ACPD
13, 17519–17544, 2013Regional nitrogen oxides emission trends in East Asia observed from space
B. Mijling et al.
Title Page
Abstract Introduction
Conclusions References
Tables Figures
◭ ◮
◭ ◮
Back Close
Full Screen / Esc
Printer-friendly Version
Interactive Discussion
Discussion
P
a
per
|
D
iscussion
P
a
per
|
Discussion
P
a
per
|
Discuss
ion
P
a
per
|
genic emissions (mostly by soil) contribute to 58 % and 23 % of the total NOxemissions in Mongolia and Inner Mongolia, respectively.
Emissions in North Korea are overestimated by bottom-up inventories. The relatively high NO2 concentrations over the country cannot be explained by its own NOx emis-sions. A significant part originates from emissions in China and South Korea. The North 5
Korean situation is a showcase of cross-boundary air pollution, and shows the impor-tance of taking into account the transport of trace gases in emission estimate algo-rithms studies.
NO2concentrations in South Korea are largely produced locally on land, although at least 7 % is originating from emissions at sea by ships.
10
Although Beijing produces large NOxemission by itself, at least 22 % and 5 % of the NO2 concentration is coming from neighbouring provinces Hebei and Tianjin. During the summer of the 2008 Olympic Games the mean NO2concentration over Beijing was reduced by 38 % with respect to the summer of 2007. The emissions in Beijing were however reduced by 19 %, showing that an important part of the improvement in air 15
quality (in terms of NO2) was also due to favourable meteorological conditions.
Acknowledgements. This research has been funded by the GlobEmission project, part of the Data User Element programme of the European Space Agency.
References
Bessagnet, B., Hodzic, A., Vautard, R., Beekmann, M., Cheinet, S., Honoré, C., Liousse, C.,
20
and Rouïl, L.: Aerosol modeling with CHIMERE – preliminary evaluation at the continental scale, Atmos. Environ., 38, 2803–2817, 2004.
Boersma, K. F., Eskes, H. J., Dirksen, R. J., van der A, R. J., Veefkind, J. P., Stammes, P., Huijnen, V., Kleipool, Q. L., Sneep, M., Claas, J., Leitão, J., Richter, A., Zhou, Y., and Brun-ner, D.: An improved tropospheric NO2column retrieval algorithm for the Ozone Monitoring
25
Instrument, Atmos. Meas. Tech., 4, 1905–1928, doi:10.5194/amt-4-1905-2011, 2011. Chen, X. and Zhao, J.: Bidding to drive: car license auction policy in Shanghai and its public
ACPD
13, 17519–17544, 2013Regional nitrogen oxides emission trends in East Asia observed from space
B. Mijling et al.
Title Page
Abstract Introduction
Conclusions References
Tables Figures
◭ ◮
◭ ◮
Back Close
Full Screen / Esc
Printer-friendly Version
Interactive Discussion
Discussion
P
a
per
|
D
iscussion
P
a
per
|
Discussion
P
a
per
|
Discuss
ion
P
a
per
|
EC-JRC/PBL: Emission Database for Global Atmospheric Research (EDGAR), release version 4.2. European Commission, Joint Research Centre (JRC)/Netherlands Environmental As-sessment Agency (PBL), available at: http://edgar.jrc.ec.europa.eu (last access: July 2013), 2011.
Iwasaki, H. and Nii, T.: The break in the Mongolian rainy season and its relation to the stationary
5
Rossby wave along the Asian jet, J. Climate, 19, 3394–3405, 2005.
Huijnen, V., Eskes, H. J., Poupkou, A., Elbern, H., Boersma, K. F., Foret, G., Sofiev, M., Valdebenito, A., Flemming, J., Stein, O., Gross, A., Robertson, L., D’Isidoro, M., Kiout-sioukis, I., Friese, E., Amstrup, B., Bergstrom, R., Strunk, A., Vira, J., Zyryanov, D., Mau-rizi, A., Melas, D., Peuch, V.-H., and Zerefos, C.: Comparison of OMI NO2 tropospheric
10
columns with an ensemble of global and European regional air quality models, Atmos. Chem. Phys., 10, 3273–3296, doi:10.5194/acp-10-3273-2010, 2010.
Koelemeijer, R., Stammes, P., Hovenier, J., and de Haan, J.: A fast method for retrieval of cloud parameters using oxygen A band measurements from the global ozone monitoring experiment, J. Geophys. Res., 106, 3475–3490, 2001.
15
Li, C., Zhang, Q., Krotkov, N. A., Streets, D. G., He, K., Tsay, S.-C., and Gleason, J. F.: Recent large reduction in sulfur dioxide emissions from Chinese power plants observed by the Ozone Monitoring Instrument, Geophys. Res. Lett., 37, L08807, doi:10.1029/2010GL042594, 2010. Lin, J.-T.: Satellite constraint for emissions of nitrogen oxides from anthropogenic, lightning and
soil sources over East China on a high-resolution grid, Atmos. Chem. Phys., 12, 2881–2898,
20
doi:10.5194/acp-12-2881-2012, 2012.
Lin, J.-T. and McElroy, M. B.: Detection from space of a reduction in anthropogenic emissions of nitrogen oxides during the Chinese economic downturn, Atmos. Chem. Phys., 11, 8171– 8188, doi:10.5194/acp-11-8171-2011, 2011.
Lin, J.-T., Nielsen, C. P., Zhao, Y., Lei, Y., Liu, Y., and McElroy, M. B.: Recent changes in
partic-25
ulate air pollution over China observed from space and the ground: effectiveness of emission control, Environ. Sci. Technol., 44, 7771–7776, doi:10.1021/es101094t, 2010a.
Lin, J.-T., McElroy, M. B., and Boersma, K. F.: Constraint of anthropogenic NOx emissions in China from different sectors: a new methodology using multiple satellite retrievals, Atmos. Chem. Phys., 10, 63–78, doi:10.5194/acp-10-63-2010, 2010b.
30
ACPD
13, 17519–17544, 2013Regional nitrogen oxides emission trends in East Asia observed from space
B. Mijling et al.
Title Page
Abstract Introduction
Conclusions References
Tables Figures
◭ ◮
◭ ◮
Back Close
Full Screen / Esc
Printer-friendly Version
Interactive Discussion
Discussion
P
a
per
|
D
iscussion
P
a
per
|
Discussion
P
a
per
|
Discuss
ion
P
a
per
|
oxides emissions, Atmos. Chem. Phys., 12, 12255–12275, doi:10.5194/acp-12-12255-2012, 2012.
Martin, R., Jacob, D., Chance, K., Kurosu, T., Palmer, P., and Evans, M.: Global inventory of nitrogen oxide emissions constrained by space-based observations of NO2columns, J. Geo-phys. Res., 108, 4537, doi:10.1029/2003JD003453, 2003.
5
Martin, R., Sioris, C., Chance, K., Ryerson, T., Bertram, T., Wooldridge, P., Cohen, R., Neu-man, J., Swanson, A., and Flocke, F.: Evaluation of space-based constraints on global ni-trogen oxide emissions with regional aircraft measurements over and downwind of eastern North America, J. Geophys. Res., 111, D15308, doi:10.1029/2005JD006680, 2006.
Mijling, B. and van der A, R. J.: Using daily satellite observations to estimate emissions
10
of short-lived air pollutants on a mesoscopic scale, J. Geophys. Res., 117, 2156–2202, doi:10.1029/2012JD017817, 2012.
Mijling, B., van der A, R. J., Boersma, K. F., Van Roozendael, M., De Smedt, I., and Kelder, H. M.: Reduction of NO2 detected from space during the 2008 Beijing Olympic Games, Geophys. Res. Lett., 36, L13801, doi:10.1029/2009GL038943, 2009.
15
Ohara, T., Akimoto, H., Kurokawa, J., Horii, N., Yamaji, K., Yan, X., and Hayasaka, T.: An Asian emission inventory of anthropogenic emission sources for the period 1980–2020, Atmos. Chem. Phys., 7, 4419–4444, doi:10.5194/acp-7-4419-2007, 2007.
Schmidt, H., Derognat, C., Vautard, R., and Beekmann, M.: A comparison of simulated and observed ozone mixing ratios for the summer of 1998 in Western Europe, Atmos. Environ.,
20
36, 6277–6297, 2001.
Schneider, P. and van der A, R. J.: A global single-sensor analysis of 2002–2011 tropo-spheric nitrogen dioxide trends observed from space, J. Geophys. Res., 117, D16309, doi:10.1029/2012JD017571, 2012.
van der A, R. J., Peters, D. H. M. U., Eskes, H. J., Boersma, K. F., Van Roozendael, M., De
25
Smedt, I., and Kelder, H. M.: Detection of the trend and seasonal variation in tropospheric NO2over China, J. Geophys. Res., 111, D12317, doi:10.1029/2005JD006594, 2006. van der A, R. J., Eskes, H. J., Boersma, K. F., van Noije, T. P. C., Van Roozendael, M., De
Smedt, I., Peters, D. H. M. U., Kuenen, J. J. P., and Meijer, E. W.: Trends, seasonal variability and dominant NOx source derived from a ten year record of NO2measured from space, J.
30
Geophys. Res., 113, D04302, doi:10.1029/2007JD009021, 2008.
ACPD
13, 17519–17544, 2013Regional nitrogen oxides emission trends in East Asia observed from space
B. Mijling et al.
Title Page
Abstract Introduction
Conclusions References
Tables Figures
◭ ◮
◭ ◮
Back Close
Full Screen / Esc
Printer-friendly Version
Interactive Discussion
Discussion
P
a
per
|
D
iscussion
P
a
per
|
Discussion
P
a
per
|
Discuss
ion
P
a
per
|
satellite observations, Atmos. Chem. Phys., 12, 4429–4447, doi:10.5194/acp-12-4429-2012, 2012.
Zhang, Q., Streets, D. G., He, K., Wang, Y., Richter, A., Burrows, J. P., Uno, I., Jang, C. J., Chen, D., Yao, Z., and Lei, Y.: NOxemission trends for China, 1995–2004: the view from the ground and the view from space, J. Geophys. Res., 112, D22306, doi:10.1029/2007JD008684,
5
2007.
Zhang, Q., Streets, D. G., Carmichael, G. R., He, K. B., Huo, H., Kannari, A., Klimont, Z., Park, I. S., Reddy, S., Fu, J. S., Chen, D., Duan, L., Lei, Y., Wang, L. T., and Yao, Z. L.: Asian emissions in 2006 for the NASA INTEX-B mission, Atmos. Chem. Phys., 9, 5131– 5153, doi:10.5194/acp-9-5131-2009, 2009a.
10
ACPD
13, 17519–17544, 2013Regional nitrogen oxides emission trends in East Asia observed from space
B. Mijling et al.
Title Page
Abstract Introduction
Conclusions References
Tables Figures
◭ ◮
◭ ◮
Back Close
Full Screen / Esc
Printer-friendly Version
Interactive Discussion
Discussion
P
a
per
|
D
iscussion
P
a
per
|
Discussion
P
a
per
|
Discuss
ion
P
a
per
|
Table 1.Comparison of yearly NOx emission totals for East China (18–50◦N and 102–132◦E) in Tg N yr−1
.
2006 2007 2008 2009 2010 2011
DECSO – 5.63 5.91 6.06 7.09 7.96
EDGAR v4.2 5.03 5.34 5.93 – – –
INTEX-B 6.09 – – – – –
MEIC 6.75 7.28 7.59 7.74 8.33 –
ACPD
13, 17519–17544, 2013Regional nitrogen oxides emission trends in East Asia observed from space
B. Mijling et al.
Title Page
Abstract Introduction
Conclusions References
Tables Figures
◭ ◮
◭ ◮
Back Close
Full Screen / Esc
Printer-friendly Version
Interactive Discussion
Discussion
P
a
per
|
D
iscussion
P
a
per
|
Discussion
P
a
per
|
Discuss
ion
P
a
per
|
Fig. 1.Chinese provinces and surrounding countries that are covered by the model domain.
ACPD
13, 17519–17544, 2013Regional nitrogen oxides emission trends in East Asia observed from space
B. Mijling et al.
Title Page
Abstract Introduction
Conclusions References
Tables Figures
◭ ◮
◭ ◮
Back Close
Full Screen / Esc
Printer-friendly Version
Interactive Discussion
Discussion
P
a
per
|
D
iscussion
P
a
per
|
Discussion
P
a
per
|
Discuss
ion
P
a
per
|
Fig. 2.Comparison of bottom-up inventories EDGAR v4.2 (2008) and MEIC (2008, 2010) with
ACPD
13, 17519–17544, 2013Regional nitrogen oxides emission trends in East Asia observed from space
B. Mijling et al.
Title Page
Abstract Introduction
Conclusions References
Tables Figures
◭ ◮
◭ ◮
Back Close
Full Screen / Esc
Printer-friendly Version
Interactive Discussion
Discussion
P
a
per
|
D
iscussion
P
a
per
|
Discussion
P
a
per
|
Discuss
ion
P
a
per
|
Fig. 4.Emission time series for January 2007 to December 2011 estimated by the DECSO
ACPD
13, 17519–17544, 2013Regional nitrogen oxides emission trends in East Asia observed from space
B. Mijling et al.
Title Page
Abstract Introduction
Conclusions References
Tables Figures
◭ ◮
◭ ◮
Back Close
Full Screen / Esc
Printer-friendly Version
Interactive Discussion
Discussion
P
a
per
|
D
iscussion
P
a
per
|
Discussion
P
a
per
|
Discuss
ion
P
a
per
|
Fig. 5.Mean quarterly tropospheric NO2 concentrations over North Korea, South Korea and