www.biogeosciences.net/12/5705/2015/ doi:10.5194/bg-12-5705-2015
© Author(s) 2015. CC Attribution 3.0 License.
Microtopographic variation in soil respiration and its controlling
factors vary with plant phenophases in a desert–shrub ecosystem
B. Wang1,2, T. S. Zha1, X. Jia1,2, J. N. Gong2, B. Wu1, C. P. A. Bourque3, Y. Zhang1, S. G. Qin1, G. P. Chen4, and H. Peltola2
1Key Laboratory of Soil and Water Conservation and Desertification Combating, School of Soil and Water Conservation,
Beijing Forestry University, Beijing 100083, China
2School of Forest Sciences, University of Eastern Finland, P.O. Box 111, 80101 Joensuu, Finland
3Faculty of Forestry and Environmental Management, University of New Brunswick, Fredericton, New Brunswick,
E3B 5A3, Canada
4Institute of Forestry Sciences, Bailongjiang Forestry Management Bureau of Gansu Province, 746010, China
Correspondence to:T. S. Zha ([email protected])
Received: 13 March 2015 – Published in Biogeosciences Discuss.: 25 June 2015
Revised: 17 September 2015 – Accepted: 21 September 2015 – Published: 8 October 2015
Abstract. Soil respiration (Rs) and its biophysical
con-trols were measured over a fixed sand dune in a desert– shrub ecosystem in northwest China in 2012 to explore the mechanisms controlling the spatial heterogeneity in Rs and
to understand the plant effects on the spatial variation in Rs in different phenophases. The measurements were
car-ried out on four slope orientations (i.e., windward, leeward, north- and south-facing) and three height positions on each slope (i.e., lower, upper, and top) across the phenophases of the dominant shrub species (Artemisia ordosica). Co-efficient of variation (i.e., standard deviation/mean) of Rs
across the 11 microsites over our measurement period was 23.5 %. Soil respiration was highest on the leeward slope, and lowest on the windward slope. Over the measurement period, plant-related factors, rather than microhydrometeo-rological factors, affected the microtopographic variation in Rs. During the flower-bearing phase, root biomass affected
Rs most, explaining 72 % of the total variation. During the
leaf coloration–defoliation phase, soil nitrogen content af-fected Rs the most, explaining 56 % of the total variation.
Our findings highlight that spatial pattern inRswas
depen-dent on plant distribution over a desert sand dune, and plant-related factors largely regulated topographic variation inRs,
and such regulations varied with plant phenology.
1 Introduction
Soil respiration (Rs) plays an important role in the global
car-bon (C) cycle (Bond-Lamberty and Thomson, 2010a). Even relatively small increases inRsmay have a profound impact
on atmospheric CO2concentrations, exerting a positive
feed-back to global warming (Schlesinger and Andrews, 2000; Davidson and Janssens, 2006; Luo, 2007). However, estimat-ing soil C release is usually difficult at large spatiotemporal scales, mainly due to the strong heterogeneity inRs
(Bond-Lamberty and Thomson, 2010b; Luo et al., 2012; Jia et al., 2013). Such heterogeneity depends strongly on the variabil-ity of substrate of respiration (e.g., soil organic matter and living biomass, Martin and Bolstad, 2009; Geng et al., 2012; Ngao et al., 2012) and hydrometeorological factors (e.g., soil water content (SWC) and soil temperature (Ts); Marrin and
Bolstad, 2009; Ngao et al., 2012).
Arid, semiarid and dry-subhumid ecosystems occupy 41 % of the terrestrial surface (Safriel and Adeel, 2005). The C cycle in desert ecosystems cannot be ignored in the global C cycle (Austin, 2011; Poulter et al., 2014).Rs represents
2010). This is because Ts and SWC are reported to have a
strong primary control on the spatiotemporal variation inRs
(Lloyd and Taylor, 1994; Davidson et al., 1998; Wang et al., 2014), as they both exhibit significant heterogeneity as a re-sult of the influence of topography in governing the amount of solar radiation received and the re-distribution of surface and shallow subsurface water (Kang et al., 2003; Liu et al., 2010). Heterogeneity in microhydrometeorological factors also has an explicit role in defining the formation and patchy distribution of vegetation growing in an area (Richerson and Lum, 1980; Parker, 1991). Distribution of vegetation, in turn, constrains the spatial variation inRsthrough its patchy
sup-ply of substrate toRs. In desert ecosystems, such plant effects
usually relate to a phenomenon called “fertility islands”. This phenomenon is observed by the enrichment of water, nutri-ent, and root biomass in vicinity of plant canopies (Hook et al., 1991; Schlesinger and Raikes, 1996), resulting from sev-eral plant-scale processes, including plant-facilitated entrap-ment of soil particles and organic matter propelled by wind or rain droplets, canopy shading, hydraulic lift, and accumula-tion and decomposiaccumula-tion of litterfall (Schlesinger and Raikes, 1996; Stock et al., 1999; Thompson et al., 2005; J. Li et al., 2007; P. X. Li et al., 2008). Consequently, plant controls on Rs could be nested within microhydrometeorological
con-trols, leading to greater complexity in plant–soil interaction. Moreover, both microhydrometeorological and plant con-trol could vary with plant phenophases (Fu et al., 2002; Dun-gan et al., 2003; Kang et al., 2003; Yuste et al., 2004; Tang et al., 2005; Tamai, 2010; Asaeda and Rashid, 2014; Osono, 2014), as current photosynthate supply and decomposition and supplementation of litterfall changes over time. For ex-ample, root activity and rhizosphere processes could vary with plant phenophases (Fu et al., 2002), and potentially alter the relationship between Rs andTs (Yuste et al., 2004;
De-Forest et al., 2006). Previous studies have focused on the in-fluences of plant phenology on the temporal dynamics ofRs.
However, understanding the temporal changes in effects of plants on the spatial variation inRs is still an important gap
in our knowledge concerning plant–soil interactions in desert environments.
We hypothesized that over a fixed sand dune: (1) topo-graphic heterogeneity in Rs is controlled to a large
mea-sure by the distribution of substrate of respiration supplied by the annual casting of plant photosynthates and nitrogen compounds during leaf-fall; and (2) drivers of topographic variation in Rs vary with plant phenology. To test our
hy-pothesis, Rs and associated microhydrometeorological and
Yanchi Research station of Beijing Forestry Univer-sity, Ningxia, northwest China (107.20–107.26◦E, 37.68– 37.73◦N, 1550 m a.s.l.). The site is located at the edge of the Mu Us desert in a transition zone between arid and semi-arid climatic conditions. Based on 51 years (1954–2004) of data from the meteorological station of Yanchi County, the mean annual temperature is 8.1◦C. The mean annual precip-itation is 292 mm (with a range of 250–350 mm), of which 62 % falls between July and September, and the mean annual total potential evaporation is 2024 mm (Wang et al., 2014). The sandy soil has a bulk density of 1.6±0.02 g cm−3. The water-filled pore space across all the microsites was 23.42±0.92 %. Soil organic matter, CaCO3content and pH were 0.21–2.14, 0.23–0.54, and 7.76–9.08 g kg−1, respec-tively (Feng et al., 2013). The vegetation at our study site was regenerated since aerial seeding in 1998 and was dominated by semi-shrub species of isArtemisia ordosica, which aver-aged 50 cm tall with a canopy size of about 80 cm×60 cm. The coverage percentage of plant in this area ranged from 30 to 60 %.
2.2 Measurements of soil CO2efflux and microhydrometeorological factors
Soil CO2efflux (Rs, µmol CO2m−2s−1) was measured with
11 automated chambers from June to October 2012. The measurements were taken on different slope orientations (i.e., windward in the east, leeward in the west, and north-and south-facing slopes) north-and positions (i.e., lower, upper north-and top positions) on a typical shrub-dominated sand dune. The sand dune was of typical size for the study area, with a (i) height of 2.9 m, (ii) 7.6 m long leeward slope, (iii) 15.6 m long windward slope, (iv) 13.3 m long north-facing slope and (v) 13.4 m long south-facing slope. Soil respiration was measured in situ using an automated chamber system (model Li-8100A, equipped with Li-8150 multiplexer, LI-COR, Ne-braska, USA). Measurements were made along two 26 m line transects that intersected at perpendicular angles at the center of the sand dune (Fig. 1). TheRssystem included the
(posi-Figure 1.Schematic of measurement positions (11) distributed on four slopes (windward, leeward, north- and south-facing slope) over a fixed sand dune as well as plot positions and labels.
tion 3) and leeward slopes (position 8); and the microsites from top to the bottom of both the south-facing (position 4, 5, 6) and north-facing slopes (position 9, 10, 11; Fig. 1).
Soil respiration measurement time for each chamber was 3 min and 15 s, including a 30 s pre-purge, a 45 s post-purge, and a 2 min observation period. Any plant re-growth within the measurement collar was manually removed in a timely manner. Hourly soil temperature (Ts, ◦C) and volumetric
soil water content (SWC, m3m−3) were measured
simul-taneously at a 10 cm depth outside of each chamber using 8150-203 soil temperature and ECH2O soil moisture
sen-sors (LI-COR, Nebraska, USA). For more details concern-ing measurement protocol forRs, SWC, andTs, see Wang et
al. (2014).
2.3 Measurements of plant-related factors
Plant-related factors considered in this work were root biomass (kg m−3), litterfall (kg m−2), total soil nitrogen con-tent (g kg−1) within the first 25 cm of the soil, leaf area index (LAI, m2m−2), and plant phenophases. Usually soil samples
were collected near each Rs chamber on the 15th and 30th
day of each month using a soil corer (25 cm in height and 5 cm in diameter). However, collection of soil samples was delayed for several days after rain events to avoid its effects on soil nitrogen content. Three soil replicates were taken near each collar (within 0.5 m), and mixed before they were air dried and sieved through 1, 0.5 and 0.25 mm meshes. During sieving, roots and litterfall were first picked up manually, and scraps of litterfall remaining were separated from the sand by washing the sample with clean water. Dead and alive roots
Figure 2.Phenophases ofArtemisia ordosicaover the measurement period. Three phases are considered, included leaf expansion (phase I), flower-bearing (phase II), and leaf coloration–defoliation (phase III) phases.
were sorted out by color. The black ones were dead roots and mixed with litterfall as the litterfall sample. The yellow ones were alive roots. Both alive roots and litterfall samples were oven dried at 70◦C to a constant weight. Then the soil sam-ples were sieved through a 0.25 mm mesh for total soil nitro-gen measurements. Total nitronitro-gen in the soil was determined with a Kjeldahl Total Nitrogen Apparatus (FOSS 2200, Foss, Denmark).
LAI was measured near each chamber within one hour immediately after sunset using LI-COR 2000 (LI-COR, Ne-braska, USA) with a 90◦view cap, twice or three times every month during the measurement period. At each measurement time, LAI was measured close to ground surface in eight di-rections, which were roughly uniformly distributed within a 0.5 m radius around the chamber, in order to well reflect the effect of vegetation around. Final output of LAI value was the mean of the eight records of the eight directions. In ad-dition, the phenological phases ofArtemisia ordosicawere observed and recorded over the growing season at weekly intervals. Three obvious phases identified were leaf expan-sion (phase I), flower-bearing (phase II), and leaf coloration– defoliation (phase III; Fig. 2).
2.4 Data analysis
Due to fewer measurements in Phase I, data analyses were mainly concentrated on Phase II and Phase III. HourlyRs
data were first screened and values beyond the range of−1 to 15 µmol CO2m−2s−1(mean±5 standard deviation) were
removed from the data set as spurious values (Wang et al., 2014). Instrument failure and quality control procedures re-sulted in the removal of about 3 % of the data from 4 June to 22 October 2012. The days of rainfall were also excluded during our analyses. Daily mean values (totaln=92) ofRs,
Tsand SWC were used in further analyses. We assumed these
fac-Pearson correlation and regression analyses were used to examine the relationship between Rs and
microhydromete-orological and plant-related factors. Class and Regression Tree analyses (CART) were used to explore the main factors controlling spatial variability in Rs (Breiman et al., 1984).
We excluded measurements during rainfall events in both the correlation and CART analyses, due to the prevalence of CO2
flux pulses during these events (Fig. 5 in Wang et al., 2014). In CART analyses, we first set the split value to 1, and then used cost-complexity tree pruning based on a 10-fold cross-validation (Venables and Ripley, 2002). All statistical anal-yses were performed in Matlab (R2010b, Mathworks Inc., Natick, MA, USA); the significance level was set at 0.05.
3 Results
3.1 Topographic heterogeneity in plant-related and microhydrometeorological factors, and in soil respiration
Plant-related factors (i.e., litterfall, root biomass and soil nitrogen) except LAI, exhibited large spatial heterogeneity (Table 1, Fig. 3). The mean daily CVs of litterfall, root biomass and soil nitrogen were 82.0, 64.7, and 49.1 %, re-spectively (Table 1). In contrast, among the four slopes, the microhydrometeorological factors exhibited only minor spatial variation (Table 1, Fig. 3). The mean daily CVs of Ts and SWC were only 4.6 and 22.0 %, respectively
(Ta-ble 1). Among the four slopes, mean SWC changed very little (0.01–0.03 m3m−3; Table 2). Soil temperature (Ts) differed
among the four slopes (p <0.001), with mean differences ranging from 0.5 to 2.4◦C (Table 2). Among the three height positions (lower, upper and top positions), there was no con-sistent pattern in both plant-related and microhydrometeoro-logical factors (Fig. 3).
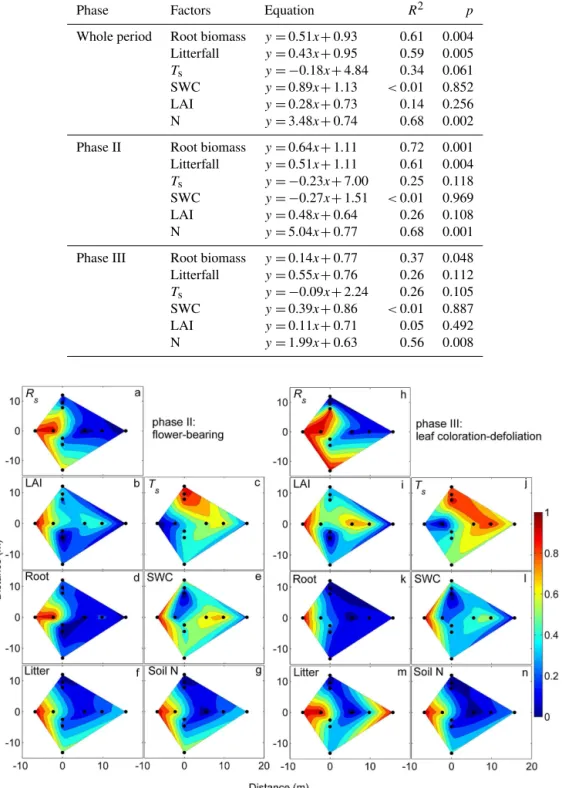
Figure 3.Mean values of soil respiration (Rs), microhydrometeo-rological (Ts and SWC) and plant-related factors (litter, root, soil N and LAI) at 11 positions over the measurement period (whole period), flower-bearing phase (phase II), and leaf coloration– defoliation phase (phase III) from June to October 2012. Timescales of each phenophases are shown in Fig. 2. Rs: soil respiration (µmol CO2m−2s−1);Ts: soil temperature (◦C); SWC: volumetric soil water content (m3m−3); Litter: litterfall (kg m−2); Root: root biomass (kg m−3); LAI: leaf area index (m2m−2); Soil N: soil ni-trogen content at 0–25 cm soil depths (g kg−1). Error bars represent standard error.
3.2 Relationships between soil respiration, microhydrometeorological and plant-related factors over the measurement period
Topographic heterogeneity in Rs was correlated positively
with the plant-related factors, like root biomass (Table 3, Fig. 4a), litterfall (Table 3, Fig. 4b) and soil nitrogen over the measurement period (Table 3, Fig. 4c), but not with the mi-crohydrometeorological factors (i.e.,Ts and SWC,p>0.05,
Table 3). Aside fromRs, both root biomass and soil nitrogen
were correlated positively with litterfall (Fig. 5a, b).
3.3 Relationship between microhydrometeorological factors, plant-related factors and soil respiration for different phenophases
During phase II (Fig. 2), the spatial variation inRs
corre-lated with the spatial variation in root biomass, litterfall and soil nitrogen (Table 3, Figs. 4d, e, f, 6d, f, g). Variation in root biomass, litterfall and soil nitrogen explained the major-ity (>61 %) of the variation inRs among the 11 microsites
(Table 3, Fig. 4). Regression slopes between Rs and root
Table 1. Average values (standard error in brackets) and CV (%) for micro-hydrometeorological factors and plant-related factors over the three plant phenophases and measurement period. The time scale for the means was showing in Fig. 2. Rs: soil respiration (µmol CO2m−2s−1);Ts: soil temperature at 10 cm depth (◦C); SWC: volumetric soil water content (m3m−3); Litter: litterfall (kg m−2); Root: root biomass (kg m−3); LAI: leaf area index (m2m−2); N: soil nitrogen content at 0–25 cm depth (g kg−1); Phase I: leaf expansion; Phase II: flower-bearing; Phase III: coloration-defoliation.
Variale Phase II Phase III Measurement period
mean (SE) CV% mean (SE) CV% mean (SE) CV%
Rs 1.49 (0.11) 25.2 0.900 (0.06) 21.3 1.21 (0.09) 23.5
Ts 23.8 (0.24) 3.40 14.9 (0.33) 7.40 19.7 (0.27) 4.60 SWC 0.0897 (0.01) 20.8 0.0971 (0.01) 24.0 0.0931 (0.01) 22.0 Litter 0.737 (0.17) 78.5 0.262 (0.05) 67.7 0.629 (0.16) 82.0 Root 0.593 (0.15) 84.2 0.904 (0.25) 92.2 0.753 (0.14) 64.7 LAI 1.76 (0.12) 22.7 1.72 (0.12) 23.9 1.76 (0.12) 21.8 N 0.181 (0.02) 43.5 0.135 (0.02) 53.3 0.138 (0.02) 49.1
Table 2.Mean values (standard error in parentheses) of microhydrometeorological and plant-related factors on different slope orientations over the measurement period. Rs: soil respiration (µmol CO2m−2s−1);Ts: soil temperature (◦C); SWC: volumetric soil water content (m3m−3); Litter: litterfall (kg m−2); Root: root biomass (kg m−3); LAI: leaf area index (m2m−2); N: soil nitrogen content at 0–25 cm soil depths (g kg−1).
Windward Leeward North-facing South-facing
Rs 0.964 (0.05) 1.65 (0.03) 1.13 (0.27) 1.27 (0.19)
Ts 19.9 (0.60) 18.4 (0.08) 20.8 (0.23) 19.4 (0.09) SWC 0.0964 (0.02) 0.107 (0.04) 0.0819 (0.02) 0.0918 (0.02) Litter 0.487 (0.29) 1.53 (0.37) 0.231 (0.15) 0.671 (0.28) Root 0.309 (0.13) 1.405 (0.02) 0.460 (0.03) 0.322 (0.17) LAI 1.80 (0.48) 2.22 (0.43) 1.70 (0.05) 1.47 (0.25) N 0.109 (0.03) 0.254 (0.04) 0.0848 (0.02) 0.141 (0.03)
Figure 4. Relationships between soil respiration (Rs) and root biomass, and litterfall and soil nitrogen over the measurement pe-riod (open circles) and during flower-bearing (phase II; gray cir-cles) and leaf coloration–defoliation (phase III; black circir-cles) phase. Lines are linear regressions withp <0.05. Equations,R2, andp
values are given in Table 3.
Figure 5.Relationships between litterfall and root(a), and soil ni-trogen content (soil N)(b)over the measurement period.
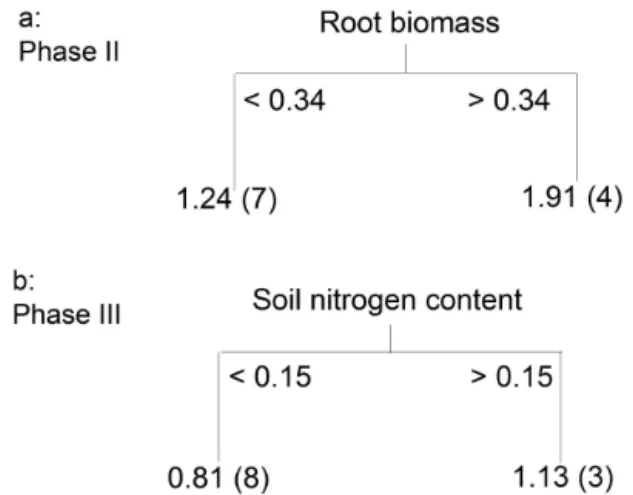
biomass was the most significant factor affecting the spatial variation inRsduring phase II (Fig. 7a).
During phase III (Fig. 2), spatial variation in Rs was
strongly correlated to the spatial variation in root biomass and soil nitrogen content (Table 3, Figs. 4d, f, 6k, n). Varia-tion in soil nitrogen content and root biomass explained 56 and 39 % of the variation inRs among the 11 microsites,
re-spectively (Table 3, Fig. 4d, f). Regression slopes betweenRs
Ts y 0.18x 4.84 0.34 0.061 SWC y=0.89x+1.13 <0.01 0.852 LAI y=0.28x+0.73 0.14 0.256 N y=3.48x+0.74 0.68 0.002
Phase II Root biomass y=0.64x+1.11 0.72 0.001 Litterfall y=0.51x+1.11 0.61 0.004
Ts y= −0.23x+7.00 0.25 0.118 SWC y= −0.27x+1.51 <0.01 0.969 LAI y=0.48x+0.64 0.26 0.108 N y=5.04x+0.77 0.68 0.001
Phase III Root biomass y=0.14x+0.77 0.37 0.048 Litterfall y=0.55x+0.76 0.26 0.112
Ts y= −0.09x+2.24 0.26 0.105 SWC y=0.39x+0.86 <0.01 0.887 LAI y=0.11x+0.71 0.05 0.492 N y=1.99x+0.63 0.56 0.008
Figure 7. Results of CART analysis with key factors explaining spatial variability in soil respiration at the flower-bearing(a)and coloration–defoliation phases(b). Predictor variables are depicted at the top of each branch. Their critical values are shown at the side of each branch and the mean soil CO2efflux (including number of observations in parentheses) is reported below the terminal nodes.
and 0.63 (Table 3). Based on CART analysis, soil nitrogen content affected the spatial variation in Rs the most during
phase III (Fig. 7b).
4 Discussion
4.1 Spatial patterns in soil respiration with respect to plant patchiness
The observed pattern thatRson the leeward slope was
high-est among the four slope orientations, was consistent with the findings of Chai et al. (2012), who found thatRson
lee-ward slopes was over two times greater thanRson windward
slopes of a sand dune. The greaterRson leeward slopes may
be explained by the presence of larger patches of vegetation, most likely supported by the better soil conditions induced by the “fertility island” effect, addressed earlier (Table 2). Associated with the “fertility island” effect is the enrichment of the soil near the plants by the annual casting of photo-synthates and nitrogen compounds with annual litterfall. In contrast, on the windward slope the level of soil enrichment is limited as a result of smaller vegetation patches, leading to suppression ofRs. Higher supply of photosynthetic products
and soil nitrogen in the vicinity of the plants was reported in previous studies by Scott-Denton et al. (2003) and Tang et al. (2005).
However, we did not find consistent patterns in Rs
be-tween height positions. As a comparison, Chai et al. (2012) observed earlier that Rs was lower in the lower positions,
whereas Xu and Wan (2008) and Liu et al. (2010) found the opposite result. The magnitude ofRsat a given slope position
was consistent with those of plant-related factors (Table 3, Fig. 4),Rsbeing highest at positions closest to the plants
re-gardless of height gradients along the slopes. It is therefore concluded that topographic position or height within the sand dune per se is a poor predictor ofRs.
4.2 Plant drivers of the topographic variation in soil respiration over the measurement period
Our present finding that plant-related factors drive the topo-graphic variation inRsover a sand dune (Table 3, Fig. 4) was
consistent with those of Sponseller and Fisher (2008). They reported that spatial patterns in Rs in the Sonoran Desert
were related to plant size and productivity, but unrelated to soil water. Desert ecosystems are generally limited with sub-strate supply due to their low living biomass and accumulated soil organic matter, but feature large spatial heterogeneity in respiration substrate due to the “fertility-island” effect (Gold et al., 1995; Xie et al., 2001). This can be supported by large CVs (49.1, 64.7 and 82.0 %) in plant-related factors of our study. In contrast, CVs for the hydrometeorological factors were much smaller (4.6 and 22.0 %). Positive relationships between plant-related factors (litterfall, soil nitrogen and root biomass), together with their positive effects onRs(Figs. 4,
6), emphasized that spatial variation in supply of respiration substrate regulated spatial variation inRs. Current
photosyn-thate is supplied for root and rhizosphere respiration (Hög-berg et al., 2001; Tang et al., 2005; Han et al., 2014). Litter-fall is supplied for heterotrophic microbe respiration (Reich-stein et al., 2002; Zhou et al., 2013). These processes are in-fluenced by soil nitrogen content (Allison et al., 2008; Deng et al., 2010). These findings support our first hypothesis that topographic heterogeneity inRswas controlled by the
respi-ration substrate supply provided by plants. In contrast, many studies in forests and grasslands report that topographic het-erogeneity inRscan be suitably explained by spatial
hetero-geneity inTsand SWC (Kang et al., 2003; Liu et al., 2010).
We suggest that future studies on spatially scaling up soil respiration in desert ecosystems should consider the spatial variation in substrate supply more than temperature.
Our finding that plants controlled the topographic varia-tion inRs over a fixed sand dune, along with similar
find-ings by other studies (Moyano et al., 2008; Kuzyakov and Gavrichkova, 2010; Han et al., 2014), challenge the legiti-macy of empirical models ofRs at the sand-dune scale. As
an alternative, we suggest that photosynthesis-related param-eters (or variables, e.g., root biomass and litterfall) ought to be incorporated into these models for an improved character-ization of soil–plant relationships in desert ecosystems.
4.3 Drivers of topographic heterogeneity in soil respiration as a function of plant phenology
In our study, topographic heterogeneity inRs at the
tosynthesis declined, and induced large decreases in current photosynthate supply for roots and rhizosphere microorgan-isms (Hanson et al., 2000; Fu et al., 2002; Sey et al., 2010). Decomposition of litterfall results in a high percentage of re-calcitrant substrates during phase II, but addition of fresh lit-terfall during phase III increases the percentage of liable sub-strates (Lebret et al., 2001; Regina, 2001; Ochieng and Erfte-meijer, 2002). Thus, changes in substrate supply between the two phenophases could result in seasonal changes in the rela-tive contribution of autotrophic and heterotrophic respiration to total Rs. Root respiration contributes largely to total Rs
during the growing season, but heterotrophic respiration con-tributes largely during the senescence season (Fu et al., 2002; Sey et al., 2010; Mauritz and Lipson, 2013). Specifically, in our study, autotrophic respiration may contribute largely to the totalRsduring the phase II, but heterotrophic respiration
may contribute largely during the phase III. We could not test this inference directly due to lack of independent mea-surements of differentRscomponents. However, some of our
results can indirectly confirm this inference.
In our study,Rswas sensitive to root biomass during phase
II, but less sensitive during phase III, indicating a decrease in relative contribution of root respiration to Rs during phase
III.Rswas related to litterfall during phase II, unlike during
phase III, indicating the switched substrate pool and dispro-portionate addition of fresh litterfall. However, the control-ling factors of autotrophic and heterotrophic respiration can be quite different. Autotrophic respiration is shown in other studies to be largely controlled by root biomass and soil ni-trogen (Tu et al., 2013; Zhou et al., 2014), and heterotrophic respiration by the amount of litterfall and soil nitrogen (Yan et al., 2010; Sayer et al., 2011). Thus, the key factor control-ling the variation inRscan be different for the different plant
phenophases.
There has been a clear lack of understanding on the effects of plant phenology on the driving forces of topographic het-erogeneity in Rs (Janssens et al., 2004; Bahn et al., 2008).
In this sense, our work provides new knowledge of driving mechanisms of topographic heterogeneity inRs as affected
by plant phenology. Based on our work, we suggest that the influences of plant phenology on both current photosynthate and litterfall supply should not be neglected, and partitioning Rsis necessary for future studies on the spatial heterogeneity
inRs.
s
from plant patches, regardless of microtopographic relief. Drivers of topographic heterogeneity inRsvaried with plant
phenophases. Our findings highlight the importance of plants in controlling the spatial variation inRsin desert ecosystems.
We suggest that future studies on the spatial variation inRs
should consider both the spatial and the temporal effects of vegetation, especially in desert environments.
Acknowledgements. We acknowledge the support obtained from the National Natural Science Foundation of China (NSFC) (31270755 and 31361130340, 31200537), the Academy of Finland (proj. no. 14921), Beijing Forestry University and the University of Eastern Finland. This work is related to the ongoing Finnish–Chinese research collaboration project EXTREME, between Beijing Forestry University and the University of Eastern Finland. Thanks to Graham Forbes for valuable comments and language revisions and to Huishu Shi, Yuming Zhang, Wei Feng, Sijing Li, Zhihao Chen, Siling Tang, Yajuan Wu and Yuan Li for their assistance with the field measurements and instrumentation maintenance.
Edited by: J.-A. Subke
References
Allison, S. D., Czimczik, C. I., and Treseder, K. K.: Microbial activ-ity and soil respiration under nitrogen addition in Alaskan boreal forest, Glob. Change Biol., 14, 1–13, 2008.
Asaeda, T. and Rashid, M. H.: Nutrient retention associated with phenological features inSparganium erectumstands in a lowland stream, River Res. Appl., 31, 207–215, 2015..
Austin, A. T.: Has water limited our imagination for aridland bio-geochemistry?, Trends Ecol. Evol., 26, 229–235, 2011. Bahn, M., Rodeghiero, M., Anderson-Dunn, M., Dore, S.,
Gi-meno, C., Drösler, M., Williams, M., Ammann, C., Berninger, F., Flechard, C., Jones, S., Balzarolo, M., Kumar, S., Newesely, C., Priwitzer, T., Raschi, A., Siegwolf, R., Susiluoto, S., Tenhunen, J., Wohlfahrt, G., and Gernusca, A.: Soil respiration in European grasslands in relation to climate and assimilate supply, Ecosys-tems, 11, 1353–1367, 2008.
Bond-Lamberty, B. and Thomson, A.: Temperature-associated in-creases in the global soil respiration record, Nature, 464, 579– 582, 2010a.
Breimann L. Friedman, J. Stone, C. J., and Olshen, R. A.: Classifi-cation and regression trees, Chapman & Hall/CRC, Wadsworth, Belmont, California, 1984.
Chai, H., Feng, J., and Jing, Y.: Spatial distribution and change trait of soil respiration at the dunes in Hoqin Sand Land, Arid Land Geogr., 3, 463–472, 2012.
Davidson, E. A. and Janssens, I. A.: Temperature sensitivity of soil carbon decomposition and feedbacks to climate change, Nature, 440, 165–173, 2006.
Davidson, E. A., Belk, E., and Boone, R. D.: Soil water content and temperature as independent or confounded factors control-ling soil respiration in a temperate mixed hardwood forest, Glob. Change Biol., 4, 217–227, 1998.
DeForest, J. L., Noormets, A., McNulty, S. G., Sun, G., Tenney, G., and Chen, J.: Phenophases alter the soil respiration-temperature relationship in an oak-dominated forest, Int. J. Biometeorol., 51, 135–144, 2006.
Deng, Q., Zhou, G., Liu, J., Liu, S., Duan, H., and Zhang, D.: Res-piration of soil resRes-piration to elevated carbon dioxide and nitro-gen addition in subtropical forest ecosystems in China, Biogeo-sciences, 7, 315–328, doi:10.5194/bg-7-315-2010, 2010. Dungan, R. J., Whitehead, D., and Duncan, R. P.: Seasonal and
tem-perature dependence of photosynthesis and respiration for two co-occurring broad-leaved tree species with contrasting leaf phe-nology, Tree Physiol., 23, 561–568, 2003.
Feng, W., Zhang, Y., Wu, B., Zha, T., Jia, X., Qin, S., Shao, C., Liu, J., Lai, Z., and Fa, K.: Influence of disturbance on soil respiration in biologically crusted soil during the dry season, The Scientific World J., 2013, 408560, doi:10.1155/2013/408560, 2013. Fu, S., Cheng, W., and Susfalk, R.: Rhizosphere respiration varies
with plant species and phenology: a greenhouse pot experiment, Plant Soil, 239, 133–140, 2002.
Geng, Y., Wang, Y., Yang, K., Wang, S., Zeng, H., Baumann, F., Kuehn, P., Scholten, T., and He, J.: Soil respiration in Tibetan Alpine Grasslands: Belowground biomass and soil moisture, but not soil temperature, best explain the large-scale patterns, PLoS ONE, 7, e34968. doi:10.1371/journal.pone.0034968, 2012. Gold, W. G. and Bliss, L. C.: Water limitations and plant community
development in a polar desert, Ecology, 76, 1558–1568, 1995. Han, G., Luo, Y., Li, D., Xia, J., Xing, Q., and Yu, J.: Ecosystem
photosynthesis regulates soil respiration on a diurnal scale with a short-term time lag in a coastal wetland, Soil Biol. Biochem., 68, 85–94, 2014.
Hanson, P. J., Edwards, N. T., Garten, C. T., and Andrews, J. A.: Separating root and soil microbial contributions to soil respira-tion: a review of methods and observations, Biogeochemistry, 48, 115–146, 2000.
Hook, P. B., Burke, I. C., and Lauenroth, W. K.: Heterogeneity of soil and plant N and C associated with individual plants and openings in North American short grass steppe, Plant Soil, 138, 247–256, 1991.
Högberg, P., Nordgren, A., Buchmann, N., Taylor, A. F. S., Ekblad, A., Högberg, M. N., Nyberg, G., Ottosson-Löfvenius, M., and Read, D. J.: Large-scale forest girdling shows that current photo-synthesis drives soil respiration, Nature, 411, 789–792, 2001. Janssens, I. A., Carrara, A., and Ceulemans, R.: Annual Q10of soil
respiration reflects plant phenological patterns as well as temper-ature sensitivity, Glob. Change Biol., 10, 161–169, 2004.
Jia, X., Zhan, T., Wu, B., Zhang, Y., Chen, W., Wang, X., Yu, H., and He, G.: Temperature response of soil respiration in a Chinese pine plantation: hysteresis and seasonal vs. diel Q10, PLoS ONE, 8, e57858. doi:10.1371/journal.pone.0057858, 2013.
Kang, S., Doh, S., Lee, D. S., Lee, D., Jin, V. L., and Kimball, J. S.: Topographic and climatic controls on soil respiration in six temperate mixed-hardwood forest slopes, Korea, Glob. Change Biol., 9, 1427–1437, 2003.
Kuzyakov, Y. and Gavrichkova, O.: Time lag between photosynthe-sis and carbon dioxide efflux from soil: a review of mechanisms and controls, Glob. Change Biol., 16, 3386–3406, 2010. Lebret, M., Nys, C., and Forgeard, F.: Litter production in an
At-lantic beech (Fagus sylvaticaL.) time sequence, Ann. For. Sci., 58, 755–768, 2001.
Lloyd, J. and Taylor, J. A.: On the temperature dependence of soil respiration, Funct. Ecol., 8, 315–323, 1994.
Li, J., Zhao, C., Zhu, H., Li, Y., and Wang, F.: Effect of plant species on shrub fertile island at an oasis-desert ecotone in the South Junggar Basin, China, J. Arid Environ., 71, 350–361, 2007. Li, P. X., Wang, N., He, W. M., Krüsi, B. O., Gao, S. Q., Zhang,
S. M., Yu, F. H., and Dong, M.: Fertile islands under Artemisia ordosica in inland dunes of northern China: effects of habitats and plant developmental stages, J. Arid Environ., 72, 953–963, 2008.
Liu, W., Xu, W., Hong, J., and Wan, S.: Interannual variability of soil microbial biomass and respiration in responses to topog-raphy, annual burning and N addition a semiarid temperature steppe, Geoderma, 158, 259–267, 2010.
Luo, J., Chen, Y., Wu, Y., Shi, P., She, J., and Zhou, P.: Temporal-spatial variation and controls of soil respira-tion in different primary succession stage on glacier fore-head in Gongga Mountain, China, PLoS ONE, 7, e42354, doi:10.1371/journal.pone.0042354, 2012.
Luo, Y. Q.: Terrestrial carbon-cycle feedback to climate warming, Annu. Rev. Ecol. Evol. S., 38, 683–712, 2007.
Mahall, B. E. and Callaway, R. M.: Root communication mecha-nisms and intracommunity distributions of two Mojave Desert shrubs, Ecology, 73, 2145–2151, 1992.
Martin, J. G. and Bolstad, P. V.: Variation of soil respiration at three spatial scales: Components within measurements, intra-site vari-ation and patterns on the landscape, Soil Biol. Biochem., 41, 530–543, 2009.
Mauritz, M. and Lipson, D. L.: Altered phenology and temper-ature sensitivity of invasive annual grasses and forbs changes autotrophic and heterotrophic respiration rates in a semi-arid shrub community, Biogeosciences Discuss., 10, 6335–6375, doi:10.5194/bgd-10-6335-2013, 2013.
Moyano, F. E., Kutsch, W. L., and Rebmann, C.: Soil respiration fluxes in relation to photosynthetic activity in broad-leaf and needle-leaf forest stands, Agr. Forest Meteorol., 148, 135–143, 2008.
Ngao, J., Epron, D., Delpierre, N., Bréda, N., Granier, A., and Long-doz, B.: Spatial variability of soil CO2efflux linked to soil pa-rameters and ecosystem characteristics in a temperate beech for-est, Agr. Forest Meteorol., 154, 136–146, 2012.
cycle, Nature, 509, 600–603, 2014.
Raich, J. W. and Schlesinger, W. H.: The global carbon dioxide flux in soil respiration and its relationship to vegetation and cli-mate, Tellus B, 44, 81–99, 1992.
Raich, J. W., Potter, C. S., and Bhagawati, D.: Interannual vari-ability in global soil respiration, 1980–94, Glob. Change Biol., 8, 800–812, 2002.
Regina, I. S.: Litter fall, decomposition and nutrient release in three semi-arid forests of Duero basin, Spain, Foresty, 74, 347–358, 2001.
Reichstein, M., Tenhunen, J. D., Roupsard, O., Ourcival, J.-M., Rambal, S., Miglietta, F., Peressotti, A., Pecchiari, M., Tirone, G., and Valentini, R.: Severe drought effects on ecosystem CO2 and H2O fluxes at three Mediterranean evergreen sites: revision of current hypotheses?, Glob. Change Biol., 8, 999–1017, 2002. Richerson, P. J. and Lum, K.: Patterns of plant species diversity in
California: relation to weather and topography, Am. Nat., 116, 504–536, 1980.
Roles, B., Donders, S., Werger, M. J., and Dong, M.: Relation of wind-induced sand displacement to plant biomass and plant sand-binding capacity, Acta Bot. Sin., 43, 979–982, 2001. Safriel, U. and Adeel, Z.: Dryland ecosystems, II, in: Ecosystems
and human well-being: current state and trends, Vol 1, edited by: Hassan, R., Scholes, R., and Neville, A., Island Press, Washin-gon, DC, 623–662, 2005.
Sayer, E. J., Heard, M. S., Grant, H. K., Marthews, T. R., and Tan-ner, E. V. J.: Soil carbon release enhanced by increased tropical forest litterfall, Nature Climate Change, 1, 304–307, 2011. Schlesinger, W. H. and Andrews, J. A.: Soil respiration and the
global carbon cycle, Biogeochemistry, 48, 7–20, 2000.
Schlesinger, W. H. and Raikes, J. A.: On the spatial pattern of soil nutrients in desert ecosystems, Ecology, 77, 364–374, 1996. Scott-Denton, L. E., Sparks, K. L., and Monson, R. K.: Spatial and
temporal controls of soil respiration rate in a high-elevation, sub-alpine forest, Soil Biol. Biochem., 35, 525–534, 2003.
Sey, B. K., Manceur, A. M., Whalen, J. K., Gregorich, E. G., and Rochette, P.: Root-derived respiration and nitrous oxide produc-tion as affected by crop phenology and nitrogen fertilizaproduc-tion, Plant Soil, 326, 369–379, 2010.
Sponseller, R. A. and Fisher, S. G.: The influence of drainage net-works on patterns of soil respiration in a desert catchment, Ecol-ogy, 89, 1089–1100, 2008.
11, 1298–1304, 2005.
Thompson, D. B., Walker, L. R., Landau, F. H., and Stark, L. R.: The influence of elevation, shrub species, and biological soil crust on fertile islands in the Mojave Desert, USA, J. Arid Environ., 61, 609–629, 2005.
Tu, L., Hu, X., Zhang, J., Li, X., Hu, H., Liu, L., and Xiao, Y.: Nitrogen addition simulates different components of soil respira-tion in a subtropical bamboo ecosystem, Soil Biol. Biochem., 58, 255–264, 2013.
Venables, W. N. and Ripley, B. D.: Modern applied statistics with S-Plus. Springer Press, NewYork, 2002.
Wang, B., Zha, T. S., Jia, X., Wu, B., Zhang, Y. Q., and Qin, S. G: Soil moisture modifies the response of soil respiration to temper-ature in a desert shrub ecosystem, Biogeosciences, 11, 259–268, doi:10.5194/bg-11-259-2014, 2014.
Xie, G. and Steinberger, Y.: Temporal patterns of C and N un-der shrub canopy in a loessial soil desert ecosystem, Soil Biol. Biochem., 33, 1371–1379, 2001.
Xu, W. and Wan, S.: Water- and plant-mediated responses of soil respiration to topography, fire, and nitrogen fertilization in a semiarid grassland in north China, Soil Biol. Biochem., 40, 679– 687, 2008.
Yan, L., Chen, S., Huang, J., and Lin, G.: Different responses of auto- and heterotrophic soil respiration to water and nitrogen ad-dition in a semiarid temperate steppe, Glob. Change Biol., 16, 2345–2357, 2010.
Yuste, J. C., Janssens I. A., Carrara, A., and Ceulemans, R.: An-nualQ10 of soil respiration reflects plant phenological patterns as well as temperature sensitivity, Glob. Change Biol., 10, 161– 169, 2004.
Zhou, L., Zhou, X., Zhang, B., Lu, M., Luo, Y., Liu, L., and Li, B.: Different responses of soil respiration and its components to nitrogen addition among biomes: a meta-analysis, Glob. Change Biol., 7, 2332–2343, 2014.