DALTON BELCHIOR ABDALA
PRODUTIVIDADE DE MILHO E POTENCIAL DE PERDAS DE FÓSFORO EM ARGISSOLO FERTILIZADO COM CAMA DE FRANGO
VIÇOSA
MINAS GERAIS – BRASIL
2008
Dissertação apresentada à Universidade Federal de Viçosa, como parte das exigências do Programa de Pós-Graduação em Solos e Nutrição de Plantas, para obtenção do título de
DALTON BELCHIOR ABDALA
PRODUTIVIDADE DE MILHO E POTENCIAL DE PERDAS DE FÓSFORO EM ARGISSOLO FERTILIZADO COM CAMA DE FRANGO
APROVADA: 02 de setembro de 2008
___________________________ ___________________________
Prof. Roberto Ferreira de Novais Prof. Víctor Hugo Alvarez V. (Co-orientador) (Co-orientador)
___________________________ ___________________________
Profa. MariaBetânia G. dos Santos Freire Profa. Hermínia Emilia Prieto Martinez
___________________________
Prof. Ivo Ribeiro da Silva (Orientador)
iii A Deus
A minha mãe, Márcia
AGRADECIMENTOS
A Universidade Federal de Viçosa (UFV), especialmente ao Departamento de
Solos (DPS), pela oportunidade de realização do curso;
A Coordenação de Aperfeiçoamento de Pessoal de Nível Superior (CAPES),
pela concessão da bolsa de estudo;
A todos os Docentes do Departamento de Solos da UFV que estiveram
envolvidos direta ou indiretamente no desenvolvimento de meu trabalho de dissertação.
Ao Prof. Nairam Félix de Barros pela concessão do laboratório de Solos
Florestais para a condução das análises laboratoriais de meu trabalho de dissertação e
pela oportunidade de participar do programa de intercâmbio internacional sob sua
coordenação;
Ao Prof. Ivo Ribeiro da Silva, meu orientador, pela orientação, pelos
ensinamentos e por representar um exemplo de competência, dedicação e de vigor;
Ao Prof. Roberto Ferreira de Novais, co-orientador e Professor, pelo referencial
de competência e pela capacidade de inspirar a nós alunos;
Ao Prof. Victor Hugo Alvarez V., co-orientador e Professor, pelos ensinamentos
nas aulas de Avaliação da Fertilidade do Solo que tanto contribuíram para minha
formação acadêmica, e, muito mais, pelo exemplo de profissionalismo, seriedade,
humildade e honestidade que ele tão bem representa;
Ao Prof. Júlio César Lima Neves, pela prontidão e pelas sugestões fundamentais
à conclusão deste trabalho;
Aos amigos André Santos (doidão) e Luiza, Guilherme (Red) e Myriam, Helton
e Michele e Michelle Demolinari pela boa amizade que foi além das paredes dos
laboratórios e salas de aula da UFV;
Aos colegas Augusto, Carlão, Carolina Brandani, Emmanuele, Eulene, Ezequiel,
Fabrição, Fernanda Schulthais, Fernando Gaúcho, Flancer, Fred, Ivan, Jackson, Karina,
v
Florestais, pela atmosfera de tranqüilidade por eles proporcionada, pelo respeito e pela
convivência, amizade e momentos de descontração;
Aos estudantes de iniciação científica Amanda, Eduardo (soneca), Ezequiel,
Glauce e Isadora que acompanharam e muito contribuíram para a montagem, execução
e análises laboratoriais dos experimentos de meu trabalho;
Aos colegas Amanda, Arlindo (lagartão), Breno, Cecília, Clério, David Faria,
Diana, Fernanda Athaíde, Fernanda Costa, Gislane (Gigi), Guilherme Correa, Henrique
Paye, Ítalo, Ivan, Jarbas, Joaquim Garcia, Marcus Locatelli, Pacheco, Renato Veloso,
Tangara, Tathiane Sarcinelli e Tiago Torres do curso de pós-graduação em Solos e
Nutrição de Plantas pela amizade e companheirismo;
A minha irmã Kaliny, ao meu cunhado Guilherme Rehder e ao meu tio
Sebastião Belchior Neto (in memorian) pelo apoio, incentivo e amizade;
Ao Natan Silva e, mais recentemente, à Lívia Cristina pelo carinho, amizade e
pelos exemplos de determinação;
Aos colegas de república: Peruano (David), Evander, Brainer, Alexander
(calouro), Daniel (Dandan) e André pelo acolhimento e amizade;
A todos os funcionários e técnicos do DPS, principalmente ao Beto (carrapato),
Cardoso, Carlinhos, Carlos Fonseca, Claudinho, Sr. Bené, às Denises da secretaria,
Geraldo Vitor, João Milagres, Luciana, Tia Sonia e Zé Luis pela colaboração, presteza e
amizade;
A todos que participaram dos bons momentos que tive nessa jornada;
E, por último, mas não menos importante, a pessoa que me fez compreender que
o primeiro e último amor de nossas vidas não é aquele que sentimos por um alguém,
BIOGRAFIA
DALTON BELCHIOR ABDALA, filho de David José Franco Abdala e Márcia Rúbia
Belchior Abdala, nasceu em Campestre, em sete de Janeiro de 1980.
Iniciou o curso de Agronomia no ano de 2001 na Universidade de Alfenas
(Unifenas), transferindo-se, posteriormente, para a ESACMA, em Machado, onde
permaneceu no curso de Agronomia desta Escola por um ano e meio.
Em Fevereiro de 2003, foi admitido pela UFV para continuação do curso em
Agronomia.
Em Agosto de 2005, recebeu uma bolsa de estudos pela CAPES para participação
em um programa de intercâmbio internacional entre a UFV e a University of Florida por
um período de um ano acadêmico.
Em outubro de 2006, graduou-se em Agronomia pela Universidade Federal de
Viçosa.
Em outubro do mesmo ano, iniciou o Curso de Mestrado na Universidade Federal
de Viçosa, concentrando seus estudos na área de fertilidade do solo e nutrição de
vii
ÍNDICE
Page
RESUMO... viii
ABSTRACT... x
Introduction... 1
Material and Methods ... 4
Results and Discussion ... 9
Conclusions... 20
RESUMO
ABDALA, Dalton Belchior, M. Sc., Universidade Federal de Viçosa, Setembro de
2008. Produtividade de milho e potencial de perdas de fósforo em Argissolo
fertilizado com cama de frango Orientador: Ivo Ribeiro da Silva. Co-orientadores: Roberto Ferreira de Novais e Victor Hugo Alvarez Venegas.
A utilização de resíduos orgânicos na agricultura como fertilizantes ou
condicionadores de solo tem ganho importância no Brasil na medida em que a
agricultura orgânica tem expandido e os preços de fertilizantes tem aumentado
sobremaneira. Contudo, estudos que relacionem as taxas de aplicação de fertilizantes
orgânicos, tais como a cama de frango (PL), com o objetivo de aumentar o rendimento
de culturas com mínimo risco ao ambiente tem sido escassos. O presente estudo foi
conduzido sob condições de campo em um Argisolo Vermelho-Amarelo objetivando-se
avaliar o rendimento de grãos de milho, as alterações em algumas caracteristicas
químicas do solo, e o potencial de perdas de fósforo (P) como resultado da aplicação
consecutiva de doses crescentes de cama de frango em superfície. As doses de PL
utilizadas foram 0, 5, 10, 25, 50 e 100 t ha-1 e estas foram aplicadas superficialmente por
três anos consecutivos e milho foi cultivado. As características químicas apresentadas
foram determinadas ao final do terceiro ano de aplicação da PL. Foi observado que a
aplicação de PL teve efeitos positivos sobre o rendimento de grãos (CGY), o qual
variou entre 4443 kg ha-1 no tratamento controle e 12 000 kg ha-1 nos tratamentos com
aplicação de altas doses de PL. No terceiro ano, o rendimento físico máximo (ŷ máx) foi
estimado como 12 500 kg ha-1, necessitando, portanto, de uma dose de PL de 74.7 t ha-1.
Entretanto, um rendimento mais econômico de 11 207 kg ha-1, representado por 0.9 ŷ
máx, foi obtido com uma dose de 21.7 t ha-1. A aplicação da dose mais elevada de PL
conduziu a um grau de saturação de P de 21% estimado com o extrator Mehlich-3
(DPSM-3) e uma concentração de P pelo mesmo extrator (PM-3, 131 mg kg-1) considerada
mais baixa que o valor limite (crítico) que a maioria dos índices ambientais alertam para
o potencial risco de perda de P. Contudo, o valor de P soluvel em água (WSP) variou
bastante acima do valor preconizado pelos indicadores ambientais, indicando que
valores de DPSM-3 acima dos quais perdas de P são acentuadas estão abaixo daqueles
encontrados para solos menos intemperizados. Este fato demonstra que medidas
isoladas de valores analíticos, como concentração de P ou o DPSM-3, fornecem
ix
considerar o WSP como medida auxiliar para uma concepção mais realística do
potencial de perda de P. Dessa forma, um nível crítico ambiental que também considera
os valores críticos de WSP conduziu a uma indicação mais realística da perda de P.
Assim, considerando-se valores de WSP, a dose estimada de PL a ser recomendada
seria de 5.1 t ha-1. As alterações observadas nos atributos químicos do solo incluiram
aumentos nas concentrações de nutrientes (N, P, K+, Ca2+, Mg2+ e Zn), Na+, pH e
Carbono total (CT), e descréscimo em Al3+ trocável. Por fim, os resultados obtidos
indicam que a dose de cama de frango requerida para a obtenção de rendimento máximo
de grãos conduziriam a valores de saturação de P no solo e concentrações de WSP que
estão muito acima dos níveis ambientais. Portanto, com vistas a atender
recomendações de PL para cultivo de milho com mínimo risco de perdas de P, estas
devem incluir análises de WSP complementares as demais medidas de P das análises de
rotina ao invés de somente o rendimento de grãos, as concentrações de PM-3 e os níveis
ABSTRACT
ABDALA, Dalton Belchior, M.S., Universidade Federal de Viçosa, August, 2008.
Corn yield and phosporus loss potential in an Ultisol fertilized with poultry litter.
Adviser: Ivo Ribeiro da Silva. Co-Advisers: Roberto Ferreira de Novais and Víctor Hugo Alvarez V.
The use of organic residues in agriculture as fertilizers or soil amendments has
gained importance in Brazil as organic agriculture has expanded and fertilizer prices
have increased substantially. However, studies that relate manure rates, especially
poultry litter (PL), to maximize crop yield with minimum risk to the environment, are
scarce. The present study was carried out under field conditions in an Ultisol to evaluate
corn grain yield, the changes in soil chemical characteristics, and the P loss potential as
a result of surface application of increasing rates of PL for three consecutive years. The
PL rates used were 0, 5, 10, 25, 50 and 100 t ha-1 (DW basis) and they were annually
broadcast for three consecutive years and corn was cultivated. The reported soil
chemical characteristics were determined after the third year of corn cultivation, thus
reflecting the cumulative effect of PL application. It was found that the application of
PL had positive effects on corn grain yield (CGY), which ranged from 4423 in control
plots to about 12 000 kg ha-1 in high PL rate treatments. In the third year it was
estimated that a maximum physical grain yield (ŷ max) of 12 500 kg ha-1 could be
achieved with a PL rate of 74.7 t ha-1. However, a more economical grain yield of
11 207 kg ha-1, assigned as 0.9 ŷ max, could be achieved with a PL rate of 21.7 t ha-1.
The application of such a high PL rate (74.7 t ha-1) led to a degree of soil P saturation
of 21 % estimated with Mehlich-3 (DPSM-3), and a Mehlich-3 P (PM-3) concentration
(131 mg kg-1), below the threshold (critical) value, that most environmental indices
warn for a potential risk of P loss. Nevertheless, soil water soluble P (WSP)
concentration ranged quite above the environmental threshold level, indicating that
DPSM-3 values above which P losses are accentuated are lower than those found for
other less weathered soils. This fact demonstrates that soil test results or the DPS taken
solely provides limited indication into P loss potential and suggests the need of taking
the WSP into account to relate to P loss potential. As such, an environmental threshold
xi
potential. If such WSP threshold is taken into account, an estimated PL rate of 5.1 t ha-1
would be recommended. The observed changes in soil chemical attributes included
increases in soil nutrients concentration (N, P, K, Ca2+, Mg2+ and Zn), Na+, pH and total
C, and a decrease in exchangeable Al. Finally, the results indicate the PL rate required
to maximize CGY would lead to soil P saturation and a WSP concentrations that are
well above the environmental threshold. Hence, when recommending PL rate to corn it
is suggested that analysis of WSP should be taken into account other than simply grain
INTRODUCTION
The poultry industry in Brazil has developed remarkably in recent years
stimulated by the increase in exports and per capita consumption (ANUALPEC, 1999,
2007). The intensive poultry production yields a by-product, the poultry litter (PL),
which has been utilized for livestock feeding (AVIZOM, 2003). However, the
Normative Instruction NO 15, of July 17th, 2001, has prohibited the use of all sort of
manures or their derivatives for ruminant feeding in Brazil. Despite its excellent
characteristics either as nutrient source for plants or soil amendment, PL has been
poorly explored as organic fertilizer in commercial corn because there is limited
information for recommending it in fertilization schemes. Although it has been widely
utilized for horticultural crops such as green onion, sweet corn, carrot and Peruvian
carrot (Zarate et al., 2003a,b; Araújo et al., 2004), few studies have been carried out
aiming to establish adequate PL rates for corn (Cooperband et al., 2002; Zarate &
Vieira, 2003; Motavalli et al., 2003). In Minas Gerais state, for example, the PL rate is
recommended based on an equivalent to other types of manures; the ideal application
rate should be about ¼ of the recommended dose of beef cattle or dairy manure
(CFSEMG, 1999). In an exploratory greenhouse study aimed at evaluating the
agronomic potential of PL for corn production in two Oxisols with no previous manure
or inorganic fertilizer application, it was found that PL rates from 60 to 70 t ha-1 were
needed to maximize corn growth over three consecutive cultivations (Souza, 2004). On
the other hand, studies carried out in agricultural soils where PL is traditionally applied
suggest lower rates (Sistani et al., 2008) and warn for the potential risk of nutrient
accumulation, especially P, as its concentration in manures far exceeds plant demand.
So, the consecutive application of manures may lead to soil P enrichment and
subsequent loss to water bodies (Sharpley et al., 2001).
An adequate dose of manure must be applied so that beneficial effects on soil
chemical and physical properties can be achieved without harming the environment.
However, overestimated rates of PL can lead to the downward movement and overland
flow of P. Since natural water P levels are very low and limiting to growth of
organisms, the increase in water P due to non-point agricultural sources contribute to
2
More recently several analytical methods have been employed to predict and, or
monitor P losses from agricultural land to water bodies. Ammonium oxalate was one of
the first extractants used with such purpose and it has been used for acidic soils in the
Netherlands (van der Zee et al., 1987; Breeuwsma & Silva, 1992), Ireland (Maguire &
Sims, 2002a) and in the United States (Paulter & Sims, 2000). Since the utilization of
this method is limited by operational difficulties in routine soil fertility laboratories,
researchers have been exploring the possibility of using routine analytical protocols
with an environmental perspective. Among those methods, Mehlich-1 and Mehlich-3
have received more attention and they have proven good indicator of the potential for P
loss from soils to water bodies in temperate regions (Sims et al., 2000; McDowell &
Sharpley, 2001a, b). Since then, soil test P has become a popular measure and it has
been related to other factors that define water soluble P (WSP), an important indicator
for P loss potential. In fact, environmental agencies (USEPA, 2000; CONAMA, 2005;)
that regulate water quality established that P levels in natural waters or streams should
not exceed 0.1 mg L-1 of P.
The environmental thresholds are based on the fact that soils have a finite
capacity to adsorb P, then, as they become saturated, the extent of P being subjected to
desorption or even not adsorbed is increased. Thus, water soluble P is dependent on soil
P sorption capacity (PSC) (McDowell et al., 2001, Bond et al., 2006), and several
authors agree on utilizing the content of Fe and Al oxides in soils to represent their PSC
(Novais & Kamprath, 1978; Breeuwsma & Silva, 1992; Pautler & Sims, 2000; Maguire
and Sims, 2002a,b; Nair et al., 2002; Sims et al., 2002).
Environmental thresholds have been established as the point (soil P
concentration or P saturation degree) above which WSP concentrations increases
rapidly and, therefore, the risk of P loss is exacerbated. The degree of soil P saturation
(DPS), an index that provides an idea of the P status for a determined soil condition, has
been used to indicate that P concentrations can exceed a critical concentration well
before the soil is completely saturated with P (Breeuwsma & Silva, 1992). According to
Breeuwsma & Silva (1992) and Nair et al. (1998), soil ammonium oxalate
extractable-Al and -Fe content is suitable for predicting the PSC of an acid soil. However, given the
operational difficulties to extract soils with ammonium oxalate, Mehlich-3 or Mehlich-1
extractants have gained importance as routine methods that provide information on both
The present study was carried out under field conditions in an Ultisol (Argisol)
to evaluate corn grain yield, the changes in soil chemical characteristics, and the P loss
potential as a result of surface application of increasing rates of poultry litter for three
4
MATERIAL AND METHODS
A. Experimental Field Characteristics
The experiment was carried out in an Experimental Farm of the Federal
University of Viçosa, located in Coimbra County, MG. The altitude is 650 m.a.s.l.,
latitude 20° 45' S and longitude 45° 51' W with climate classified as CWA (warm and
humid summers with a mild and dry winter season) according to Köppen`s. The mean
annual air relative humidity is 85 % and the mean annual rainfall is 1350 mm,
concentrated from October to March. The soil is a clayey dystrophic Red-Yellow
Argisol (Ultisol) with less than 1 % slope and it has been cultivated over thirty years
with annual crops such as corn (Zea mays L.), common bean (Phaseolus vulgaris L.),
soybean (Glycine max (L.) Merrill) and wheat (Triticum aestivum). The area has
received regular chemical fertilization and liming during the cultivation period prior to
the current experiment installation.
B. Experiment Design and Management
The experiment consisted of six treatments in a completely randomized block
design, with four repetitions. Treatments were comprised by six rates of poultry litter
(0, 5, 10, 25, 50 and 100 t ha-1 on a dry weight basis) over three consecutive cropping
years (2004, 2005 and 2006). The plots were 4.0 m long and 5.4 m wide. Poultry litter
was broadcast on the soil surface 20 days prior to planting in order to minimize eventual
damage towards seedlings germination. Corn was sown in the beginning of the growing
season (late October) in rows with 0.9 m spacing, with a stand of 70 000 plants per
hectare. Weeds were controlled with pre-planting application of glyphosate
(N-(phosphonomethyl)-Glycine) and post-emergence atrazine
((2-chloro-4-ethylamino-6-isopropylamino-1,3,5-triazine) and nicosulfuron
(2-[[(4,6-dimethoxypyrimidin-2-yl)aminocarbonyl]aminosulfonyl]-N,N-dimethyl-3-pyridinecarboxamide) as
recommended by the manufacturer. In the winter, the area remained under fallow.
Approximately 150 days after planting the four central corn rows in the plot
were hand harvested and the cobs shelled on site. Corn kernel samples were collected
and the moisture content was determined (Multigrain moisture meter). This moisture
C. Sampling and chemical analysis of plant material
Corn leaves from 10 plants/plot were randomly collected during tasseling and
then combined to obtain a composite sample. In the laboratory, the leaves were washed
with deionized water and blotted with paper towel. Leaves were dried in a forced air
draft-oven at 70 ºC for 72 h, ground in a Wiley mill to pass through a 1 mm screen, and
stored until analysis. The ground leaf tissue was digested with a mixture of
nitro-perchloric acid at a 3:1 (v/v) ratio and the extracts were analyzed for P, K, Ca, Mg and
Zn. The N concentration was determined by the Kjeldahl method.
D. Soil sampling and analysis of soil and poultry litter
Five individual soil samples were collected from the 0 – 10, 10 – 20 and 20 – 40
cm layers at the harvest day using a manual coring device. These five samples were
combined to obtain a composite soil sample per plot. They were air-dried, ground to
pass through a 2 mm sieve and stored for subsequent analysis. Soil texture was
determined by a modification of the pipette method (Ruiz, 2005) (Table 2). Soil samples
were analyzed for pH in CaCl2 in a 1:2.5 soil:solution ratio (Table 2). Phosphorus, Fe,
Al and Zn were extracted either by Mehlich-1 1) (Mehlich, 1953) or Mehlich-3
(M-3) (Mehlich, 1984) and measured by ICP-OES.
To address the relationship between the two soil P extractants (M-1 and M-3) it
was employed a test to check models similarity (Leite & Oliveira, 2002). The
relationship between PM-1 and PM-3 had no significant difference (p > 0.01); that is the
intercept did not differ from zero and the angular coefficient did not differ from the
unity (Table 2). In the present study only the PM-3 results are reported.
Table 1. Size class components and pH in three layers of the Ultisol used in the poultry litter fertilization study, before treatment application
Sand Silt Clay pH CaCl2
cm
0 -- 10 18 17 65 4.2
10 -- 20 18 17 65 4.1
20 -- 40 12 17 71 4.4
%
6
Table 2. Relationship between PM-3 and PM-1 extractants in the 0-10 and 10-20 cm
depths of an Ultisol fertilized with increasing rates of poultry-litter
Soil layer (cm) fitted equation R2
0 -- 10 PM-3 = 8,64 + 0,98**PM-1 0,99
10 -- 20 PM-3 = -2,38 + 1,12** PM-1 0,98
Soil available K was extracted with Mehlich-3 and K in the extract was analyzed
by flame photometry. Exchangeable Ca2+, Mg2+, Na+ and Al3+ were extracted with 1
mol L-1 KCl and then analyzed by atomic absorption, except Na+, which was analysed
by flame photometry. Total N and C in the soil samples and that in the poultry litter
were analyzed by dry combustion in a continuous flow isotope ratio mass spectrometer
(20-20 ANCA-GSL, Sercon, Crewe, UK).
Poultry litter (PL) was collected in poultry houses that had used it in one flock
cycle in small farms in the vicinity of the experimental field. Poultry litter was analyzed
for water soluble P (WSP) and total P. Total P was obtained by ignition-extraction.
Shortly, the protocol consisted of igniting one gram of manure at 550 ºC for 2 h. The
ignited sample was collected in a 50 mL centrifuge tube containing 40 mL of 1 mol L-1
H2SO4. Another sample (non-ignited) also was extracted in a similar way. Both samples
(ignited and non-ignited) were, then, shaken overnight at 120 opm and, afterwards,
filtered through a slow flow rate paper filter and an aliquot of the filtrate was taken for P
determination by spectrophotometry following the phospho-molybdenum blue method
(Murphy & Riley, 1962). Phosphorus in organic compounds (Po) was estimated as the
difference between total P and orthophosphate, reactive P (Pi). WSP was obtained by
shaking 0.25 g of PL in a centrifuge tube containing 30 mL of distilled deionized water
during 2 h in a rotary set at 120 opm at 4 ºC. Following the centrifugation the tubes
were centrifuged at 4 500 g for 15 min at 4 ºC and the supernatant was transferred to
polyethylene bottles. The filtrates were appropriately diluted and analyzed for P by
spectrophotometry. Total concentrations of K, Ca, Mg, Na, Fe, Mn and Zn were
determined in aliquots from the ignited sample. Potassium and Na in the extracts were
analyzed by flame photometry and the other elements were analyzed by atomic
Table 3. Total concentrations (dry mass basis) of C, Na and other mineral nutrients in
the poultry litter
Element Content
--- g kg-1
---C 387
N 58
P* 9
K 170
Ca 20
Mg 3
Na 20
Zn 0,332
* Of the total P, 4 g kg-1 were water soluble
E. Reactive and unreactive dissolved phosphorus
Soil samples were analyzed for water dissolved P fractions by shaking soil
samples in 50 mL centrifuge tubes with deionized water at a 1:10 soil:water ratio for 2 h
in an rotary shaker at 120 opm at 4 ºC. Water dissolved P was determined
colorimetrically in the filtrates after passing them through in a 0.45 µm cellulose acetate
filter. This fraction is thereafter defined as dissolved reactive P (DRP). Total dissolved
P (TDP) was obtained by digesting an aliquot of the filtrate with K2S2O8 in acidic media
(0.2 g of K2S2O8 in 0.5 mol L-1 H2SO4) in an oven at ≈ 100 ºC overnight. The pH of the
digested samples was adjusted to ≈ 4.5 and P was determined colorimetrically. The
water dissolved unreactive P (DUP) fraction was obtained by subtracting DRP from
TDP.
F. Degree of soil phosphorus saturation
The relative degree of soil P saturation (DPSM-3) was estimated based on
concentrations of P (cmol kg-1), and Al plus Fe (cmol kg-1) extracted by Mehlich-3 as
follows:
It was adopted an value of 0.5 because it is most commonly used in studies with
temperate region soils (Breeuwsma & Silva, 1992; Maguire et al., 2001; Nair et al.,
2004), and it was aimed to compare our findings with those in the literature. x 100
P
8 G. Statistical Analysis
Linear regression analysis was performed to each variable dataset. Comparisons
between the soil layers were made using general linear regression models for each of the
soil layers separately differences in residual variance were observed.
The PL dose that led to the maximum physical efficiency (ŷ max) of grain yield
was estimated based on equations that relate CGY to PL rates. The maximum
economical yield was taken as the PL rate required to obtain a CGY equivalent to
0.9 ŷ max. The relationship between PM-1 and PM-3 was modeled using linear regression
RESULTS AND DISCUSSION
A. Grain yield as influenced by poultry litter rates
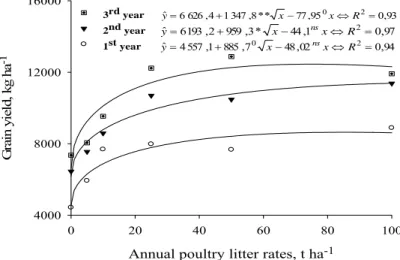
Corn grain yield was improved by the increasing PL rates in the three cropping
years. Upward shifts in grain yields were also observed over the years (Figure 1). It was
also observed that there was a significant residual effect of PL from one year to another
because the PL rate required to reach 90 % of the maximum physical grain yield
decreased in the second and third years as compared to the first year (Table 4).
Annual poultry litter rates, t ha-1
0 20 40 60 80 100
G rai n yi el d , k g ha -1 4000 8000 12000 16000 3rd year 2nd year 1st year 93 , 0 95 , 77 * * 8 , 347 1 4 , 626 6
ˆ= + x− 0x⇔R2=
y 97 , 0 1 , 44 * 3 , 959 2 , 193 6
ˆ= + − ⇔ 2=
R x x y ns 94 , 0 02 , 48 7 , 885 1 , 557 4
ˆ= + 0 x− x⇔R2=
y ns
Figure 1. Corn grain yield as a function of annual poultry litter rates surface broadcast
during three consecutive cropping years.
Besides the increase in grain yield along the PL rates in the first year, the gains
in yield as a result of PL application were proportionally smaller in the second and third
years, ranging from 4423 to 8880, 6450 to 11 377 and 7360 to 11914 kg ha-1,
representing maximum gains of 100.8, 76.4 and 61.9 % in comparison to the control,
10 B. Nutrient concentration in leaves
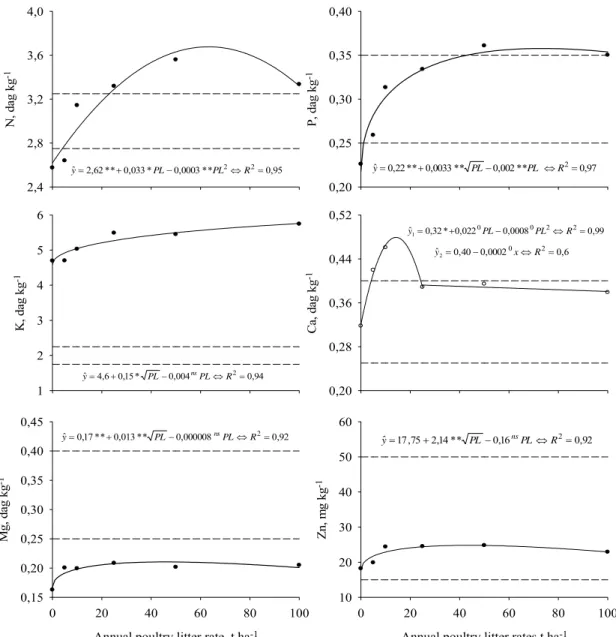
There was an increase in nutrients concentration in corn leaves along the applied
PL rates, except for Ca and Mg. Calcium concentration showed a positive quadratic
response up to a PL rate of 25 t ha-1, above which the concentrations decreased slightly
with PL rates (Figure 2). When compared to the suggested range of optimum nutrient
concentrations in corn leaves (Fancelli & Dourado Neto, 2000), K concentrations were
well above the critical level, suggesting luxury consumption. Magnesium
concentrations, on the other hand, were below the ideal concentration (Figure 2), even
when the soil Mg was increased by high PL applications (Figure 3). Leaf P and N
concentrations ranged within their adequate ranges when 5 and 10 t ha-1 PL was applied,
but reached excessively high values, accumulating at excessive concentrations at higher
PL rates. Zinc concentrations varied within its critical concentration. The decrease in
nutrient contents at higher PL rates are a result of dilution, thus, indicating that only Mg
seemed to have remained below the CL, possibly reflecting the low Mg content in the
PL (Table 3). However, the increase in exchangeable Mg2+ in the soil along the PL rates
N , da g kg -1 2,4 2,8 3,2 3,6 4,0 95 , 0 * * 0003 , 0 * 033 , 0 * * 62 , 2
ˆ= + PL− PL2⇔R2=
y P, d ag kg -1 0,20 0,25 0,30 0,35 0,40 97 , 0 * * 002 , 0 * * 0033 , 0 * * 22 , 0
ˆ= + PL− PL ⇔R2=
y K , d ag kg -1 1 2 3 4 5 6 94 , 0 004 , 0 * 15 , 0 6 , 4
ˆ= + PL− PL⇔R2=
y ns C a, d ag kg -1 0,20 0,28 0,36 0,44 0,52 99 , 0 0008 , 0 022 , 0 * 32 , 0
ˆ 0 0 2 2
1= + PL− PL ⇔R =
y 6 , 0 0002 , 0 40 , 0
ˆ 0 2
2= − x⇔R =
y
Annual poultry litter rate, t ha-1
0 20 40 60 80 100
M g, d ag kg -1 0,15 0,20 0,25 0,30 0,35 0,40 0,45 92 , 0 000008 , 0 * * 013 , 0 * * 17 , 0
ˆ= + PL− PL⇔R2=
y ns
Annual poultry litter rates t ha-1
0 20 40 60 80 100
Zn , m g k g -1 10 20 30 40 50 60 92 , 0 16 , 0 * * 14 , 2 75 , 17
ˆ= + PL− PL⇔R2=
y ns
Figure 2. Nutrient concentration in corn leaves as influenced by annual poultry litter
rates during three consecutive cropping years. The two parallel dashed lines encompass
the range of nutrient concentration considered as ideal for corn plants (Fancelli &
Dourado Neto, 2000).
C. Soil chemical characteristics
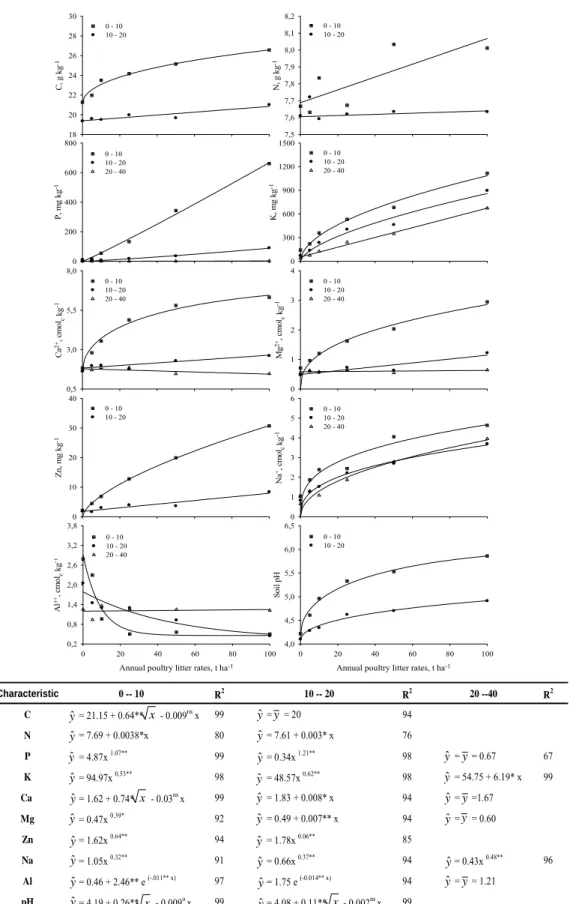
The increase in PL rates led to greater nutrient concentration in the more
superficial (0 to 10 cm) than in the deeper (10 to 20 cm) soil layer (Figure 3). The
surface enrichment of nutrients was expected because of the consecutive surface
12
concentrations increased up to 134 times in the 0-10 cm soil layer in comparison to the
control treatment soil, reaching values over 600 mg kg-1.
Potassium and Na were the mineral elements with the highest mobility along soil
depth, followed by Mg2+ and Ca2+ (Figure 3). Only K and Na+ had their concentrations
increased in the 20 to 40 cm soil layer. The high levels of exchangeable Na raise some
concerns because it may interfere in plant nutrition and perhaps lead to increased soil
dispersion and disaggregation (Thoma et al., 2007).
Soil pH also went up along the increments in PL rates and this might be largely
credited for the decrease in Al3+ and it might have partially contributed for the increase
in available and dissolved P concentrations in the soil. Soil pH probably increased due
to the presence of Ca(OH)2 in the PL as a consequence of its application on the floor of
C, g k g -1 18 20 22 24 26 28 30
0 - 10 10 - 20
N
, g kg
-1 7,5 7,6 7,7 7,8 7,9 8,0 8,1 8,2
0 - 10 10 - 20
P, m g k g -1 0 200 400 600 800
0 - 10 10 - 20 20 - 40
K, m g kg -1 0 300 600 900 1200 1500
0 - 10 10 - 20 20 - 40
Ca
2+, c
m
o
l kgc
-1
0,5 3,0 5,5 8,0
0 - 10 10 - 20 20 - 40
Mg
2+, c
m
o
l kgc
-1 0 1 2 3 4
0 - 10 10 - 20 20 - 40
Z n , m g k g -1 0 10 20 30 40
0 - 10 10 - 20
Na
+, c
m olc kg -1 0 1 2 3 4 5 6
0 - 10 10 - 20 20 - 40
Annual poultry litter rates, t ha-1 0 20 40 60 80 100
A
l
3+, c
m o lc kg -1 0,2 0,8 1,4 2,0 2,6 3,2 3,8
0 - 10 10 - 20 20 - 40
Annual poultry litter rates, t ha-1 0 20 40 60 80 100
So il p H 4,0 4,5 5,0 5,5 6,0 6,5
0 - 10 10 - 20
Characteristic 0 -- 10 R2 10 -- 20
R2 20 --40
R2
C = 21.15 + 0.64** - 0.009nsx 99 = = 20 94
N = 7.69 + 0.0038*x 80 = 7.61 + 0.003* x 76
P = 4.87x 1.07** 99 = 0.34x 1.21** 98 = = 0.67 67
K = 94.97x 0.53** 98
= 48.57x 0.62** 98 = 54.75 + 6.19* x 99
Ca = 1.62 + 0.74* - 0.03ns x 99 = 1.83 + 0.008* x 94 = =1.67
Mg = 0.47x 0.39* 92 = 0.49 + 0.007** x 94 = = 0.60
Zn = 1.62x 0.64** 94 = 1.78x 0.06** 85
Na = 1.05x 0.32** 91 = 0.66x 0.37** 94 = 0.43x 0.48** 96
Al = 0.46 + 2.46** e (-.011** x) 97
= 1.75 e (-0.014** x) 94 = = 1.21
pH = 4.19 + 0.26** - 0.009o
x 99 = 4.08 + 0.11** - 0.002ns
x 99 yˆ yˆ yˆ yˆ yˆ yˆ yˆ yˆ yˆ yˆ yˆ yˆ yˆ
yˆ yˆ
yˆ yˆ yˆ yˆ yˆ yˆ yˆ yˆ yˆ yˆ yˆ y y y y y x x x x
14
E. Mehlich-3 P, degree of soil P saturation and water soluble P
Available P (PM-3) concentrations ranged from 5 to 660 and 10 to 89 mg kg-1,
respectively, in the 0 to 10 and 10 to 20 cm soil layers and they were highly related to
the applied PL rates (p < 0.001). The degree of P saturation estimated with M3 (DPSM-3)
varied from 1 to 112 and 1 to 11 %, respectively, in these same soil layers (Figure 4 and
5b). No increment in PM-3 and DPSM-3 (p > 0.1) were observed for the 20 to 40 cm deep
soil layer, even under high PL rates. The PM-3 and DPSM-3 values observed under high
PL rates in the present study are well above the values considered of low risk to
excessive P losses. A PM-3 concentration range from 131 to 489 mg kg-1 in the 0 to 10
cm soil layer was achieved at the PL rate at which 0.9 ŷ max was reached. This high
soil P concentration, however, falls within a range of P concentration that several
studies suggest to pose a high potential for P losses and contamination of water bodies
(McDowell & Sharpley, 2001a,b; Sims et al., 2002; Abdala et al., 2007). This is
supported by the observed increase in DPSM-3 and soil WSP concentrations along the
PL rates (Figure 5a). In fact, the increase in WSP concentrations in the surface soil layer
were positive and highly related to the PL rates, varying from 0.8 to 50 mg kg-1 (p <
0.001), while in the 10 to 20 cm soil layer it was not significantly (p > 0.1) altered by
the PL rates.
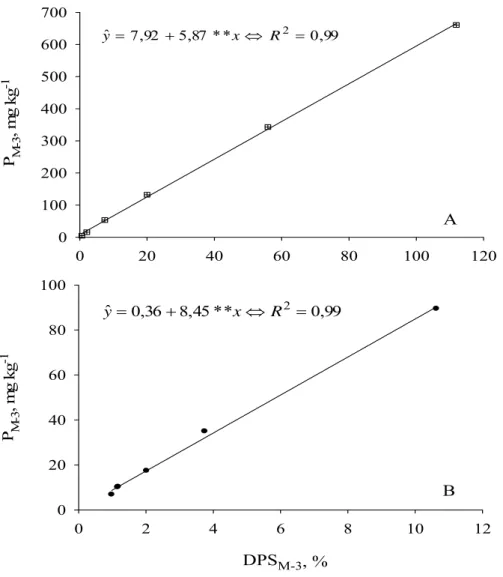
The relationship between PM-3 and DPSM-3 was linear with R2 of 0.99 and 0.98 at
the two soil depths, respectively (Figure 5).
Several authors (Breeuwsma & Silva, 1992; Nair et al., 2004) have demonstrated
that DPS values up to 25 % were identified as contributing to ground water pollution
with leached P. Sims et al. (2002) found that DPSM-3 values ranging from 25 to 40 %
and PM-3 of 152 mg kg-1 represent an environmental threshold for P losses in a wide
variety of less weathered soils of the Mid-Atlantic United States. Gebrim (2006) found
that PM-1 values of 150 mg dm-3 were an environmental threshold for P losses by
leaching in a Brazilian Oxisol with a large P sorption capacity. For a PL rate of 21.7 t
ha-1, which is necessary to reach 90 % of maximum grain yield (0.9 ŷ max), the DPSM-3
would be only 21 % in the 0 to 10 cm layer because of the high content of pooly
crystalline, ammonium oxalate-extractable, Fe and Al (4,550 mg kg-1). In comparison,
Sims et al. (2002) suggested a broader range of 25 to 40 % of DPSM-3 for soils with a
soil characteristics, as organic matter content play an important role on P sorption other
than simply the content of poorly crystalline Fe and Al.
0 20 40 60 80 100 120
P M-3 , m g k g -1 0 100 200 300 400 500 600 700 99 , 0 * * 87 , 5 92 , 7
ˆ = + x⇔ R2 =
y
0 2 4 6 8 10 12
P M-3 , m g k g -1 0 20 40 60 80 100 99 , 0 * * 45 , 8 36 , 0
ˆ = + x⇔ R2 =
y
DPSM-3, %
A
B
Figure 4. Mehlich-3 extractable phosphorus as a function of the degree of soil
phosphorus saturation (DPSM-3) at the 0 to 10 cm (A) and 10 to 20 cm (B) soil layers.
A curvilinear relationship was observed for WSP concentrations with increasing
PL rates, possibly as a result of the saturation of P sorption sites, and single slope
coefficients were greater for the dissolved reactive-P (DRP) than for dissolved
16
W
ate
r dis
sol
ve
d P, m
g
kg
-1 0 10 20 30 40 50 60 70 TDP DRP DUP 99 , 0 * * 003 , 0 * * 19 , 0 29 , 0ˆ=− + x+ x2⇔R2= y 99 , 0 * * 002 , 0 * * 10 , 0 12 , 0
ˆ=− + x+ x2⇔R2= y 99 , 0 * * 0009 , 0 * * 09 , 0 17 , 0
ˆ=− + x+ x2⇔R2= y
Annual poultry litter rates, t ha
-10
20
40
60
80
100
DPS
M-3, %
0
20
40
60
80
100
120
140
0 - 10
10 - 20
20 - 40
94 . 0 * * 13 , 1 2 62 , 0
ˆ=
x
⇔R =y 91 . 0 * * 27 , 1 2 03 , 0
ˆ=
x
⇔R =y
088 , 0 ˆ = y = y
A
B
Figure 5. Water dissolved P fractions (TDP: total water dissolved; DRP: water dissolved
reactive and DUP: water dissolved unreactive P) (A), and degree of soil P saturation
(DPSM-3) (B) as a function of increasing poultry litter rates applied during three
consecutive cropping years.
Reactive P was found to be the dominant water dissolved P fraction across the
applied PL rates, representing 66 % of TDP, while DUP accounted for only 34 % of
TDP. These increases in WSP concentrations did not vary much across the PL rates (10
desorbable than DRP (0.5 to 32.3 mg kg-1), especially at lower PL rates (Toor et al.,
2004; Anderson & Magdoff, 2005; Gebrim, 2006). Soil pH seems to play a key role in
this relationship, as its increase leads to a higher pH-dependant CEC in the colloids
surface and, therefore, a lower anionic adsorption is expected to take place as pH is
raised.
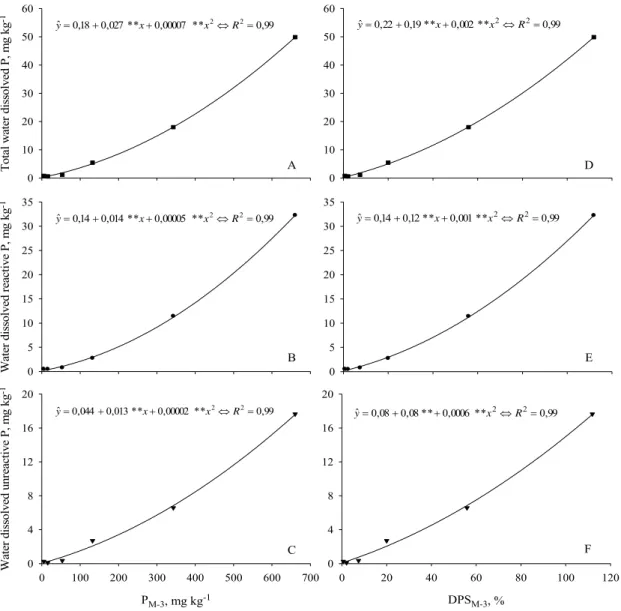
Water soluble P concentrations are usually highly related to increases in PM-3
(Bond et al., 2006) and DPSM-3 (Sims et al., 2002) in temperate, less weathered soils,
and such relationship was also found in the present study (Figure 6) with an oxidic soil.
Curvilinear relationships were also observed between WSP fractions across the PM-3 and
DPSM-3 ranges, which does not match fully the concept of changing point or threshold
values (split lines) proposed in previous research (Kleinman et al., 2000; Nair et al.,
2004). However, it demonstrates that for each unit increase in PM-3 concentration or
18 Tota l w at er di ssol ved P , m g kg -1 0 10 20 30 40 50 60 99 , 0 * * 00007 , 0 * * 027 , 0 18 , 0
ˆ= + + 2⇔ 2=
R x x y W at er di ssol ved r eact iv e P , m g kg -1 0 5 10 15 20 25 30 35 99 , 0 * * 00005 , 0 * * 014 , 0 14 , 0
ˆ= + + 2⇔ 2=
R x x
y
PM-3, mg kg-1
0 100 200 300 400 500 600 700
W at er di ssol ved unr eact iv e P , m g kg -1 0 4 8 12 16 20 99 , 0 * * 00002 , 0 * * 013 , 0 044 , 0
ˆ= + + 2⇔ 2=
R x x y 0 10 20 30 40 50 60 99 , 0 * * 002 , 0 * * 19 , 0 22 , 0
ˆ= + x+ x2⇔R2=
y 0 5 10 15 20 25 30 35 99 , 0 * * 001 , 0 * * 12 , 0 14 , 0
ˆ= + x+ x2⇔R2=
y
DPSM-3, %
0 20 40 60 80 100 120
0 4 8 12 16 20 99 , 0 * * 0006 , 0 * * 08 , 0 08 , 0
ˆ= + + x2⇔R2=
y F E D C B A
Figure 6. Total water dissolved P (A), water dissolved reactive (B) and unreactive P (C)
as a function of Mehlich-3 extractable P (PM-3). Total water dissolved P (D), water
dissolved reactive (E) and water dissolved unreactive (F) P as a function of the degree
of soil P saturation (DPSM-3).
As the DPS and PM-3 in soils should be ideally monitored in order not to reach
excessively high values, it was assessed the relationship between both PM-3 and DPSM-3
with PL rates (Figures 4 and 5b). The equations that describe the above relationships
were used to estimate the DPSM-3, and the PM-3 concentration that would lead to WSP
values above the critical value (> 1.0 mg L-1). Thus, it was estimated that DPSM-3 and
PM-3 values should not exceed 6.3 % and 28 mg kg-1 P, respectively, and the annual PL
which is significantly lower than the 21.7 t ha-1 required to obtain the maximum yield.
These results indicate that if PL rates are repeatedly applied using the sole criteria the
maximization of corn grain yield, there certainly will be a point in time that P
20
CONCLUSIONS
1. The repeated annual applications of PL improves soil fertility and corn nutrition,
which results in greater grain yield and a substantial residual fertilization effect over
time.
2. Fertilizing corn through poultry litter application to obtain maximum physical yield
implicate in severe consequences towards the environment as the effects of such high
PL rates were not only restricted to the topsoil, but also to deeper soil layers, as in the
case of available K and exchangeable Na and, at a lesser extent, available P,
exchangeable Mg and Ca.
3. An environmental PM-3 threshold of 28 mg kg-1 is achieved with a PL rate of
approximately 5.1 t ha-1, which allows obtaining less than the maximum grain yield.
However, a PL rates (21,7 t ha-1) sufficient to obtain 90 % of the maximum grain yield,
if reapplied annually, increases the degree of soil P saturation and total dissolved P,
posing a serious risk for P losses to water bodies.
4. The analysis of water soluble P should be taken into account to predict and counteract
REFERENCES
ABDALA, D. B.; SILVA, I. R; NOVAIS, R. F. & NUNES, F. N. Phosphorus mobility
potential in a highly weathered soil fertilized with poultry litter under field
conditions. In: XXXI CONGRESSO BRASILEIRO DE CIÊNCIA DO SOLO.
Gramado-RS, 2007
ANDERSON, B.H. & MAGDOFF, F. R. Relative movement and soil fixation of
soluble organic and inorganic phosphorus. J. Environ. Qual., 34:2228-2233,
2005.
ANUALPEC – Anuário da Pecuária Brasileira, São Paulo, FNP – Consultoria e
Comércio. Years: 1999 and 2007.
ARAÚJO, C.; ZARATE, N. A. H. & VIEIRA, M. C. Produção e perda de massa
pós-colheita de cenoura ‘Brasília’ considerando doses de fósforo e de cama de
frango semi decomposta. Acta Scientiarum, 26:131-138, 2004.
AVIZOM – Associação dos Avicultores da Zona da Mata (MG) (Informação pessoal –
José Davi Ervilha– Presidente), 2003.
BREEUSWMA, A., & S. SILVA. Phosphorus fertilization and environmental effects in
the Netherlands and the Po region (Italy). Rep. 57. Agric. Res. Dep. The Winand
Staring Centre for Integrated Land, Soil and Water Research. Wageningen, the
Netherlands, 1992.
BOND, C. R.; MAGUIRE, R. O.; HAVLIN, J. L. Change in soluble phosphorus in soils
following fertilization is dependent on initial Mehlich-3 phosphorus. J. Environ.
Qual., 35:1818-1824, 2006.
COMISSÃO DE FERTILIDADE DO SOLO DO ESTADO DE MINAS GERAIS.
22
em Minas Gerais – 5a aproximação. Ribeiro, A.C., Guimarães, P.T.G., Alvarez,
V.H. (Eds.) Viçosa, MG, Cap. 12. 1999. p. 87-92.
CONSELHO NACIONAL DO MEIO AMBIENTE-CONAMA. RESOLUÇÃO 357,
2005.
COOPERBAND, L.; BOLLERO, G. & COALE, F. Effect of poultry litter and
composts on soil nitrogen and phosphorus availability and corn production.
Nutr. Cyc. Agroec., 62:185-194, 2002.
FANCELLI, A. L. & DOURADO NETO, D. Produção de milho. Guaiba-SP, Editora
Agropecuária, 2000, 360p.
GEBRIM, F. O. Lixiviação de fósforo, bases, ânions inorgânicos e ácidos orgânicos em
solos tratados com camas de aviário. Tese de Mestrado (Solos e Nutrição de
Plantas). Universidade Federal de Viçosa, Viçosa, 2006. 95 p.
KLEINMAN, P. J. A.; BRYANT, R. B.; REID, W. S.; SHARPLEY, A. N. &
PIMENTEL, D. Using soil phosphorus behavior to identify environmental
thresholds. Soil Sci., 165:943-950, 2000.
LEITE, H. G. & OLIVEIRA, F. T. Statistical procedure to test the identity of analytical
methods. Commun. Soil Sci. Plant Anal., 33:1105-1118, 2002.
MAGUIRE, R. O.; FOY, R. H.; BAILEY, J. S. & SIMS, T. J. Estimation of the
phosphorus sorption capacity of acidic soils in Ireland. Eur. J. Soil Sci.,
52:479-487, 2001.
MAGUIRE, R. O. & SIMS, J. T. Measuring agronomic and environmental soil
phosphorus saturation and predicting phosphorus leaching with Mehlich-3. Soil
MAGUIRE, R. O. & SIMS, J. T. Soil testing to predict phosphorus leaching. J. Environ.
Qual. 31:1601–1609, 2002b.
MCDOWELL, R. W. & SHARPLEY, A. N. Approximating phosphorus release from
soils to surface runoff and subsurface drainage. J. Environ. Qual., 30:508-520,
2001a.
MCDOWELL, R. W. & SHARPLEY, A. N. Phosphorus losses in subsurface flow
before and after manure application to intensively farmed land. Sci. Total
Environ., 278:113-125, 2001b.
MEHLICH, A. Determination of P, Ca, Mg, K, Na, and NH4. Soil testing division
publication. North Carolina Department of Agriculture, Raleigh, NC. pp. 1–53,
1953.
MEHLICH, A. Mehlich 3 soil test extractant: A modification of Mehlich 2 extractant.
Commun. Soil Sci. Plant Anal., 15:1409–1416, 1984
MOTAVALLI, P. P.; ANDERSON, S.H. & PENGTHAMKEERATI, P. Surface
compaction and poultry litter effects on corn growth, nitrogen availability, and
physical properties of a claypan soil. Field Crops Res., 16:303-318, 2003.
MURPHY, J. & J.P. RILEY. A modified single solution method for the determination
of phosphate in natural waters. Anal. Chim. Acta, 27:31–36, 1962.
NAIR, V.D., GRAETZ, D.A. & REDDY, K.R. Dairy manure influences on phosphorus
retention capacity of Spodosols. J. Environ. Qual., 27:522–527, 1998.
NAIR, V. D. & GRAETZ, D. A. Phosphorus saturation in Spodosols impacted by
24
NAIR, V. D.; PORTIER K. M.; GRAETZ, D. G. & WALKER, M. L. An
Environmental threshold for degree of phosphorus saturation in sandy soils. J.
Environ. Qual., 33: 107–113, 2004.
NOVAIS, R. F. & KAMPRATH, E. J. Phosphorus supplying capacities of previously
heavily fertilized soils. Soil Sci. Soc. Am. J., 42:931-935, 1978.
PAUTLER, M. C. & SIMS, T. J. Relationships between soil test phosphorus, soluble
phosphorus and phosphorus saturation in Delaware soils. Soil Sci. Soc. A. J.,
64:765-773, 2000.
RUIZ, H. A. incremento da exatidão da análise granulométrica do solo por meio da
coleta da suspensão (silte + argila). R. Bras. Ci. Solo, 29:297-300, 2005
SISTANI, K. R.; SIKORA, F. J. & RASNAKE, M. Poultry litter and tillage influences
on corn production and soil nutrients in a Kentucky silt loam soil. Soil Till. Res.,
98:130-139, 2008.
SHARPLEY, A. N.; MCDOWELL, R. W. & KLEINMAN, P. J. A. Phosphorus loss
from land to water: integrating agricultural to environmental management. Plant
and Soil, 237:287-307, 2001
SIMS, J. T.; EDWARDS, A. C.; SCHOUMANS, O. F. & SIMARD, R. R. Integrating
soil phosphorus testing into environmentally based agricultural management
practices. J. Eviron. Qual., 29:60-72, 2000.
SIMS, J. T.; MAGUIRE, R. O.; LEYTEM A. B.; GARTLEY, K. L. & PAUTLER, M.
C. Evaluation of Mehlich-3 as an agri-environmental soil phosphorus test for the
Mid-Atlantic United States of America. Soil Sci. Soc. Am. J., 66:2016–2032,
2002.
SOUZA, C.R. Biodisponibilidade e transformações de formas de fósforo em camas de
31P. Tese de mestrado. (Solos e Nutrição de Plantas). Universidade Federal de
Viçosa, Viçosa, 2004. 76p.
THOMA, A. P. M.; FERNANDES, R. B. A.; ABDALA, D. B. & SILVA, I. R. Efeito
da adição de cama de aviário sobre as características físicas de um Argissolo. In:
XXXI CONGRESSO BRASILEIRO DE CIENCIA DO SOLO, Gramado-RS,
2007.
TOOR, G. S.; CONDRON, L. M.; DI, H. J. & CAMERON, K. C. Seasonal fluctuations
in phosphorus loss by leaching from a grassland soil. Soil Sci. Soc. Am. J.,
68:1429-1436, 2004.
USEPA-UNITED STATES ENVIRONMENTAL PROTECTION AGENCY. The
quality of our nation’s water. A summary of the national water quality inventory:
1998 Report to Congress. EPA 841-S-00-001, 2000.
VAN DER ZEE, S. E. A. T. M.; FOKKINK, L. G. J. & VAN RIEMSDIJK, W. H. A
new technique for assessment of reversibly adsorbed phosphate. Soil Sci. Soc.
Am. J., 51: 599–604, 1987.
ZARATE, N. A. H.; VIEIRA, M. C. & BRATTI, R. Efeitos da cama de frangos e da
época de colheita sobre a produção e a renda bruta da cebolinha “Todo Ano”.
Pesq. Agrop. Trop., 33: 73-78, 2003ª.
ZARATE, N. A. H. & VIEIRA, M. C. Produção do milho doce cv. Superdoce em
sucessão ao plantio de diferentes cultivares de inhame e adição de