forest in South‑Brazilian Leptosols
Mariana da Luz Potes(1), Deborah Pinheiro Dick(2), Graciele Sarante Santana(3), Michely Tomazi(4) and Cimélio Bayer(3)
(1)Embrapa Clima Temperado, Rodovia BR 392, Km 78, Caixa Postal 403, CEP 96010‑971 Pelotas, Brazil. E‑mail: marianapotes@yahoo.com.br (2)Universidade Federal do Rio Grande do Sul (UFRGS), Instituto de Química, Avenida Bento Gonçalves, no 9.500, CEP 91501‑970 Porto Alegre, RS, Brazil. E‑mail: deborah.dick@ufrgs.br (3)UFRGS, Departamento de Solos, Avenida Bento Gonçalves, no 7.712, CEP 91540‑000 Porto Alegre, RS, Brazil. E‑mail: gsarante@yahoo.com.br, cimelio.bayer@ufrgs.br (4)Embrapa Agropecuária Oeste, Caixa Postal 449, CEP 79804‑970 Dourados, MS, Brazil. E‑mail: mitomazi@yahoo.com.br
Abstract – The objective of this work was to evaluate the distribution pattern and composition of soil organic matter (SOM) and its physical pools of Leptosols periodically affected by fire over the last 100 years in South Brazil. Soil samples at 0–5, 5–10, and 10–15 cm depths were collected from the following environments: native pasture without burning in the last year and grazed with 0.5 livestock per hectare per year (1NB); native pasture without burning in the last 23 years and grazed with 2.0 livestock per hectare per year (23NB); and an Araucaria forest (AF). Physical fractionation was performed with the 0–5 and 5–10 cm soil layers. Soil C and N stocks were determined in the three depths and in the physical pools, and organic matter was characterized by infrared spectroscopy and thermogravimetry. The largest C stocks in all depths and physical pools were found under the AF. The 23NB environment showed the lowest soil C and N stocks at the 5–15 cm depth, which was related to the end of burning and to the higher grazing intensity. The SOM of the occluded light fraction showed a greater chemical recalcitrance in 1NB than in 23NB. Annual pasture burning does not affect soil C stocks up to 15 cm of depth.
Index terms: physical pools, carbon stock, chemical composition, chemical recalcitrance, thermo-decomposition.
Matéria orgânica do solo em pastagens afetadas pelo fogo e em mata de
Araucária em Neossolos sul‑brasileiros
Resumo – O objetivo deste trabalho foi avaliar o padrão de distribuição e a composição da matéria orgânica do solo (MOS) e de seus compartimentos físicos em um Neossolo periodicamente afetado pelo fogo nos últimos 100 anos, no Sul do Brasil. Amostras de solo foram coletadas nas profundidades de 0–5, 5–10 e 10–15 cm, nos seguintes ambientes: pastagem nativa sem queima há um ano e com lotação de 0,5 animal por hectare por ano (1NB); pastagem nativa sem queima há 23 anos e com lotação de 2,0 animais por hectare por ano (23NB); e mata de Araucária (AF). Fracionamento físico foi realizado com amostras das camadas de 0–5 e 5–10 cm. Os estoques de C e N do solo foram determinados nas três profundidades e nas frações físicas, e a matéria orgânica foi caracterizada por espectroscopia de infravermelho e termogravimetria. O maior estoque de C em todas as profundidades e as frações físicas foi verificado na AF. O ambiente 23NB apresentou o menor estoque de C e N do solo na profundidade de 5–15 cm, associado ao cessar fogo e à maior densidade de pastejo. A MOS da fração leve oclusa apresentou maior recalcitrância química em 1NB do que em 23NB. A queima anual da pastagem não afeta o estoque de C até 15 cm de profundidade.
Termos para indexação: frações físicas, estoque de carbono, composição química, recalcitrância química, termo-decomposição.
Introduction
Native pastures occupy approximately 23% of the Rio Grande do Sul State area, in Brazil, and provide forage for cattle and sheep breeding (Hasenack et al., 2007). Pasture management systems are mainly based on the intensity and frequency of grazing, grassland cutting,
Vegetation burning may promote an increase or decrease of soil organic matter (SOM) content
depending on fire intensity and duration, environmental
conditions, management systems, and other factors (Santín et al., 2008). Pasture burning is frequently associated with animal overstocking (Bertol et al., 1998), and, depending on grazing intensity, the combined management systems may promote the reduction of the soil carbon concentration (Abril et al., 2005). In an Oxisol under pasture in southern Brazil, the cessation of burning for eight years restored soil C stocks to the same levels found under native pasture unaffected by
fire for the last 41 years (Santana, 2010).
In addition to the effect on SOM stocks, vegetation burning may also change the chemical composition of SOM and produce black carbon. In a Haplic Luvisol under pasture, black carbon was observed within microaggregates (Brodowski et al., 2006). According to these authors, the enrichment of black carbon in these structures contributed to the formation and stabilization of microaggregates. Similarly, in Andosols, the
presence of black carbon was identified in particulate
and occluded fractions, whose chemical composition was highly aromatic (Golchin et al., 1997). One year after burning, black carbon-derived compounds were
identified in the B horizon of Spanish soils, as confirmed
by an increase in aromatic C content, indicating that some pyrogenic compounds may be transported into deeper soil horizons (Knicker et al., 2006).
The SOM distribution in physical pools may provide relevant information about the impact of the pasture management system on its dynamics. The light
fractions (free, occluded, and particulate >53 μm) are
usually highly sensitive to changes in soil management. The SOM free light fraction is stabilized mainly by its chemical recalcitrance, whereas, in the occluded light fraction, both physical protection and organo-mineral association mechanisms act in SOM stabilization (Christensen, 2001). Moreover, the contents and quality of the physical pools are usually useful tools to evaluate changes in SOM dynamics caused by the different management systems (Paul et al., 2008).
According to a previous study on pasture management in a Leptosol, vegetation burning after winter promoted an increase in the soil organic carbon (SOC) concentration and a higher proportion of biochemically labile structures, such as carbohydrates,
in comparison to pastures that were not exposed to fire
(Potes et al., 2010).
The objective of this work was to evaluate the distribution pattern and composition of SOM and its physical pools of Leptosols periodically affected by
fire over the last 100 years in South Brazil.
Materials and Methods
The experimental areas are located in São José dos Ausentes, Rio Grande do Sul State, Brazil (28o44'52"S
and 50o03'57"W, at approximately 1,200 m above sea
level). The climate is mesothermal, with an annual mean temperature of 14.4oC and annual rainfall of
2,468 mm (Streck et al., 2008). The soil is classified
as a Neossolo (Santos et al., 2006) or Leptosol (Soil Taxonomy) and has a clayey silty texture to a 5 cm depth and a clayey texture at the 5–15 cm layer. The native vegetation represents a transition zone between grassland and Araucaria sp. forest (Heringer & Jacques, 2002). The pasture areas have been subjected to annual burning immediately after winter for at least the past 100 years, and no liming or fertilization has ever been performed. The burning of the dried vegetation occurs rapidly due to the low humidity and temperature of the soil and vegetation (lower than 10°C) at the end of winter (August and September). Both the pasture and the Araucaria forest areas have been under native vegetation since the colonization of the region in the 18th century. The management
systems consisted of: native pasture without burning in the last year and grazed with 0.5 livestock per hectare per year (1NB) (28°36'4.4"S and 49°58'35.3"W); native pasture without burning in the last 23 years and grazed with 2.0 livestock per hectare per year (23NB) (28°35'26.9"S and 49°52'30.5"W); and Araucaria forest (AF) (28°36'1.9"S and 49°58'36.4"W). The original condition under Araucaria forest was used as a reference.
Soil sampling was performed at the end of winter
just before fire-setting. In each management system,
three pits of 1.0x1.0x0.20 m depth were opened, and undisturbed soil samples were collected in three soil layers: 0–5, 5–10, and 10–15 cm. The sampled soils were passed through a 9.51 mm sieve. The average particle size distribution (determined by the pipette method) consists of: 430 g kg-1 of clay, 427 g kg-1 of silt,
of clay, 393 g kg-1 of silt, and 140 g kg-1 of sand in the
5–10 cm layer; and 503 g kg-1 of clay, 353 g kg-1 of silt,
and 144 g kg-1 of sand in the 10–15 cm layer.
The total soil C and N contents were determined by
dry combustion (975°C) in each field replicate using a
Perkin Elmer 2400 (PerkinElmer, Waltham, MA, USA). The C content was assigned exclusively to SOM, as all soil samples were carbonate free. The soil organic carbon (Csoil) and nitrogen (Nsoil) stocks (Mg ha-1)
were quantified by correcting the concentration values
using the 23NB environment as the baseline reference. This procedure normalizes the different effects the management systems have on soil bulk density from undisturbed soil cores (6.5 cm in diameter and 5.0 cm long). For this purpose, the following equation was used (Gatto et al., 2010): Csoil or Nsoil = (Ec × ρb × T)/10,
in which Csoil or Nsoil is the total soil organic carbon or
total soil nitrogen stocks (Mg ha-1), respectively; Ec is
the element concentration (g kg-1); ρ
b is the field bulk
density (g cm-3); and T is the thickness of the soil layer
(cm).
The density fractionation of the SOM was performed according to a method adapted from Conceição et al. (2008), with <9.51 mm soil aggregates of the 0–5 and 5–10 cm layers. The adaptation was necessary for the effective separation of the free light fraction (FLF) due to the resistance of the aggregates to absorbing the sodium polytungstate (SPT) solution. This behavior was caused by the high SOM content, which hindered the SPT absorption due to its hydrophobic character and to the blocking of pores. Consequently, air bubbles were trapped inside the aggregates, preventing them from being disrupted and from decanting. To avoid this problem, approximately 10 g of soil were wetted by capillarity prior to the density fractionation by laying
the sample on a filter paper embedded in distilled
water for 12 hours. The amount of absorbed water was gravimetrically determined, and, in the preparation of the SPT solution, this amount was considered to
have a final density of 2.0 g cm-3 during the physical
fractionation.
Approximately 80 mL of the SPT solution with a density of 2.0 g cm-3 was added to the wetted samples
in a centrifuge tube. The tube was closed with a rubber
stopper and gently inverted five times to release the
FLF located between aggregates. The suspension was centrifuged at 2,000 g for 90 min, and the supernatant
containing the FLF was filtered under vacuum in a
0.45 μm glass fiber filter (Whatman GF/A, Whatman,
Inc., Clifton, NJ, USA), having been previously
weighed. The material on the filter was washed with
distilled water, followed by a 0.01 mol L-1 CaCl 2
solution to remove the SPT solution, and finally by
distilled water (200 mL) to remove the remaining CaCl2. The filtered SPT solution was returned to the
tube containing the aggregate pellet and the suspension was sonicated (Vibracell VC 750, Vibracell Comércio de Eletrônicos, São Paulo, SP, Brazil) at 400 J mL-1 to
break up the aggregates and, consequently, release the occluded light fraction (OLF).
After soil dispersion, the suspension was centrifuged
and filtered following the procedure performed with the
FLF. The residual soil (heavy fraction, HF) remaining in the tube after the separation of the light fractions was washed with distilled water (200 mL) and with a 0.01 mol L-1 CaCl
2 solution. The separated fractions
were oven-dried at 50°C and then weighed and ground. The C and N contents of the light fractions (FLF and OLF) were determined following the procedure used for all soil depths. The complete removal of SPT from the HF is not always possible; therefore, this fraction may remain contaminated by this reagent. The contents of C and N contained in the HF were determined by the difference between the element content in the soil and the respective content in the two light fractions. After
discounting the weight of the filter, the C and N stocks
(Mg ha-1) of the physical fractions were calculated, a
procedure that was also applied to the whole soil. The physical fractions were treated with a 10% (v v-1) hydrofluoric acid solution (Gonçalves et al.,
2003), resulting in a concentrated SOM sample (FLFHF,
OLFHF, and HFHF). The organic fraction of the FLF
and OLF was removed by treatment with hydrogen peroxide (H2O2) 30% (v v-1) (Silva et al., 2008) to
isolate the mineral fraction (FLFH2O2 and OLFH2O2).
The untreated light fractions (FLF and OLF), the SOM concentrated samples (FLFHF, OLFHF, and HFHF),
and the peroxide-treated FLF and OLF (FLFH2O2 and
OLFH2O2) were analyzed by fourier transform infrared
(FTIR) spectroscopy (Shimadzu FTIR 8300, Shimadzu, Kyoto, Japan) in KBr pellets (1.0 mg sample:100 mg KBr) using 32 scans and a resolution of 4.0 cm-1 within
the range of 4,000 to 500 cm-1. The absorption band
a thermo-gravimetric analyzer (TGA-Q50, TA Instruments, New Castle, DE, USA) with 5 to 10 mg samples over static air. The initial weight was stabilized at 40°C, and a heating curve was obtained with a heating rate of 10°C min-1 up to 105°C, with a holding time of
10 min, followed by heating at 5°C min-1 up to 700°C.
The FLF from the 0–5 cm layer was analyzed in the
untreated form, since its yield after hydrofluoric acid
treatment was small. To isolate the weight loss of the FLF in the temperature interval from 105 to 600°C due to the inorganic matrix, a TGA analysis was performed with the sample FLFH2O2. The observed weight loss
was then subtracted from that of the untreated FLF in the same temperature interval. The other OLFHF and
HFHF samples were analyzed in the 0–5 and 5–10 cm
layers. The thermo-decomposition curves were divided into four regions selected according to the sample
decomposition behavior during heating: the first region
was from 40 to 105ºC; the second, from 105 to 350ºC (1NB and AF) or 105 to 425ºC (23NB); the third, from 350 to 600ºC (1NB and AF) or 425 to 600ºC (23NB); and the fourth region was from 600 to 700ºC. The quotient of the weight loss between that of the third
and the second region was calculated and defined as a
thermogravimetric index (TGI) (Benites et al., 2005). The results of the soil C and N stocks and density fractionation were evaluated by descriptive data analysis based on the mean standard error.
Results and Discussion
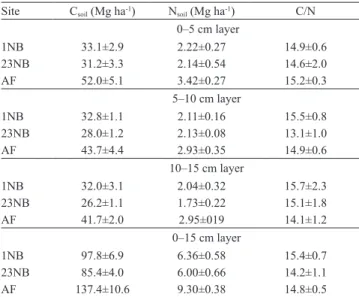
The SOC stocks varied between 26.2 and 52.0 Mg ha-1 in the studied layers (Table 1). In the 1NB system,
the SOC stocks were relatively uniform up to a depth of 15 cm. In contrast, the SOC stocks in the 23NB system tended to decrease with depth, from 31 to 26 Mg ha-1.
Furthermore, the SOC stock values in the 5–10 and 10–15 cm layers in 23NB were lower than those found under 1NB. This behavior can be related to the more intensive grazing in 23NB, which reduces the input of vegetal residue to the soil, in comparison to 1NB. In an Argentinean Aluvisol, the effect of overgrazing in suppressing the development of the root system and, therefore, depleting the soil C (Harris et al., 2007), surpassed the positive fertilizing effect of pasture burning on the accumulation of soil C (Abril et al., 2005).
The total N stocks did not differ between the two pasture systems in the three soil layers (Table 1). The soil under AF showed, in all layers, larger SOC and N stocks, when compared with the pasture environments. These results can be attributed to the high plant residues and shoot production in the forest environment (Backes et al., 2005).
The cumulative C stock up to a 15 cm depth in 1NB was approximately 9.4 Mg ha-1, greater than in 23NB
(Table 1), indicating that the soil under frequent burning
and low grazing was more efficient at accumulating
C than 23NB. The C/N ratio did not differ within the environments except at the 5–10 cm layer, in which 1NB had a higher C/N ratio than 23NB.
In the pasture systems, the C stocks contained in the free light fraction varied from 0.26 to 1.43 Mg ha-1
(Table 2), and the contribution of CFLF to the soil C
stock was less than 4% (Figure 1). Regardless of the pasture system, the CFLF stocks decreased with depth
(Table 2), as is usually observed (Boeni, 2007). In both layers, the largest values were found in the 23NB system.
The COLF stocks varied from 4.48 to 8.55 Mg ha-1
in the pasture systems and were approximately 1.9 to 13 times larger than the CFLF stocks (Table 2). These
Table 1. Average±standard deviation of soil organic carbon
and N stocks and C/N ratio in bulk soil (Csoil and Nsoil)of the 0–5, 5–10, 10–15, and 0–15 cm layers of a Leptosol under native pasture without burning in the last year (1NB), native pasture without burning in the last 23 years (23NB), and Araucaria forest (AF)(1).
Site Csoil (Mg ha-1) Nsoil (Mg ha-1) C/N
0–5 cm layer
1NB 33.1±2.9 2.22±0.27 14.9±0.6
23NB 31.2±3.3 2.14±0.54 14.6±2.0
AF 52.0±5.1 3.42±0.27 15.2±0.3
5–10 cm layer
1NB 32.8±1.1 2.11±0.16 15.5±0.8
23NB 28.0±1.2 2.13±0.08 13.1±1.0
AF 43.7±4.4 2.93±0.35 14.9±0.6
10–15 cm layer
1NB 32.0±3.1 2.04±0.32 15.7±2.3
23NB 26.2±1.1 1.73±0.22 15.1±1.8
AF 41.7±2.0 2.95±019 14.1±1.2
0–15 cm layer
1NB 97.8±6.9 6.36±0.58 15.4±0.7
23NB 85.4±4.0 6.00±0.66 14.2±1.1
AF 137.4±10.6 9.30±0.38 14.8±0.5
results can be associated to the protection of the SOM enclosed in the aggregates, hindering its further microbial decomposition (Conceição et al., 2008). In the 0–5 cm layer, the COLF under 1NB surpassed the
3.85 Mg ha-1 of C found in 23NB, whereas in the
5–10 cm layer the opposite behavior was observed (Table 2). In the 1NB environment, COLF/Csoil decreased
from 26 to 14% with depth (Figure 1), as is normally reported for soils under pasture and under no-tillage (Boeni, 2007). In 23NB, however, this ratio increased from 15 to 19% with depth, indicating that a breakdown of aggregates in the 0–5 cm surface layer occurred due to the higher grazing pressure in this system, promoting a higher decomposition of the OLF.
The C stock contained in the heavy fraction contributed with approximately 72 to 86% of the SOC stock (Figure 1). In the 23NB system, the CHF stock did
not vary with depth, but increased from the 0–5 to the 5–10 cm layer in the 1NB system. In the subsurface layer, CHF was greater in the 1NB system than in 23NB
(Table 2).
In the 1NB system, a redistribution of the C stocks with depth occurred without a concomitant change of the total SOC (Table 1). The C stocks of both light fractions decreased from the 0–5 to the 5–10 cm layer; however, there was an increase of CHF stocks (Table 2).
In the pasture system unaffected by fire for the last 23
years and with a higher grazing intensity, the CFLF and
CHF stocks tended to decrease with depth.
Among the studied environments, the soil under AF showed the largest stocks of CFLF and of COLF in
the 0–5 cm layer (Table 2), representing 21 and 26% of SOC, respectively (Figure 1). These results can be attributed to the higher input of residues from forest litter, compared with pasture systems (Backes et al., 2005). In the subsurface layer (5–10 cm), the strong reduction of 9.91 Mg ha-1 in the C
FLF, in comparison
to the above layer (Table 2), was probably due to the lower input of litter at this depth, resulting in a lower proportion of CFLF/Csoil (2%) (Figure 1). The COLF stocks
in the 5–10 cm layer remained the highest under AF,
Table 2. Average±standard deviation of soil C and N stocks
in physical pools and C/N ratio in the 0–5 and 5–10 cm layers of a Leptosol under native pasture without burning in the last year (1NB), native pasture without burning in the last 23 years (23NB), and Araucaria forest (AF)(1).
Site C (Mg ha-1) N (Mg ha-1) C/N C (Mg ha-1) N (Mg ha-1) C/N -- (0–5 cm) -- - (5–10 cm)
---Free light fraction (FLF)
1NB 0.65±0.06 0.02±0.01 32.5±7.6 0.26±0.07 0.01±0.00 25.7±7.0 23NB 1.43±0.11 0.07±0.01 20.4±4.5 0.90±0.21 0.03±0.01 30.0±6.9
AF 10.81±1.22 0.60±0.14 18.0±5.1 0.90±0.07 0.05±0.01 18.4±3.5 Occluded light fraction (OLF)
1NB 8.55±1.96 0.49±0.13 17.4±0.6 4.48±0.21 0.25±0.02 18.0±0.9
23NB 4.70±0.59 0.30±0.03 15.5±1.9 5.38±0.19 0.27±0.01 19.7±0.4 AF 13.71±2.12 0.76±0.13 18.1±0.3 10.38±2.00 0.64±0.13 16.3±1.2
Heavy fraction (HF)
1NB 23.90±0.86 1.70±0.15 14.1±0.8 28.04±0.94 1.84±0.16 15.3±0.9 23NB 25.06±2.98 1.77±0.56 14.7±2.7 21.69±1.54 1.84±0.07 11.8±1.2 AF 27.51±2.90 2.06±0.16 13.4±1.5 32.37±4.98 2.24±0.37 14.5±0.7
(1)Average of three replicates.
Figure 1. Proportion of soil C stock contained in the free
whereas the CHF was only greater than that found under
23NB. Therefore, the greater capacity of the forest system to accumulate SOM, compared with the pasture systems, occurs mainly due to the SOM accumulation in both light fractions.
The N stocks in the SOM physical pools increased in the order FLF < OLF < HF in all the evaluated systems. In general, no relevant differences between the layers were observed (Table 2). Under AF, the N stocks in both light fractions were larger than those observed in the 23NB system.
The C/N ratio in all systems tended to decrease in the order FLF > OLF > HF in both layers (Table 2), indicating an increase of SOM decomposition in the same order, as expected (Golchin et al., 1994; Tomazi, 2008). The occurrence of microbial products (low C/N ratio) in the HF contributed to its smallest value among the three fractions (Diekow et al., 2005). In general, the C/N ratio in a given fraction did not differ among the pasture systems, and the obtained values were not indicative of black carbon, being within the range observed for light fractions in agricultural soils (Boeni, 2007).
The FTIR spectra of the mineral matrix of the FLF (FLFH2O2) from the 0–5 cm layer showed the following
absorption bands: two peaks at approximately 3,695 and 3,620 cm-1 due to the Al–OH inner and outer
stretching of kaolinite, bands at approximately 1,084 and 912 cm-1, attributable to the O–Al–OH vibration
of kaolinite, and a band at 1,034 cm-1 due to the Si–O
stretching of quartz (Figure 2). In the FLFH2O2 spectra
from the 1NB and AF environments (Figure 2), a triplet at 3,620, 3,526, and 3,447 cm-1 was also identified and
was assigned to O–Al–OH vibrations of gibbsite. The
same bands, though less intense, were identified in the
spectra of the untreated FLF and OLF. These results are evidence of the association of kaolinite and gibbsite (1NB and AF) with the SOM in both light fractions of this soil.
In the spectra of the untreated light fractions (Figure 2), absorption bands resulting from the presence of SOM were detected only at 2,921 and 2,852 cm-1 and
were assigned to the C–H stretching of aliphatic groups.
The hydrofluoric acid treatment removed a great part
of the inorganic matrix, and the spectra of the treated fractions (FLFHF, OLFHF, and HFHF) showed the typical
pattern of SOM (Figure 2): a band at 3,380 cm-1 due to
O–H stretching; bands at 2,921 and 2,852 cm-1; a peak
Figure 2. FTIR spectra of the H2O2-treated free light
approximately 1,540 cm-1 attributable to N–H and C=N
stretching; a peak at 1,726 cm-1 due to C=O stretching of
the COOH group; a band at 1,645 cm-1, resulting from
the C=C vibration of the aromatic groups; and a band at approximately 1,235 cm-1 due to C–O stretching of
carboxylic acid. The HFHF spectra had a stronger band
at approximately 1,075 cm-1 attributable to the C–O
stretching of carbohydrate, showing a high proportion of compounds of microbial origin (Wiesmeier et al., 2009). No differences concerning the FTIR spectra
of a given fraction were identified among the studied
environments.
For T<105°C, the weight loss varied between 1.9 and 7.5% (Table 3), corresponding to the loss of hygroscopic water from the organic matter (Critter & Airoldi, 2006). In general, the largest weight loss occurred in the second (11 to 50%) or third (6.5 to 49%) temperature intervals. The mass loss in the second
interval (105–350°C or 105–425°C) corresponds to the decomposition of higher thermolabile structures, such as alkyl and O–alkyl structures, phenolic and carboxylic groups, and even some alkyl-aromatic groups (Critter & Airoldi, 2006). In the third temperature interval (350– 600°C or 425–600°C), less thermolabile structures, such as aromatic structures, decompose (Rosa et al., 2005).
The weight loss at 600 to 700°C was very low (≤1.4%)
and may be assigned to highly thermostable structures, including condensed aromatic structures. The residual mass for T>700°C was considerably high in the FLF (59 to 80%), corresponding to the inorganic soil matrix adsorbed onto the untreated FLF, as shown by the FTIR spectra (Table 3). For the HF-treated OLF (OLFHF), this
residue varied between 13 and 18% and is probably derived from inorganic components of the partially decomposed residues – e.g., Si–O (Silva et al., 2008) –, as indicated by the absorption band at 1,034 cm-1 in
the OLFHF FTIR spectra (Figure 2). The HFHF showed
a higher proportion of residue mass at T>700°C (18 to 29%), probably due to the high abundance of quartz
that is not completely dissolved by the hydrofluoric
treatment and due to some neo-precipitated minerals formed during the acid treatment (Dick et al., 2008).
The TGI indicates the proportion between the less and the more thermolabile structures. Considering that thermolability is inversely related to chemical recalcitrance, higher values of the TGI represent a higher chemical recalcitrance of the SOM structure (Benites et al., 2005).
Within the pasture environments, the smallest TGI value of the FLF in the 0–5 cm layer was found in 1NB, indicating a higher proportion of higher thermolabile structures in the SOM of the recently burned environment. The opposite situation was observed with the OLFHF (TGI1NB > TGI23NB), which
indicates the predominance of structures with a higher chemical recalcitrance in this fraction. The same behavior occurred with the OLF from the 5–10 cm layer (Table 3), which could be indicative of the occurrence of black carbon. The presence of black carbon in the
particulate fraction of agriculture soils was identified
in other studies in southern Brazil (Diekow et al., 2005; Brodowski et al., 2006). However, the obtained C/N ratios in the present study did not differ between FLF and OLF (Table 2), and therefore, do not corroborate the occurrence of black carbon in 1NB.
Table 3. Mass loss in four temperature intervals(1), mass
residue for T>700°C, and thermogravimetric index (TGI) of soil organic matter physical pools of the 0–5 and 5–10 cm layers of a Leptosol under native pasture without burning in the last year (1NB), native pasture without burning in the last 23 years (23NB), and Araucaria forest (AF).
Site Mass loss (%) Mass residue TGI
1st region 2nd region 3rd region 4th region (%)
Free light fraction (FLF) – 0–5 cm
1NB 1.93 11.21 6.50 0.09 80.27 0.76(2)
23NB 3.97 19.41 17.11 0.25 59.26 0.99(2)
AF 3.50 20.20 14.12 0.26 61.93 0.73(2)
Occluded light fraction(3) (OLF) – 0–5 cm
1NB 4.74 32.81 43.56 0.97 17.92 1.33
23NB 5.74 48.65 31.71 0.63 13.27 0.65
AF 5.00 29.88 46.10 1.53 17.49 1.54
Heavy fraction(3) (HF) – 0–5 cm
1NB 4.61 30.32 39.33 0.04 25.71 1.29
23NB 5.29 31.73 39.50 0.08 23.40 1.24
AF 4.27 32.68 42.84 0.08 20.14 1.31
Occluded light fraction(3) (OLF) – 5–10 cm
1NB 5.74 33.53 46.83 0.63 13.27 1.40
23NB 4.50 49.94 30.42 0.94 14.20 0.61
AF -(4) - - - -
-Heavy fraction(3) (HF) – 5–10 cm
1NB 4.24 28.34 38.63 0.00 28.99 1.36
23NB 7.50 31.16 40.58 1.39 19.37 1.30
AF 5.01 27.66 48.59 0.05 18.69 1.75
(1)Temperature intervals for the 1st region: 40–105ºC; 2nd region: 105–350ºC
(1NB and AF) and 105–425ºC (23NB); 3rd region: 350–600ºC (1NB and
AF) and 425–600ºC (23NB); 4th region: 600–700ºC. (2)Thermogravimetric
index calculated after subtracting the inorganic matrix contribution. (3)Soil
The TGI values in the HF were similar in the 1NB and 23NB systems, in both layers (Table 3), indicating
that pasture management did not significantly affect the
chemical recalcitrance of this fraction. The TGI values for the AF fractions followed the same trend observed for 1NB: in the 0–5 cm layer, it decreased in the order OLF > HF > FLF. With the exception of the FLF, the TGI for a given fraction was always larger under AF, indicating the occurrence of more recalcitrant SOM under forest.
Conclusions
1. Annual pasture burning does not affect soil C stocks up to 15 cm of depth, but promotes a redistribution of soil organic matter (SOM) in physical pools with increasing depth.
2. The frequent burning of vegetation promotes an increase of SOM chemical recalcitrance in the occluded
fraction, although black carbon was not identified.
3. The cessation of burning for the last 23 years and a higher grazing intensity promote a decrease of C stocks in the 5–15 cm layer, and a redistribution of the C stock from the occluded fraction to the heavy fraction seems to have occurred in the 0–5 cm layer.
4. The soil under forest shows larger C stocks in the whole soil than in the pasture systems, a behavior that is due to the C accumulation in the light fractions, and SOM chemical recalcitrance is comparatively higher in all SOM physical pools under forest.
Acknowledgements
To Conselho Nacional de Desenvolvimento Científico
e Tecnológico, to Coordenação de Aperfeiçoamento de Pessoal de Nível Superior, and to the German Academic
Exchange Service, for financial support.
References
ABRIL, A.; BARTTFELD, P.; BUCHER, E.H. The effect of fire and overgrazing disturbes on soil carbon balance in the Dry Chaco forest. Forest Ecology and Management, v.206, p.399-405, 2005.
BACKES, A.; PRATES, F.L.; VIOLA, M.G. Produção de serapilheira em Floresta Ombrófila Mista, em São Francisco de Paula, Rio Grande do Sul, Brasil. Acta Botanica Brasilica, v.19, p.155-160, 2005.
BENITES, V. de M.; MENDONÇA, E. de S.; SCHAEFER, C.E.G.R.; NOVOTNY, E.H.; REIS, E.L.; KER, J.C. Properties
of black soil humic acids from high altitude rocky complexes in Brazil. Geoderma, v.127, p.104-113, 2005.
BERTOL, I.; GOMES, K.E.; DENARDIN, R.B.N.; MACHADO, L.A.Z.; MARASCHIN, G.E. Propriedades físicas do solo relacionadas a diferentes níveis de oferta de forragem numa pastagem natural. Pesquisa Agropecuária Brasileira, v.33, p.779-786, 1998.
BOENI, M. Proteção física da matéria orgânica em solos de
Cerrado afetada pela pastagem. 2007. 136p. Tese (Doutorado) –
Universidade Federal do Rio Grande do Sul, Porto Alegre.
BRODOWSKI, S.; JOHN, B.; FLESSA, H.; AMELUNG, W. Aggregate-occluded black carbon in soil. European Journal of
Soil Science, v.57, p.539-546, 2006.
CHRISTENSEN, B.T. Physical fractionation of soil and structural and functional complexity in organic matter turnover. European
Journal of Soil Science, v.52, p.345-353, 2001.
CONCEIÇÃO, P.C.; BOENI, M.; DIECKOW, J.; BAYER, C.; MIELNICZUK, J. Fracionamento densimétrico com politungstato de sódio no estudo da proteção física da matéria orgânica em solos.
Revista Brasileira de Ciência do Solo, v.32, p.541-549, 2008.
CRITTER, S.A.M.; AIROLDI, C. Thermal analysis of Brazilian tropical soils originating from different sources. Journal of the
Brazilian Chemical Society, v.17, p.1250-1258, 2006.
DAMÉ, P.R.V.; QUADROS, F.L.F. de; KERSTING, C.E.B.; TRINDADE, J.P.P.; LONDERO, F.A.A. Efeitos da queima seguida de pastejo ou diferimento sobre a produção, qualidade, cobertura do solo e sistema radicular de uma pastagem natural. Ciência Rural, v.27, p.133-137, 1997.
DICK, D.P.; SILVA, L.B. da; INDA, A.V.; KNICKER, H. Estudo comparativo da matéria orgânica de diferentes classes de solos de altitude do Sul do Brasil por técnicas convencionais e espectroscópicas. Revista Brasileira de Ciência do Solo, v.32, p.2289-2296, 2008.
DIEKOW, J.; MIELNICZUK, J.; KNICKER, H.; BAYER, C.; DICK, D.P.; KÖGEL-KNABNER, I. Carbon and nitrogen stocks in physical fractions of a subtropical Acrisol as influenced by long-term no-till cropping systems and N fertilisation. Plant and Soil, v.268, p.319-328, 2005.
GATTO, A.; BARROS, N.F. de; NOVAIS, R.F.; SILVA, I.R. da; LEITE, H.G.; LEITE, F.P.; VILLANI, E.M. de A. Estoques de carbono no solo e na biomassa em plantações de eucalipto. Revista
Brasileira de Ciência do Solo, v.34, p.1069-1079, 2010.
GOLCHIN, A.; BALDOCK, J.A.; CLARKE, P.; HIGASHI, T.; OADES, J.M. The effects of vegetation and burning on the chemical composition of soil organic matter in a volcanic ash soil as shown by 13C NMR spectroscopy. II. Density fractions. Geoderma, v.76,
p.175-192, 1997.
GOLCHIN, A.; OADES, J.M.; SKJEMSTAD, J.A.N.; CLARKE, P. Study of free and occluded particulate organic matter in soils by solid state 13C CP/MAS NMR spectroscopy and scanning
electron microscope. Australian Journal of Soil Research, v.32, p.285-309, 1994.
10% HF treatment on the resolution of CPMAS 13C NMR spectra
and on the quality of organic matter in Ferralsols. Geoderma, v.116, p.373-392, 2003.
HARRIS, W.N.; MORETTO, A.S.; DISTEL, R.A.; BOUTTON, T.W.; BÓO, R.M. Fire and grazing in grasslands of the Argentine Caldenal: effects on plant and soil carbon and nitrogen. Acta
Oecologica, v.32, p.207-214, 2007.
HASENACK, H.; CORDEIRO, J.L.P.; COSTA, B.S.C. Cobertura vegetal atual do Rio Grande do Sul. In: SIMPÓSIO DE FORRAGEIRAS E PRODUÇÃO ANIMAL, 2., 2007, Canoas.
Anais. Canoas: Ulbra, 2007. p.15-21.
HERINGER, I.; JACQUES, A.V.A. Composição florística de uma pastagem natural submetida a queima e manejos alternativos.
Ciência Rural, v.32, p.315-321, 2002.
KNICKER, H.; ALMENDROS, G.; GONZÁLEZ-VILA, F.J.; GONZÁLEZ-PÉREZ, J.A.; POLVILLO, O. Characteristic alterations of quantity and quality of soil organic matter caused by forest fires in continental Mediterranean ecosystems: a solid-state 13C NMR study. European Journal of Soil Science, v.57, p.558-569, 2006.
PAUL, S.; VELDKAMP, E.; FLESSA, H. Soil organic carbon in density fractions of tropical soils under forest – pasture – secondary forest land use changes. European Journal of Soil Science, v.59, p.359-371, 2008.
POTES, M. da L.; DICK, D.P.; DALMOLIN, R.S.O.D.; KNICKER, H.; ROSA, A.S. da. Matéria orgânica em Neossolo de altitude: influência do manejo da pastagem na sua composição e teor. Revista Brasileira de Ciência do Solo, v.34, p.23-32, 2010.
ROSA, A.H.; OLIVEIRA, L.C. de; BELLIN, I.C.; ROCHA, J.C.; ROMÃO, L.P.C.; DIAS FILHO, N.L. Influence of alkaline extraction on the characteristics of humic substances in Brazilian soils. Thermochimica Acta, v.433, p.77-82, 2005.
SANTANA, G.S. Compartimentos químicos e físicos da matéria orgânica de Latossolo em sistemas de manejo de
pastagens dos Campos de Cima da Serra, RS. 2010. 68p.
Dissertação (Mestrado) – Universidade Federal do Rio Grande do Sul, Porto Alegre.
SANTÍN, C.; KNICKER, H.; FERNÁNDEZ, S.; MENÉNDEZ-DUARTE, R.; ÁLVAREZ, M.Á. Wildfires influence on soil organic matter in an Atlantic mountainous region (NW of Spain). CATENA, v.74, p.286-295, 2008.
SANTOS, H.G. dos; JACOMINE, P.K.T.; ANJOS, L.H.C. dos; OLIVEIRA, V.A. de; OLIVEIRA, J.B. de; COELHO, M.R.; LUMBRERAS, J.F.; CUNHA, T.J.F. (Ed.). Sistema brasileiro de
classificação de solos. 2.ed. Rio de Janeiro: Embrapa Solos, 2006. 306p.
SILVA, L.B. da; DICK, D.P.; INDA JUNIOR, A.V. Solos subtropicais de altitude: atributos químicos, teor de matéria orgânica e resistência à oxidação química. Ciência Rural, v.38, p.1167-1171, 2008.
STRECK, E.V.; KÄMPF, N.; DALMOLIN, R.S.D.; KLAMT, E.; NASCIMENTO, P.C.; SCHNEIDER, P.; GIASSON, E.; PINTO, L.F.S. Solos do Rio Grande do Sul. Porto Alegre: Emater: ASCAR, 2008. 222p.
TAN, K.H. Infrared spectroscopy. In: TAN, H.K. (Ed.). Soil
sampling, preparation and analysis. New York: Marcel Dekker,
1996. p.278-298.
TOMAZI, M. Estabilidade da matéria orgânica em Latossolos
do cerrado sob sistemas de uso e manejo. 2008. 108p. Tese
(Doutorado) – Universidade Federal do Rio Grande do Sul, Porto Alegre.
WIESMEIER, M.; DICK, D.P.; RUMPEL, C.; DALMOLIN, R.S.D.; HILSCHER, A.; KNICKER, H. Depletion of soil organic carbon and nitrogen under Pinus taeda plantations in Southern Brazilian grasslands (Campos). European Journal of Soil Science, v.60, p.347-359, 2009.