Abstract—DNA microarray data had been used to help the analysis of cancer and disease. Feature selection was an important dimensionality reduction technique in DNA microarray. The huge combinations of features made the selection methods difficult to search the significant features in DNA microarray. We proposed a complementary particle swarm optimization (CPSO) algorithm to overcome this challenge task. The best feature combinations can be selected according the estimation of the leave-one-out cross-validation (LOOCV) which used the K-Nearest Neighbor (KNN) classification to compute error rate. We used the six kinds of diseases to test CPSO and compare with other methods. The results showed that CPSO can effectively improve PSO search ability in feature selection problem, and was superior the several methods.
Index Terms—DNA microarray, Particle swarm optimization, K-Nearest Neighbor, Leave-one-out cross-validation.
I. INTRODUCTION
EATURE selection in the DNA microarray [1] had become an important research tool in biological experiment. DNA microarray could contribute the biological scholars to analyze the various disease types; it was widely used to identify the DNA types, cells, and cancer classification. However, DNA microarray data was usually huge and complexity. Therefore, the feature selection technique was applied to select the helpful DNA dimension.
In the dataset, the part of features is important to influence the study results, whereas the few features may not affect. Therefore, the features can be deleted to reduce the experimental cost and the result information is often not lost. The feature selection method can be divided into two types: filter algorithms and wrapper algorithms. Filter algorithms conducted the importance the feature retention, and combine the feature subset. The information gain and interactive information methods belong to the filter algorithms[2, 3]. Wrapper methods are the learning algorithm which is trying to continually delete or add features. In recent years, many feature selection algorithms have been developed such as branch and bound[4, 5], floating search method [6], and particle swarm optimization (PSO)[7, 8].
L.Y. Chuang is with the Department of Chemical Engineering, I-Shou University , 84001 , Kaohsiung, Taiwan (E-mail: [email protected]). H.F. Jhang is with the Department of Electronic Engineering, National Kaohsiung University of Applied Sciences, 80778, Kaohsiung, Taiwan (E-mail: [email protected]).
C.H. Yang is with the Department of Electronic Engineering, National Kaohsiung University of Applied Sciences, 80778, Kaohsiung Taiwan (phone: 886-7-3814526#5639; E-mail: [email protected]).
In this study, we used the feature selection to choose the subset from the dataset, and used the classification to estimate the subset. The complementary particle swarm optimization (CPSO) [9] is used to select feature. The K-nearest neighbor (K-NN) method is used to classify the features, and the leave-one-out cross-validation (LOOCV) is used to compute the classification error rate. In standard PSO, particles may get trapped in a local optimum due to the premature convergence of particles. Therefore, we used the complementary strategy to avoid the particles trapped in a local optimum by moving the new region in the search space. We use the six kinds of diseases to test CPSO and compare with other methods. The data contains Brain_Tumor1_ GEMS, Brain_Tumor2_GEMS, DLBCL_GEMS, Leukemia1_GEMS, Prostate_Tumor_GEMS, and SRBCT_GEMS. The results demonstrated that CPSO can effectively select features in the DNA microarray.
II. MATH A. Particle Swarm Optimization (PSO)
Kennedy and Eberhart developed Particle swarm optimization (PSO) algorithm which theory was simulated the social behavior of swarms [7, 8]. In PSO, a resolution was represented as a particle in problem, and the population was consists of the N particles. The ith particle of population was denoted as xi = (xi1, xi2, …, xiD), and its velocity was denoted
as Vi = (vi1, vi2, …, viD). The positions and velocities were
respectively limited within [Xmin, Xmax]D and [Vmin, Vmax]D.
Each particle has the own memory (i.e., experience) and common knowledge which gained by the swarm. The best experience of the ithparticle was denoted as pbestiand the
position was represented as pi = (pi1, pi2, …, piD). The
common knowledge was denoted as gbest, and the global best position was represented as g = (g1, g2, …, gD). The
position of particle can be updated according its pbestand gbest to find the good resolution, and the updating functions were shown in Eq. 1 and 2.
where c1 and c2 were learning factors, r1 and r2 were random
numbers between 0 to 1. Velocities and were the current velocity and next velocity, respectively. Position
and were the current position (solution) and the
Feature Selection using Complementary Particle
Swarm Optimization for DNA Microarray Data
Li-Yeh Chuang, Hua-Fang Jhang, Cheng-Hong Yang, Member, IAENG
F
Proceedings of the International MultiConference of Engineers and Computer Scientists 2013 Vol I, IMECS 2013, March 13 - 15, 2013, Hong Kong
ISBN: 978-988-19251-8-3
ISSN: 2078-0958 (Print); ISSN: 2078-0966 (Online)
updated particle position. We use the LDW[16] strategy to update the inertia weight w, and the function can be represented as Eq. 3.
The wmax and wmin were the value 0.9 and 0.4, respectively.
Iterationmax and Iterationi were the maximal number of
iterations and the current number of iterations, respectively. The function made the inertia weight w was linearly decreases from 0.9 to 0.4 though iteration [17]. PSO flowchart was shown in below:
B. Complementary Particle Swarm Optimization (CPSO) In this study, we used the complementary method to improve the linearly decreasing weight particle swarm optimization (LDWPSO) search ability, and the method called the complementary particle swarm optimization (CPSO). In the standard PSO, the particle could be trapped into a local optimum due to the premature convergence of particles. The complementary strategy aims to assist the particle search ability which helps the particle deviating in a local optimum by moving their position to a new region in the search space. We used the complementary function to generate the new particles, and replace the 50% of the particles in the swarm [15]. The complementary operation was shown in Figs. 2 and 3, and the complementary function was shown below:
select id Complement
id
x
x
x
x
(
max
min)
(4)In Eq. 4,
x
idselect denoted the randomly selected particles, Xmax and Xmin denoted the maximum and minimum value ofthe search space, respectively. The
x
idComplement denoted the transformed value. The CPSO pseudo-code is shown in the following.CPSO pseudo-code 01: begin
02: Randomly initialize particle swarm 03: while (the stopping criterion is not metting) 04: Adjust position of particle swarm
05: Evaluate fitness of particle swarm 06: for i = 1 to number of particle 07: Find pbesti
08: Find gbest
09: for d = 1 to number of dimension with particle 10: update the position of particles by Eqs.1-2 11: next d
12: next i
13: Update the inertia weight value by Eq.3 14: if fitness of gbest is the same ten times then 15: Randomly select 50% of the particles of swarm S 16: Generate new particles C via Eq.6 and replace S 17: end if
18: next generation until stopping criterion 19: end
C. K-Nearest Neighbor (K-NN)
The K-nearest neighbor (K-NN) method was proposed by Fix and Hodges in 1951 [14]. K-NN is the machine learning algorithm. Each data points can accord its own features in a D-dimensional space. K-NN classification effect the subject for the number of impact of these K neighbors. We used the Euclidean distance to compute all the testing data distance nearest the K know type data to decide the testing data type. In order to increase the classification accuracies, the parameter K has to be adjusted based on the different dataset characteristics.
In this study, the 1-nearest neighbor (1-NN) was used to classify the samples, and combined with the leave-one-out cross-validation (LOOCV) to compute classification error rates. LOOCV is a straightforward technique, and it provides an almost unbiased estimator. In the LOOCV procedure, N samples are dividing into a testing data and the N-1 training samples. Finally, a classifier constructed by training the N-1 training samples. The testing sample category can be judged by the classifier.
Proceedings of the International MultiConference of Engineers and Computer Scientists 2013 Vol I, IMECS 2013, March 13 - 15, 2013, Hong Kong
ISBN: 978-988-19251-8-3
ISSN: 2078-0958 (Print); ISSN: 2078-0966 (Online)
III. RESULTS AND DISCUSSION A. Data set
In this paper, we use the six kinds of diseases to test our method and compare with other method. In this study, the data contains Brain_Tumor1_GEMS, Brain_Tumor2_ GEMS, DLBCL_GEMS, Leukemia1_GEMS, Prostate_Tumor_GEMS, and SRBCT_GEMS. Table I shows the six data information.
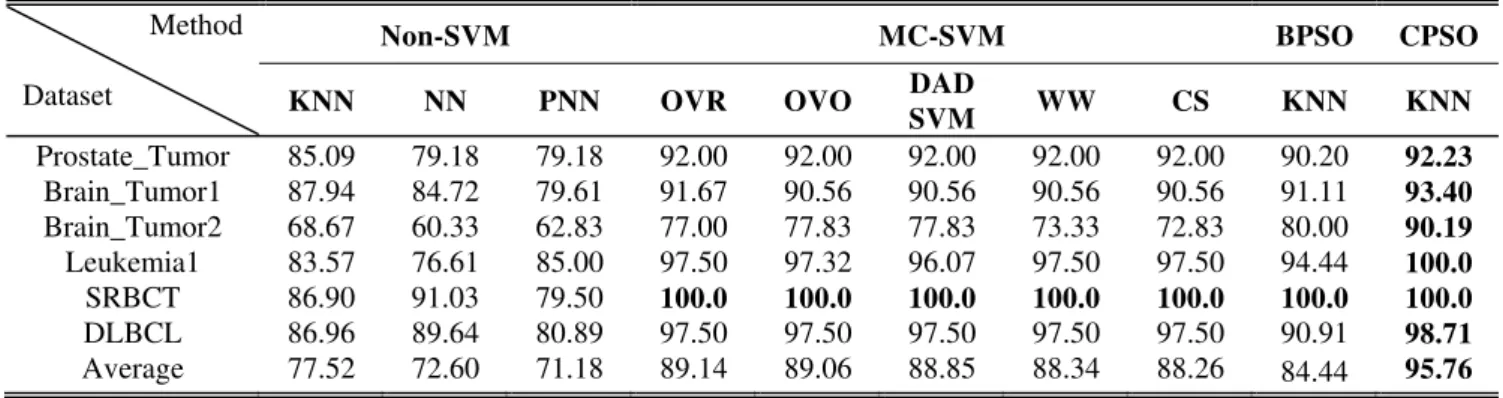
B. Results of feature selection by CPSO and other methods In order to evaluate the performance of the proposed method, we compare the four algorithms, Non-SVM, MC-SVM, BPSO and CPSO. The results in the Table II show the classification accuracy of the four algorithms. The CPSO gain the best accuracy in the six datasets when compare with the Non-SVM, MC-SVM, and BPSO.The below reason can explain why the CPSO outperformed BPSO in our experiment. In several generations, the classification accuracy results of PSO usually remains unchanged, indicating that PSO is stuck in a local optimum. On the other hand, CPSO still increases the classification accuracy, except for the SRBCT data set where it does not increase continuously in the later generations. However, CPSO incorporate the complementary process; therefore, it can effectively escape the local optimum.
In the pretreatment process, the feature selection can effectively reduce the calculation time without negatively affecting classification accuracy. Feature selection uses relatively fewer features since only selective features need to be used. This does not affect the classification accuracy in a negative way. Therefore, the DNA microarray data is implemented by feature selection, which can provide the meaningful diagnostic information for disease prediction.
Feature selection can be regarded as a combinatorial problem[18], which is being the NP-hard problem due to the feature dimensions of the problem are usually large. In this study, we used the CPSO to search the best feature subset to effectively differentiate classification results. However, the standard PSO algorithm has a disadvantage, which is easily trapped into a local optimum. When particles are moving, each particle is influenced by pbest and gbest. After several generations, if the position of gbest has not changed, many particle cluster around gbest instead of exploring the rest of the search space. In CPSO, the velocity is treated as the
probability of a bit change of the particle. Close proximity of a particle to gbest reduces the probability of this bit occurring.
As mentioned above, each particle congregates toward gbest after several generations. On the other hand, if the gbest is moved frequently, the particle will not cluster around a certain location. We used the complementary principle to avoid standard PSO trapping into a local optimum. However, if the position of gbest has to be changed, the new position has to be better than original one.In this study, we employed a simple complementary to create a new position for gbest. We perform an ‘and’ logic operation for all bits of all pbest values. pbest is the previously optimal position of each particle. In CPSO, if the position of pbest in each particle is recorded as {1}, then the new bit of a complementary will be {1} as well after the ‘and’ logic operation is performed, else it is {0}. After the logical operation, a new complementary will be created, and replace the original gbest. Therefore, all particles will be influenced by the new gbest and start to explore other areas. The complementary diagram is shown in Fig. 4.
The purpose of this study was to improve on standard PSO. Some classification algorithms, such as decision tree, K-nearest neighbor aim at all feature to evaluate the classification performance. Experiments show that K-NN often achieves higher classification accuracy than other classification method. In a future work, we will combine K-NN with CPSO to evaluate and compare their classification accuracy and performances.
IV. CONCLUSION
In this study, we proposed a complementary particle swarm optimization, K-NN and LOOCV methods for feature selection problem. Experimental results show that the features are effectively reduced by CPSO with feature selection. The classification error rate obtained by the CPSO method that is the lowest classification error rate when compare with other several methods in six DNA microarray datasets. However, the results on the DNA microarray dataset show that the complementary particle swarm optimization is superior to Non-SVM, MC-SVM, and BPSO in terms of diversity, convergence and computation cost.
REFERENCES
[1] Wang, Y., Tetko, I. V., Hall, M. A., Frank, E., Facius, A., Mayer, K. F. X., and Mewes, H. W., “Gene selection from microarray data for cancer classification--a machine learning approach,” Computational Biology and Chemistry, Vol. 29, pp. 37-46, 2005.
TABLEI DATA SET
Dataset samples classes Genes
Prostate_Tumor 103 3 10509
Brain_Tumor1 91 6 5920
Brain_Tumor2 51 5 10367
DLBCL 77 2 5469
Leukemia1 73 4 5327
SRBCT 84 5 2308
In this study, in the complementary particle swarm optimization parameter setting shown below: particle =50, number of iterations=100, combine 1-NN conduct testing dataset with the six kinds of classifies issue.
Proceedings of the International MultiConference of Engineers and Computer Scientists 2013 Vol I, IMECS 2013, March 13 - 15, 2013, Hong Kong
ISBN: 978-988-19251-8-3
ISSN: 2078-0958 (Print); ISSN: 2078-0966 (Online)
[2] Q. Li, J.H. Li, G.S. Liu, and S.H. Li, “A rough set-based hybrid feature selection method for topic-specific text filtering,” Machine Learning and Cybernetics, Proceedings of 2004 International Conference on,Vol.3, 2004, pp. 1464-1468.
[3] R. Battiti, “Using mutual information for selecting features in supervised neural net learning,” Neural Networks, IEEE Transactions on, Vol. 5, 1994, pp. 537-550.
[4] Narendra, P. M., and Fukunaga, K., “A Branch and Bound Algorithm for Feature Subset Selection,” Computers, IEEE Transactions on, Vol. 100, pp. 917-922, 1977.
[5] Somol, P., Pudil, P., and Kittler, J., “Fast branch & bound algorithms for optimal feature selection,” Pattern Analysis and Machine Intelligence, IEEE Transactions on, Vol. 26, pp. 900-912, 2004. [6] Pudil, P., Novovicova, J., and Kittler, J., “Floating search methods in
feature selection,” Pattern recognition letters, Vol. 15, pp. 1119-1125, 1994.
[7] Kennedy J, Eberhart R. Particle swarm optimization. Proceedings of the IEEE International Conference on Neural Network, Perth, Australia, 1995, pp. 1942-1948.
[8] Eberhart R, Kennedy J. A new optimizer using particle swarm theory. Proceedings of the Sixth International Symposium on Micro Machine and Human Science, Nagoya, Japan, 1995, pp. 39-43.
[9] Chuang L.Y., Tsai J.H., Yang C.H., Complementary Binary Particle Swarm Optimization for Operon Prediction. Proceeding of the
International MultiConference of Engineers and Computer Scientists, Vol. 1, Hong Kong, March 2010, pp. 200-205.
[10] Blackwell T. Particle swarms and population diversity. Soft Computing, 2005, 9, pp. 793–802.
[11] Naka S., Genji T., Yura T., Fukuyama Y: A hybrid particle swarm optimization for distribution state estimation, IEEE Transactions on Power Systems 18, 2003, pp.60-68.
[12] Shi Y. and Eberhart R.C: Empirical study of particle swarm optimization. Proceedings of Congress on Evolutionary Computation, Washington, DC, 2002, pp. 1945-1949.
[13] E. Fix and J. L. Hodges, “Discriminatory analysis, nonparametric discrimination,” U.S. Air Force School of Aviation Medicine, Randolph Field, Tex., Project 21-49-004, Rep. 4, Contract AF-41-(128)-31, Feb. 1951.
[14] Statnikov, A., Aliferis, C. F., Tsamardinos, I., Hardin, D., and Levy, S., “A comprehensive evaluation of multicategory classification methods for microarray gene expression cancer diagnosis,” Bioinformatics, Vol. 21, pp. 631-643, 2005.
[15] Y. Shi, RC. Ebrhart, " A modified particle swarm optimizer", IEEE international conference evolutionary computation; 1998. p. 69-73. [16] Shi Y. and Eberhart R.C: Empirical study of particle swarm
optimization. Proceedings of Congress on Evolutionary Computation, Washington, DC, 2002, pp. 1945-1949.
TABLEII
THE ACCURACY ON SIX MICROARRAY DATA SET Method
Dataset
Non-SVM MC-SVM BPSO CPSO
KNN NN PNN OVR OVO DAD
SVM WW CS KNN KNN
Prostate_Tumor 85.09 79.18 79.18 92.00 92.00 92.00 92.00 92.00 90.20 92.23
Brain_Tumor1 87.94 84.72 79.61 91.67 90.56 90.56 90.56 90.56 91.11 93.40
Brain_Tumor2 68.67 60.33 62.83 77.00 77.83 77.83 73.33 72.83 80.00 90.19
Leukemia1 83.57 76.61 85.00 97.50 97.32 96.07 97.50 97.50 94.44 100.0
SRBCT 86.90 91.03 79.50 100.0 100.0 100.0 100.0 100.0 100.0 100.0
DLBCL 86.96 89.64 80.89 97.50 97.50 97.50 97.50 97.50 90.91 98.71
Average 77.52 72.60 71.18 89.14 89.06 88.85 88.34 88.26 84.44 95.76
Bold face the optimal solutions
Proceedings of the International MultiConference of Engineers and Computer Scientists 2013 Vol I, IMECS 2013, March 13 - 15, 2013, Hong Kong
ISBN: 978-988-19251-8-3
ISSN: 2078-0958 (Print); ISSN: 2078-0966 (Online)