ContentslistsavailableatSciVerseScienceDirect
Journal
of
Neuroscience
Methods
j o ur na l h o me p a g e :w w w . e l s e v i e r . c o m / l o c a t e / j n e u m e t h
Computational
Neuroscience
Detecting
cell
assemblies
in
large
neuronal
populations
Vítor
Lopes-dos-Santos
∗,
Sidarta
Ribeiro,
Adriano
B.L.
Tort
BrainInstitute,FederalUniversityofRioGrandedoNorte,Brazila
r
t
i
c
l
e
i
n
f
o
Articlehistory: Received6January2013
Receivedinrevisedform11April2013 Accepted17April2013
Keywords: Cellassemblies
Principalcomponentanalysis Independentcomponentanalysis Assemblyvectors
a
b
s
t
r
a
c
t
Recentprogressinthetechnologyforsingleunitrecordingshasgiventheneuroscientificcommunitythe opportunitytorecordthespikingactivityoflargeneuronalpopulations.Atthesamepace,statisticaland mathematicaltoolsweredevelopedtodealwithhigh-dimensionaldatasetstypicalofsuchrecordings. Amajorlineofresearchinvestigatesthefunctionalroleofsubsetsofneuronswithsignificantco-firing behavior:theHebbiancellassemblies.Herewereviewthreelinearmethodsforthedetectionofcell assembliesinlargeneuronalpopulationsthatrelyonprincipalandindependentcomponentanalysis. Basedontheirperformanceinspiketrainsimulations,weproposeamodifiedframeworkthat incorpo-ratesmultiplefeaturesofthesepreviousmethods.Weapplythenewframeworktoactualsingleunit recordingsandshowtheexistenceofcellassembliesintherathippocampus,whichtypicallyoscillateat thetafrequenciesandcoupletodifferentphasesoftheunderlyingfieldrhythm.
© 2013 Elsevier B.V. All rights reserved.
Contents
1. Introduction... 00
2. Reviewofthemethods ... 00
2.1. Constructionofthespikematrix... 00
2.2. Determinationofthenumberofcellassemblies... 00
2.3. Extractionofcellassemblypatternsandestimationofcellassemblyactivity... 00
2.3.1. Principalcomponentanalysis... 00
2.3.2. Assemblyvectorestimation... 00
2.3.3. Independentcomponentanalysis... 00
2.3.4. Otherexamples... 00
3. Realdataapplications... 00
4. Discussion... 00
4.1. Limitations ... 00
5. Conclusion... 00
Acknowledgements... 00
AppendixA. Supplementarydata ... 00
References... 00
1. Introduction
Amainconcerninsystemsneuroscienceistounderstandhow singleneuronsformfunctionalneuronalcircuits ultimately giv-ingrisetocomplexinformation processingandbehavior. Much ofthecurrentknowledgehasbeenderivedfromtheanalysisof
∗Correspondingauthorat:BrainInstitute,FederalUniversityofRioGrandedo
Norte,RuaNascimentodeCastro,2155–LagoaNova,Natal,RN59056-450,Brazil. Tel.:+558432152709.
E-mailaddress:[email protected](V.Lopes-dos-Santos).
thefiringrateofsingleunits(AdrianandZotterman,1926;Hubel
andWiesel,1959;OkeefeandDostrovs,1971;Perrettetal.,1982),
pairwisecorrelations(WilsonandMcNaughton,1994),and syn-chronybetweensinglecellsandlocalfieldpotentials(Siapasetal., 2005).Recenttechnologicaladvanceshaveopenedthepossibility ofrecordinglargepopulationsofneuronssimultaneously(Buzsaki, 2004).Theserecordingscreatedanewdemandformathematical andstatisticaltoolstoanalyzetheactivityofneuronalensembles as a whole, insteadof each unit at a time. New methods with differentstrategieshavebeenemployed,suchastemplate
match-ing(LeeandWilson,2002;LouieandWilson,2001;Ribeiroetal.,
2004),principalcomponentanalysis(ChapinandNicolelis,1999;
Lopes-dos-Santosetal.,2011;Peyracheetal.,2010),independent componentanalysis(Laubachetal.,1999),shufflingmethodsfor detectingrepeatedfiringsequences(AbelesandGat,2001;Abeles
andGerstein,1988;Bergeretal.,2010;GanselandSinger,2012),
andmethodsbasedoninformationtheory(Arabzadehetal.,2004;
QuirogaandPanzeri,2009),amongothers.
Inthis reviewwefocusonlinearmethodsfor detectingand trackingtheactivityof cellassemblies embeddedinlarge neu-ronalpopulations.Here we definecellassemblies assubsets of neuronswithsignificantco-activationbehavior, asproposedby
Hebb(1949).Wecomparethree methodsthatrelyonprincipal
componentanalysis(PCA).Basedontheirefficiencyinsimulated neuronalnetworks,weproposeamodifiedframeworkthat incor-poratesmultiplefeaturesofthesemethods.Weaimedtoprovidean intuitiveviewofthemethodsandtheirpossibleapplications. Rigor-ousmathematicalderivationscanbefoundinthereferencescited alongthetext.MATLABcodesandatutorialforrunningthe meth-odscanbeobtainedfromthecorrespondingauthoruponrequest.
2. Reviewofthemethods
Thegeneralprocedurecanbestructuredinthreemainsteps: (1)Constructionofthespikematrix,wherespiketrainsarebinned andnormalized;(2)Determinationofthenumberofcell assem-blies,whereanullhypothesisdistributionforcellassemblyactivity is generated; and (3) Extraction of cell assembly patterns and estimationofcellassemblyactivity,whereco-activationpatterns arefoundand usedtotracktheactivityofcellassemblieswith single-binresolution.Step1isstandardforallmethodsreviewed here,whilesteps2and 3maydiffer.Regardingstep2,herewe comparesurrogatemethodswithananalyticalthresholdrecently introducedinPeyracheetal.(2009),and,regardingstep3,we com-parepreviouslypublishedmethods(ChapinandNicolelis,1999;
Laubachetal.,1999;Lopes-dos-Santosetal.,2011;Peyracheetal.,
2010)andsuggestimprovements.
2.1. Constructionofthespikematrix
Allmethodsstudiedhereusematrixrepresentationsofspike trains.Inthissectionweshowhowtoconstructthespikematrix.
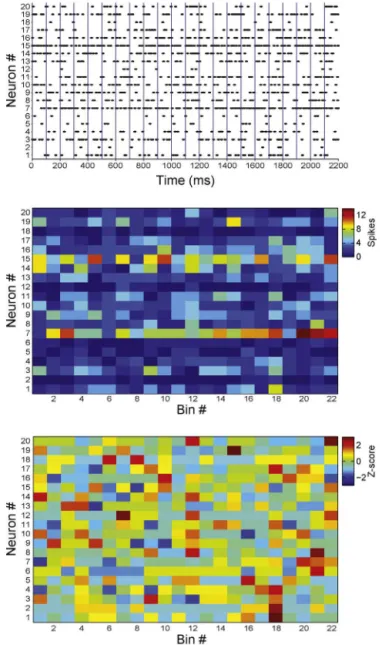
ToppanelofFig.1showstheactivityof20simulatedneurons bymeansofaspikerasterplot,inwhicheachblackmarkdenotes anactionpotentialofagivenneuron(verticalaxis)inagiventime (horizontalaxis).Thespikematrixisconstructedbybinningthe rasterplotandcountingthenumberofspikeselicitedbyeach neu-ronwithineachbin(Fig.1middle);Atthispointeachmatrixentry denotesthenumberofspikesofagivenneuron(rows)inagiven timebin(columns).Inthisexampleweemployabinsizeof100 mil-liseconds.Next,thespikecountofeachneuron(i.e.,eachrowofthe matrix)isnormalizedbyz-scoretransformation(Fig.1bottom):
zib=
sib−si
si
wherezibisthez-scoredspikecountofneuroniintimebinb,sib isthenumberofspikesofneuroniinbinb,Siisthemeanspike countofneuronioveralltimebins,andSiisthestandarddeviation
ofthespikecountsofneuronioverbins.Thus,inthez-scoredspike matrixeachneuronissettohavenullmeanandunitaryvariance.
2.2. Determinationofthenumberofcellassemblies
Beforeextractingassemblypatternsitisimportanttoknowhow manycellassembliesaretheretobefound.Peyracheetal.(2010,
2009)introducedtheuseofeigenvalueanalysisfordetermining
thestatisticalsignificanceofassemblypatterns.Weprovidesome toyexamplesbelowtoillustratethisprocedure.
Fig.1.Pre-processingofspikingactivitydata.Toppanel:spikerasterplotof20 simulatedneurons.Dotsrepresentspiketimesandbluelinesdenotetheboundaries of100-mstimebins.Middlepanel:Non-normalizedspikematrix.Eachelementof thematrixisthenumberofspikesofagivenneuron(row)withinagiventime bin(columns).Bottompanel:Normalizedspikematrix.Thespikingactivityofeach neuronisz-scored.(Forinterpretationofthereferencestocolorinthisfigurelegend, thereaderisreferredtothewebversionofthearticle.)
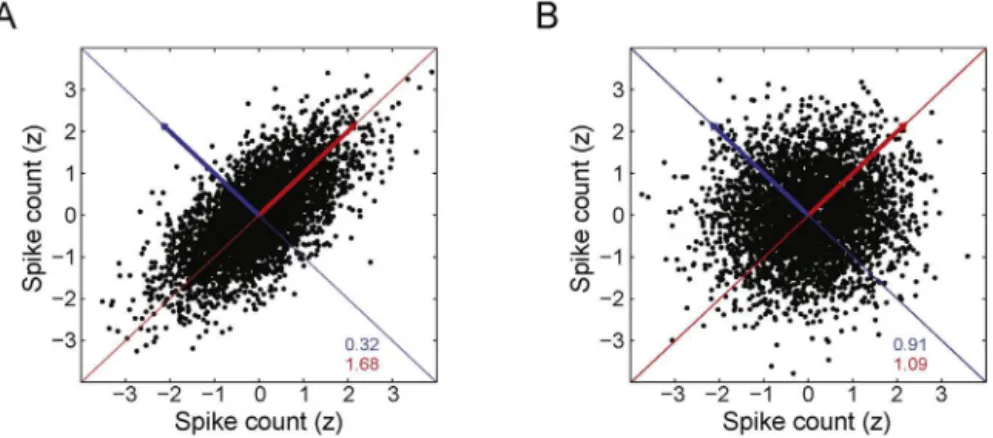
Fig.2showstwoscatterplotsinwhicheachpointrepresentsthe normalizedspikecountofapairofneuronsatthesametimebin. ThespikingactivityoftheneuronpairdisplayedinFig.2Ais cor-related,whiletheactivityofthepairinFig.2Bisnotcorrelated. Noticethatthevarianceofthedataconcentratesinagiven direc-tionwhenvariablesarecorrelated(Fig.2A),whilethevarianceis homogeneouslydistributedacrossalldirectionswhenvariablesare notcorrelated(Fig.2B).
Fig.2.Principalcomponentsandspikecountcorrelations.(A,B)Panelsshowscatterplotsofthespikingactivityoftwoneurons.Eachpointdenotesthez-scoredspiking activityofapairofsimulatedneurons(100-mstimebinswereused;eachneuronisrepresentedbyanaxis).Redandbluearrowsdenotefirstandsecondprincipalcomponents, respectively.Colorednumbersinformthevarianceofthedataintheaxesspannedbytheprincipalcomponents(coloredlines;samecolorconvention).PanelAshowsa correlatedpairofneuronsandpanelBshowsanuncorrelatedpair.(Forinterpretationofthereferencestocolorinthisfigurelegend,thereaderisreferredtothewebversion ofthearticle.)
andunitaryvariance,inourcasethecovariancematrixisequalto thecorrelationmatrix,andcanbecalculatedas:
C= ZZ
T
Ncolumns
whereZisthe(z-scored)spikematrix,Tthetransposeoperator, andNcolumnsisthenumberoftimebinsofZ.Thus,theelementat thei-thcolumnandj-throwofCisthelinearcorrelationbetween neuronsiandj.SinceCisnecessarilyrealandsymmetric,itfollows fromthespectraltheoremthatitcanbedecomposedas:
C=
ixixiTwherexiisthei-theigenvectorofC(thatis,thei-thPCofZ)andi itscorrespondingeigenvalue.Moreover,theouterproductxixiTis
theprojectionmatrixontothedirectionofxi,andiisthevariance ofthedataalongthesameaxis.
InFig.2theredandbluelinesrepresentthefirstandsecond PCs,respectively,andtheireigenvalues(i.e.,variances)areshown withsamecolorlabels.Asmentionedabove,whenspiketrainsare uncorrelated,asinFig.2B,thevarianceofthedataprojectedonto anydirectionisroughlythesame.Infact,theywouldbeexactly equalifinfinitesampleswereanalyzed.Randomfluctuationsdue toundersamplingproduceadirectionwithslightlylargervariance thatisdetectedasthefirstPC.In thecaseofcorrelatedactivity (Fig.2A),thevariance issignificantly moreconcentrated inthe directionof thefirstPC. These observationscan begeneralized forhigherdimensionalsignals:datavariancewillbesignificantly largerina givendirectionifthereisa linearlycorrelatedgroup ofcells.Followingthisreasoning,apossiblestrategytoestimate thenumberofcellassemblies(subsetsofneuronswithcorrelated activity)istofindthenumberofPCsofthespikematrixwith sig-nificantlylargeeigenvalues.
Peyrache et al. (2009, 2010) proposed the use of the
Marˇcenko–Pasturdistributionasanullhypothesisforthe exist-enceofcellassemblies.MarˇcenkoandPastur(1967)demonstrated thattheeigenvaluesofthecorrelationmatrixofanormalrandom matrixMwithstatisticallyindependentrowsfollowaprobability functiondescribedby:
p()= q
22
(max−)(−min)
,
withq=Ncolumns/Nrows≥1,where2isthevarianceoftheelements ofM(inourcase2=1duetoz-scorenormalization),N
columnsis thenumberofcolumnsandNrowsthenumberofrows.maxand
min arethemaximumandminimumbounds,respectively,and arecalculatedas:
maxmin =2(1±
1/q)2Thisprobabilityfunctionhasfinitesupportgivenbytheinterval
min≥≥max.Thus,iftherowsofMarestatisticallyindependent, theprobabilityoffindinganeigenvalueoutside theseboundsis zero.Inotherwords,thevarianceofthedatainanyaxiscannotbe largerthanmaxwhenneuronsareuncorrelated.Therefore,max canbeusedasastatisticalthresholdfordetectingcellassembly activity(Peyracheetal.,2010).Thatis,thenumberofeigenvalues abovemaxcanbeusedtoestimatethenumberofcellassemblies inthespikematrix.
Althoughthistheoreticalboundwasderivedforlargematrices, itisalsoarobustthresholdforsmallermatrices(Lopes-dos-Santos
etal.,2011;Plerouetal.,2002).Nevertheless,Peyracheetal.(2010)
proposedtheuseofafinitesamplebiascorrectionbasedonthe Tracy–Widomdistribution(TracyandWidom,1994).Inaddition, itshouldbenotedthatalthoughtheMarˇcenko–Pasturdistribution wasprovedforrandommatriceswhoseentriesarederivedfrom Gaussiandistributions,empiricalsimulationsshowthatthis dis-tributionalsoprovidesagoodboundforeigenvaluesofmatrices composedbyindependentrows(inourcase,uncorrelatedneurons) originatedfromotherrandomprocesses(Birolietal.,2007;
Lopes-dos-Santosetal.,2011;Seba,2003).Moreover,weneverobserved
“falsepositive”eigenvaluesinsimulationsemployingPoisson neu-rons,i.e.,thenumberofeigenvaluessignificantlylargerthanchance wasalwaysequaltoorlessthantherealnumberofassemblies.
An alternative to the use of the Marˇcenko–Pastur distribu-tionistodefineastatistical thresholdbasedonsurrogatedata. Thisprocedure entailsthe shuffling of time binsfor each neu-ronindependently in order todestroy their temporal relations whilemaintainingthedistributionofspikecountsunchanged.The eigenvaluesofcorrelationmatricesobtainedfromshuffledspike matricescanbeusedtoconstructanulldistribution;forexample, theeigenvaluesoftheoriginalspikematrixthatarelargerthan a certainpercentile(e.g.,95%or99%) ofthedistributionofthe maximaleigenvaluescomputedfromshuffleddataareregardedas significant(thatis,inthisframeworkeachsurrogatematrix con-tributesitsmaximaleigenvaluetothechancedistribution,whichis amoreconservativeapproachthanconsideringallsurrogate eigen-values).
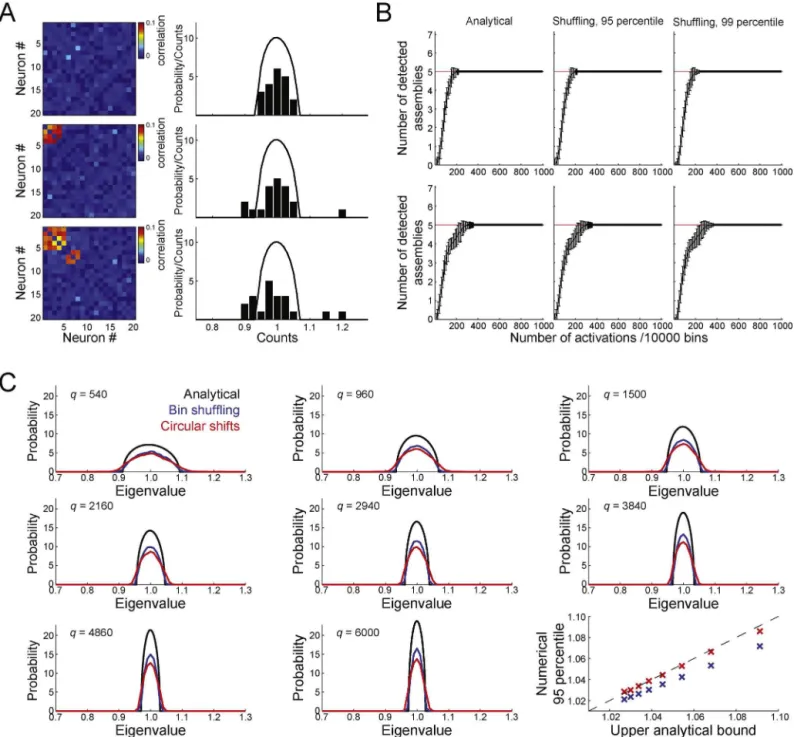
Inordertocomparetheanalyticalandshufflingmethods,we simulatedspikematriceswith32neuronsand10,000bins.Neurons weremodeledasPoissonprocesseswithunitarymean. Addition-ally,binsofeachneuronwererandomlychosenasactivationbins, inwhichthespikecountwasderivedfromauniformrandom dis-tributionfrom0to6spikes,thuslikelyabovetheoverallmean.In ordertosimulateassemblies,wesetfivesubsetsofneurons(i.e., fivecellassemblies)tohavecoincidentactivationbins(assembly activations).Note thatalthoughassembly membersincrease fir-ingtogether,eachassemblyactivationisuniquesincethefiringof assemblymembersisstochastic.ThetoppanelsofFig.3Bdisplay resultsforspikematriceswiththefollowingassembly composi-tion:assembly1neurons:#1,#2,#3,#4;assembly2:#5,#6,#7, #8;assembly3:#9,#10,#11,#12;assembly4:#13,#14,#15, #16;assembly5:#17#18,#19,#20.Linesrepresentthemeanover 150simulationsandbarsindicatestandarddeviation.Thisexample showsthattheanalyticalandtheshufflingmethodsconvergetothe correctnumberofassembliesafteracertainnumberofactivations haveoccurred.ThebottompanelsofFig.3Bshowsimilarresultsbut forasetofassembliesinwhicheachassemblysharesneuronswith atleasttwootherassemblies(assembly1neurons:#1,#2,#3,#4, #5;assembly2:#5,#6,#7,#8,#9;assembly3:#9,#10,#11,#12, #13;assembly4:#12,#13,#14,#15;assembly5:#15,#16,#17, #1).Theanalyticalandtheshufflingmethodsalsoconvergetothe correctnumberofassembliesinthiscase,althoughmore assem-blyactivationsarenecessarythaninthecaseofnon-overlapping assemblies.
Next,wecompareanalyticalandnumericaldistributionsof ran-domeigenvaluesfordatawithamorerealisticstructure.Insteadof usingPoissonneurons,wecreated20neuronsbasedonthespike trainsofaneuronrecordedfromtherathippocampus.Spikeswere binnedinto10-mswindows(120,000bins,or20min,intotal)and newspiketrainswerecreatedbytwosurrogatemethods.Thefirst ofthemisthesamebinshufflingmethodusedforFig.3B.The sec-ondisachievedbymeansofacircularrandomshift.Thatis,for eachneuronatimepointisrandomlychosenandusedtodividethe spiketrainintwonon-overlappigsegmentswhichswitchposition. Thismethodcreatessurrogateneuronswithsamerateand vari-anceoftheoriginalneuron,andvirtuallythesameautocorrelation andinter-spike-interval(ISI)distribution.
Weestimatedthedistributionofeigenvaluesforindependent activityby computingthe averageeigenvalue histogram across 1000simulationsforeachsurrogatemethod.Sincethedistribution isaffectedbytheratioq=Ncolumns/Nrows,werepeatedthe proce-dureformatriceswithdifferentnumberofbins (Ncolumns) while keepingthenumberofneuronsfixed.Fig.3Cdisplaysthe eigen-valuedistributionestimatedbyeachsurrogatemethodalongwith theMarˇcenko–Pasturdistributionforeachq.Finally,wecompare the95percentiledrawnfromthenumericaldistributionswiththe upperboundoftheanalyticaldistributioninthebottomrightpanel ofFig.3C.Surprisingly,the95percentileofthecircularshiftmethod matchesverycloselytheupperboundoftheanalyticaldistribution.
The95percentileofthebinshufflingprocedurewaslowerthan theupperanalyticalboundforallvaluesofqstudied.Altogether, theresultsindicatethatthetheoreticalboundderivedfromthe Marˇcenko–Pasturdistributioniswellsuitedfortrackingthe num-berofcellassemblies,sincesurrogatemethodsgivesimilarresults butarecomputationallydemanding.Moredetailedparametrical studiesontheMarˇcenko–Pasturdistributioncanbefoundin
Lopes-dos-Santosetal.(2011).Itisneverthelessadvisabletocomparethe
analyticalandshufflingmethodswhenworkingwithactualspike recordings,sincethespecificstatisticalpropertiesofagivendataset maybedifferentfromthesimulatedexamplesemployedhere.In thisregard,avaluablefeatureofthesurrogatemethodisthat sur-rogatespikematricescanbegeneratedinsuchawaythatneurons preservetheirISIdistributionandautocorrelation,thuspreserving morestatisticalpropertiesoftheoriginaldata.
2.3. Extractionofcellassemblypatternsandestimationofcell assemblyactivity
Inlinearmodels,theactivityofacellassemblyisassumedto bealinearcombination(aweightedsum)ofthespikeactivityof allneurons.Thus,eachco-activationpattern(alsocalledassembly pattern)isavectorthatattributesweightstoeachneuron.Foreach pattern,cellassemblyneuronscanbeidentifiedasthosewiththe largestweights.
Inmathematicalterms,theactivityofacellassemblyinagiven timebinbcanbedefinedas:
Rb=
i=Nneurons
wizib=wTZb,
where Nneurons isthenumber ofneurons,zib isthe z-scored activityofneuroniatthetimebinb,wiistheweightofthe
corre-spondingneuronintheassembly,wisacolumnvectorcontaining theweightsofallneuronsintheassemblyandZbistheb-thcolumn ofthespikematrixZ.
Thissectiondealswiththeproblemoffindingco-activation pat-ternswforeachcellassembly.Westudythreedifferentmethodsfor obtainingw,whicharebasedonPCA(ChapinandNicolelis,1999;
Peyracheet al.,2010), assembly vectors(AV)(Lopes-dos-Santos
etal.,2011),andindependentcomponentanalysis(ICA)(Laubach
etal.,1999).
2.3.1. Principalcomponentanalysis
Nicoleliset al.(1995)employedPCAtostudytheactivityof
thalamo-corticalassembliesduringtheoccurrenceofmurhythm inrats,usingthePCsthemselvesasco-activationpatternstotrack ensembleactivity(ChapinandNicolelis,1999).Later,Peyracheetal.
(2010) introduceda template-matchprotocol by which
assem-blypatternsidentifiedduringlearningepochsareusedtoassess assembly activityduringpre- and post-learningsleep episodes. Employingthisframework, theyshowedthatsubsets ofmedial prefrontal.Cortexneuronsthatwereco-activeduringrewarded runsinaT-masktaskalsoco-activatedduringsubsequent slow-wavesleep,mainlyduringhippocampalrippleevents(Peyrache etal.,2009).Morerecently,Benchenaneetal.(2010)usedthePCA approachtoshowthattheco-firingofassemblyneuronsoccursat apreferredphaseofthethetarhythm.
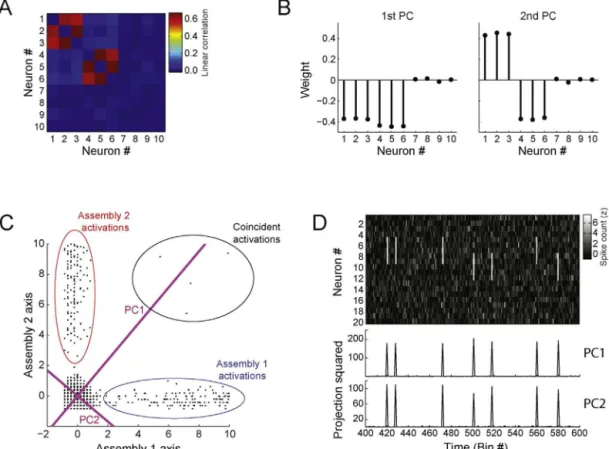
Fig.4.Detectingcellassembliesandtrackingtheiractivityusingprincipalcomponentanalysis.(A)Leftpanel:Non-normalizedspikematrixcomposedby20simulated neurons(totalsimulationtime:8000bins).EachneuronwasmodeledasaPoissonprocesswithmeanrateof1spike/bin.Additionally,250activationbins(around3%ofthe totalnumberofbins)wererandomlychosenforeachneuron:inthesebins,thespikecountwasderivedfromauniformdistributionbetween0and6spikes.Inorderto simulateassemblies,subsetsofneuronsweresettohavecoincidentactivationbins.Inthisexample,twoassembliesarepresent:assembly1(neurons#14,#15,#16,#17) andassembly2(neurons#18,#19and#20).Rightpanel:Correlationmatrix.(B)Principalcomponentsandeigenvalues.Toppanelshowstheeigenvaluesofthecorrelation matrixshowninA.Reddashedlinedenotestheanalyticalsignificancethreshold.Twoeigenvaluesaresignificantinthiscase.Bottompanelshowsprincipalcomponents associatedwiththeeigenvaluesshownabove.(C)Toppanelsdisplaytheprincipalcomponentsassociatedwiththeeigenvaluessignificantlyabovechance.Lowerpanels showthecorrespondingouterproductsofeachprincipalcomponent,whichareprojectorsofthespikematrixusedforcomputingcellassemblyactivitywithsingle-bin resolution.(D)ToppanelshowsarepresentativetimeintervalofthesamespikematrixasinAafterz-scorenormalization.Lowerpanelshowstheactivityofthedetected assembliesestimatedbytheprincipalcomponentsshowninC.Notethatthepeaksofassemblyactivitycorrespondtoco-activationsofthecorrespondingassemblymembers. (Forinterpretationofthereferencestocolorinthisfigurelegend,thereaderisreferredtothewebversionofthearticle.)
wasuniformlydistributedbetween0and6spikes.Twoassemblies wereprogrammed:assembly1,composedbyneurons#14,#15, #16,#17; andassembly2, composedbyneurons#18,#19and #20.Fig.4BdisplaysthePCsalongwiththeirassociated eigen-values.Thereddashedlinerepresentsthesignificancethreshold providedby theMarˇcenko–Pasturdistribution.Inthis example,
Fig.5. Examplesoflimitationsofassemblypatternestimationbyprincipalcomponents.(A)Correlationmatrixofasimulatedspikematrixwith8000binsand10neurons. Twoassemblieswereprogrammedwiththefollowingcomposition:assembly1,neurons#1,#2,#3;assembly2,neurons#4,#5,#6.Neuronsandassembliesweresimulated asinFig.4.Eachassemblywasactivefor200bins,wherethespikecountofassemblymembersassumedauniformdistributionfrom0to30.(B)Significantprincipal componentsofthecorrelationmatrixshowninA.(C)Projectionofthecolumnsofthespikematrixontothesubspacespannedbytheidealassemblypatterns.Idealassembly patternshavesameweightsforassemblymembersandnullweightsforotherneurons.Pointsrepresentingactivationsofassembly1and2arecircumscribedbyblueand redellipses,respectively.Binsinwhichbothassemblieswereactivearecircumscribedbyablackellipse.Axesspannedbytheprincipalcomponentsarerepresentedby magentalines.(D)Toppanel:Atimeintervalofasimulatedspikematrixwith20neuronsshowingactivationsoftwoassemblieswithoverlappingmembership(assembly 1,neurons#6,#7,#8,#9;assembly2,neurons#8,#9,#10,#11).Bottompanels:assemblyactivitiesestimatedwhenprincipalcomponentsareusedtodefineassembly patterns.AdaptedfromLopes-dos-Santosetal.(2011).(Forinterpretationofthereferencestocolorinthisfigurelegend,thereaderisreferredtothewebversionofthe article.)
Thenextstepistousetheassemblypatternstocomputethe timecourseofeachcellassemblyactivitywithsingle-bin resolu-tion.Theactivityofeachassemblycanbeestimatedbyprojecting thecolumnsofthespikematrixontotheaxisspannedbythe cor-respondingassemblypattern(inthiscase,assumedtobethePCs). TheprojectionofacolumnZbontoanaxiscanbecalculatedas:
proj=PZb,
wheretheprojectionmatrixPisdefinedas:
P=w⊗w=wwT,
where⊗istheouterproductoperatorandwisaunitaryvector thatspanstheaxis.Thevectorwistheassemblypattern.Ateach timebin,thelengthoftheprojectionisameasureofthesimilarity betweentheactivityofthewholepopulationandtheassembly pat-tern.Thislengthiscalculatedbytakingtheinnerproductbetween theassemblypatternwandZb(i.e.,aweightedsumofthe normal-izedspikecounts).Alternatively,thestrengthoftheprojectionwas definedbyPeyracheetal.(2010)asthesquareoftheprojection length,whichcanbecalculatedas:
Rb=ZbTPZb,
wherePis theouterproductoftheassemblypattern.Hereafter wewilladoptthisdefinitionofassemblyactivity.Theprojection matricesfortheassemblypatternsinthelastexampleareshown inFig.4C bottompanels. Ofnote,sincewe areconcernedwith
co-activationpatterns,themaindiagonalofPissettozero,which assuresthatisolatedactivationsofassemblymembersdonot con-tributetoR(Lopes-dos-Santosetal.,2011;Peyracheetal.,2010).
Fig.4DshowsatimeintervalofthespikematrixZalongwiththe estimatedtimecourseoftheactivityofthetwocellassemblies. Notethatthepeaksoftheblacktime-coursearecoincidentwith theco-activationofneuronscomposingassembly2,whilethered time-coursepeakswiththeactivationsofassembly1.
AlthoughtheoriginalPCAmethodcanbeefficientforextracting assemblypatterns(Benchenaneetal.,2010;ChapinandNicolelis,
1999;Nicolelisetal.,1995;Peyracheetal.,2009,2010),this
idealassemblypatternsshouldhavelargeweights(withthesame sign)onlyforthemembersofthecorrespondingassembly.Fig.5C showstheprojectionofthedataontothespacespannedbythe idealassemblypatterns(alargevalueinagivenaxismeansthatthe correspondingassemblywasactiveatthattimebin).Theaxesof thesignificantPCsaredisplayedasmagentalines.Notethatlength oftheprojectionsontotheaxisdefinedbythefirstPCaresimilar forbothassemblies;therefore,inthisexampletheactivitytime courseestimatedbytheouterproductofthefirstPCpeakswhen eitherassembly1or2isactive(notshown).
Thisproblemgetsmorecriticalwhenassembliesshareneurons
(Lopes-dos-Santosetal.,2011).Asharedneuronshouldideallyhave
largeweightinbothassemblypatterns;however,thiscannotbe representedbyPCssincePCsareorthogonalbydefinition.Inorder toillustratethisissue,aspikematrixwassimulatedwith20 neu-ronsmodeledasPoissonprocesseswithunitarymeanfor8000time bins.Foreachassembly,40binswererandomlychosenas assem-blyactivations,inwhichassemblymemberselicited6spikes.Two assemblieswereincluded:assembly1composedbyneurons#6, #7,#8and#9,andassembly2composedbyneurons#8,#9,#10, #11and #12.Fig.5Dshows atimeinterval ofthespikematrix alongwithassemblyactivitiescomputedfromtheouterproductof thesignificantPCs.Noticethatbothtimecoursespeakwhenever assembly1or2isactive.
Inanattempttoovercometheselimitations,Lopes-dos-Santos
etal.(2011)haveproposedamethodthatsearchesforclusters
ofneuronsinthesubspacespannedbythePCs.Wereview this frameworkinthefollowingsection.
2.3.2. Assemblyvectorestimation
ThePCweights(loadings)carryinformationaboutcellassembly membership,inthesensethatlargeweightedneuronsarepartof anassemblywhileneuronswithnearzeroweightsarenot. How-ever,howlargeshouldtheweightofaneuronbeinordertomakeit partofanassembly?Theassemblyvector(AV)estimationmethod wasdevelopedtoidentifythemembershipofcellassembliesin additiontoextractingassemblypatterns(Lopes-dos-Santosetal., 2011).TheframeworkissummarizedinFig.6.Aspikematrix com-posedof32neuronswassimulatedasintheexampleofFig.4.Two assemblieswereprogrammed:assembly1withneurons#27,#28, #29,#30;andassembly2withneurons#29,#30,#31,#32.Fig.6A showsthecorrelationmatrix(leftpanel)alongwithitseigenvalues distribution(rightpanel).Asinthepreviousmethod,thenumber ofcellassembliesisdeterminedbymeansoftheMarˇcenko–Pastur distribution.
NotethatevenwhenthePCsmixassemblypatterns,the thresh-old derived from the Marˇcenko–Pastur distribution still holds
(Lopes-dos-Santosetal.,2011).Thishappensbecauseactivations
ofdifferentassembliescannotlieinthesameaxis(otherwisethey wouldbeasingleassembly),andthereforevarianceincreasesinthe samenumberofaxesasthenumberofassemblies.Moreover,note thatwhentwoneuronsarecorrelated,thevarianceconcentrates inagivenaxis(theassemblyaxis)anddecreasesintheorthogonal axis(Fig.2A),whichleadstooneeigenvaluesignificantlyabove chancedistributionandanothersignificantlybelow.Thiscanbe generalizedfor groupsofneurons: forexample,iffourneurons participateinoneassembly,thevariancewillincreaseinoneaxis anddecreaseinotherthree.Followingthisreasoning,
Lopes-dos-Santosetal.(2011)haveshownnumericallythatthenumberof
eigenvaluesoutsidethetheoreticaldistributioncanbeusedto esti-matethenumberofassemblyneurons.Thus,intheAVframework thenumberofneuronscomposingatleastoneassemblyis esti-matedbycountingthetotalnumber ofeigenvaluesoutsidethe Marˇcenko–Pasturdistribution,i.e.,aboveorbelowthetheoretical bounds(Lopes-dos-Santosetal.,2011).Theseboundsareindicated intherightpanelofFig.6Abydashedredlines.Inthisexample,
sixeigenvalueslieoutsidethedistribution(2aboveand4below), whichmatchesthenumberofneuronsparticipatingincell assem-blies.
Inordertoidentifycellassemblyneurons,thecolumnsofthe correlationmatrixareprojectedontothesubspacespannedbythe PCsassociatedwithsignificantlylargeeigenvalues(i.e.,abovethe upperlimitoftheMarˇcenko–Pasturdistribution):
Ni=PASCi,
whereCiisthei-thcolumnofthecorrelationmatrixandPASisthe projectionmatrixoftheassemblyspace,definedas:
PAS=
i
PciPciT=PcPcT,
wherePciisthei-thsignificantPCandPcisamatrixcontainingall significantPCs(columns).
In this framework, this subspace is called Assembly Space (Fig.6B),andthecolumnsofthecorrelationmatrixprojectedonto thissubspace(Ni)arecalledneuronvectors.
Sincesixeigenvalueslieoutsidethetheoreticaldistribution,the sixneuronswithlargestneuronvectorsareregardedassignificant neurons.Notethatneuronsthathavesimilarcorrelationpatterns willhaveneuronvectorsclusteredtogetherintheAssemblySpace. On theotherhand,ifneurons haveorthogonalcorrelation pat-ternstheirneuronvectorswilltendtobeseparatedinthisspace. Followingthisreasoning,theinnerproductsbetweenallneuron vectorsandthoseofthesignificantneuronsisameasureof simi-laritybetweentheirco-activationpatterns.Thematrixcontaining theseinnerproductsiscalledInteractionMatrix(Fig.6C),whichcan beformallydefinedas:
Mi,j=NiTNj,
whereMi,jisitselementatrowiandcolumnj,Niistheneuron vectorofneuroniandNjistheneuronvectorofsignificantneuron j.
Inprinciplethesamecouldbedonebythedirectuseofthe columnsof thecorrelationmatrix.However, itis reasonableto assumethatassemblypatternscanbedescribedbyalinear combi-nationofthesignificantPCs(asinFig5B,C).Thus,PCsareusedto filterthedataandtheinnerproductsaretakeninsidetheAssembly Space.
Ideally,thedistributionofinnerproductsisbimodal,andthere isathresholdthatseparateslargeandlowvalues(Fig6D,left)and canbeusedtodigitalizetheinteractionmatrix(‘1’isassignedto val-uesabovethethresholdand‘0’toothers).Automatedalgorithms, suchasstandardk-means,canfindsuchathreshold.Aclustering algorithmisthenappliedtothedigitalizedinteractionmatrixto identifyassemblymembership(Fig.6D,right),undertheconstraint thattherearetwoassemblies(whichcorrespondtothenumberof eigenvaluesabovetheMarˇcenko–Pasturdistributioninthis exam-ple).Finally,theAVsaredefinedasthemeanofallneuronvectors exclusivetoanassembly(Fig.6E):
AVa=1
na
i
Ni,
whereNiistheneuronvectorofanexclusiveneuronofthe corre-spondingassemblyandnaisthenumberofexclusiveneurons.
activityofindividualcellassemblies,whichcannotbeachievedby theoriginalPCAmethodinthiscase(Fig.6G).
DespitebeinganimprovementovertheoriginalPCAframework, theAVmethodhaslimitations.First,theAVmethodbydefinition requireseach assembly tohaveat leastoneexclusive member. Moreover,theseparationbetweensmallandlargeinnerproducts intheAssemblySpace(Fig.6C)isnotalwaysclear.Thisis criti-calbecausek-meanssplitsthedataintotwogroupsirrespectiveof whethertheyareclearlyseparatedornot,whichmayleadto spu-riousseparation.Belowwedescribeanothermethodforextracting assemblypatternsthatalsoreliesonfirstanalyzingthespikematrix usingPCA,andthenproceedswithICAtoidentifyassemblypatterns evenwhencellassemblieshavenoexclusiveneuron.
2.3.3. Independentcomponentanalysis
Laubachetal.(1999,2000)introducedICAtoquantify
interac-tionsamongneurons.InthissectionwereviewbasicICAtheory andshowhowthistoolcanbeusedtoestimateassemblypatterns. Roughlyspeaking,ICAisamethodtoextractstatistically indepen-dentnon-Gaussiancomponentsofamultivariatesignal.Rigorous mathematicalderivationscanbefoundelsewhere(Comon,1994;
HyvarinenandOja,1997;JuttenandHerault,1991).Assumingthat
thetimecourseoftheactivityofanassemblyisdescribedas:
R=wTZ,
notethatweonlyknowZ(thespikematrix)andmustestimate bothwandR.
ICAreliesontheCentralLimitTheorem,whichstatesthat(under certainconditions)themixoftwoindependentrandomvariables ismoreGaussianthantheoriginalvariables.Inotherwords,any linearcombinationofindependentassemblyactivitiesisexpected tobemoreGaussianthantheindividualassemblyactivities them-selves.Fromthisreasoning,ICAiterativelyrotatestheaxesofan initialrandom vectorwin ordertominimizesomeGaussianity measureofy=wTZ.AsnotedbyHyvarinenandOja(2000),there
areseveralmeasuresofGaussianity(ornon-Gaussianity).Herewe employthefastICAalgorithm(Hyvarinen,1999;HyvarinenandOja, 1997)whichusesapproximatingnegentropy,definedas:
Jappr(y)=
i
[E{Gi(y)}−E{Gi(
v
)}]2,where
v
isaGaussianvariablewithzeromeanandunitaryvariance,andGiarethenon-quadraticfunctions:
G1(u)=1
alogcoshau, G2(u)=−exp(− u2
2),
where1≤a≤2.Forfurtherdetailsonapproximatingnegentropy andotherGaussianitymeasuresseeHyvarinenandOja(2000).
UsingICA,Laubachetal.(1999, 2000)studiedhow neuronal ensemblesin the motor cortex of rats evolved as the animals learnedtoperformareaction-timetask.Intheirwork,however, theauthorsassumedthatthenumberofeigenvalueslargerthan 1representedthenumberofsignificantindependentcomponents (andhencethenumberofassemblypatternsconsideredforfurther analyses).Thisprocedureconsiderablyoverestimatesthenumber ofcellassembliesinthenetwork,which,asreviewedabove,should betakenasthenumberofeigenvaluesabovetheupperlimitofthe Marˇcenko–Pasturdistribution.Weobservedthroughsimulations thattheincorrectdeterminationofthenumberofassembliesmay leadtospuriousresults(notshown).Thisbecomesmorecritical ifICAisperformedintheoriginaldataspace,i.e.,withnoprior dimensionalityreduction.Inthiscase,assemblypatternsare bro-kenintotwoormoreindependentcomponents.Inaddition,since ICAbydesigndoesnotextractco-activationpatterns,some inde-pendentcomponentsmayrepresenttheactivityofsingleneurons
thatdonotfirefollowingaGaussiandistribution.Toavoidthese issues,herewesuggestamodificationoftheoriginalICAapproach whichisachievedbyincorporatingtheuseoftheMarˇcenko–Pastur distributioninordertoestimatethenumberofcellassemblies.This modifiedapproachinvolvesfirstreducingthedimensionalityofthe spikematrixZbyprojectingZontothesubspacespannedbythe significantPCs,andthencomputingtheindependentcomponents throughthefastICAalgorithm.Insimpleterms,thenewframework firstfindsthesignificantPCsandthenrotatesthemtomatchthe idealassemblypatterns.
Fig.7illustratestheperformanceofPCAandmodifiedICA frame-works in extracting non-orthogonal assembly patterns.A spike matrixwassimulatedasbefore,butwith20neurons.Assembly membershipwas:assembly1,neurons#11,#12,#13,#14; assem-bly2,neurons#14,#15,#16,#17;andassembly3,neurons#18, #19,#20.Notethatneuron#14participatesinassemblies1and2. ThecorrelationmatrixisshowninFig.7A,alongwithits eigenvec-torsandeigenvalues.Sincetherearethreecellassemblies,three eigenvalues lie above thetheoretical threshold. The significant PCsandtheindependentcomponentsareshowninFig.7B.Note thatwhiletheindependentcomponentscorrectlyattributelarger weightstotheproperassemblymembers,thePCsfailtocorrectly segregateassemblypatterns.Fig.7Cshowsatimeintervalofthe spikematrixalongwiththetimecourseofassemblyactivity esti-matedbybothmethods.Notethattheblueassemblycomputed bythePCAmethodpeaksfortheactivationsofbothassemblies 1and 2, whileassembly activitiescomputedfromindependent componentscorrectlytrackindividualassemblyactivations.
2.3.4. Otherexamples
For further comparisons, we applied the three methods describedabovetotwootherexamples.Inbothcases,assemblies werehighlydistributedandthusdifficulttosegregate.
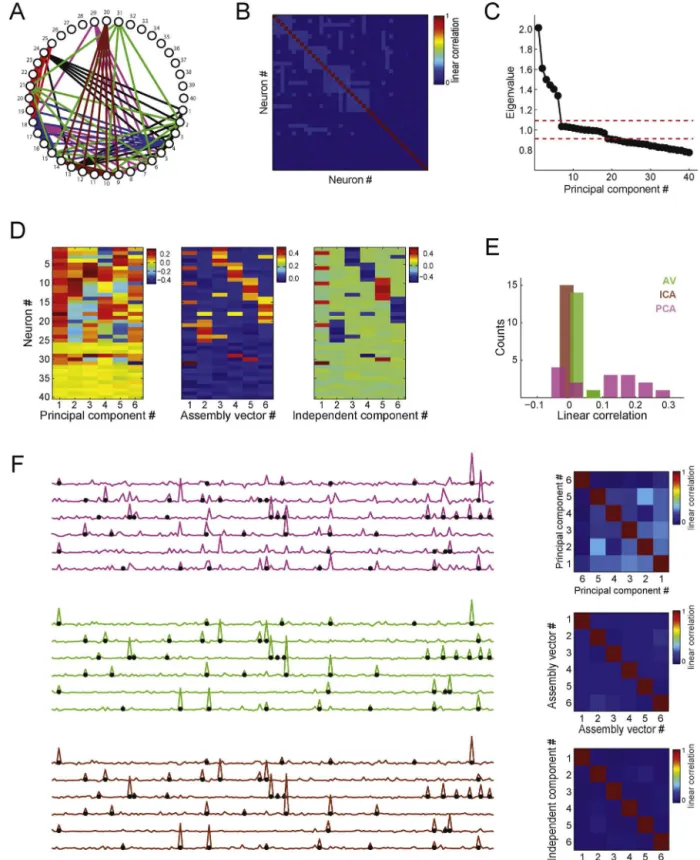
Thefirstexampleisshown inFig.8.Aspikematrixwith40 neurons(1spike/binmeanrate)and20,000timebinswas simu-lated;eachneuronhad800activationbins.AsshowninFig.8A,the assemblyidentitieswere:assembly1,neurons#1,#2,#3,#4,#5, #13,#24;assembly2,neurons#4,#5,#6,#7,#8,#9,#18,#29; assembly3,neurons#9,#10,#11,#12,#13,#14,#30;assembly4, neurons#3,#14,#15,#16,#17,#18,#19,#20;assembly5, neu-rons#18,#20,#21,#22,#23,#24,#25;assembly6,neurons#2, #6,#10,#15,#21,#31.Fig.8Bshowsthecorrelationmatrix;the eigenvaluedistributionisshowninFig.8C.Sixeigenvalueslieabove theupperboundandtwenty-twobelowthelowerthreshold,which matchesthenumberofsimulatedassemblies(6)andthenumber ofassemblyneurons(28).
Fig.8Dshowshoweachmethodestimatedtheassembly pat-terns.While PCAmixed theassemblypatterns,theAV and ICA methodscorrectlyattributedlargerweightswithsamesignsfor assembly memberswithina pattern. For instance,independent component#1andassembly vector#1representedassembly6 (greenassemblyinFig.8A).Sinceactivationbinsareindependent amongassemblies, assemblyactivitiesshouldideally not corre-late.Fig.8Eshowsthehistogramoflinearcorrelationcoefficients obtainedforallpossiblepairsofassemblyactivities.Notethatthe PCAmethodestimatesassemblyactivitiesthataremorecorrelated thanwhenestimatedbytheAVandICAmethods.Theleftpanelsin
Fig.7.Detectingandtrackingcellassemblyactivityusingindependentcomponentanalysis.(A)Left:Correlationmatrixofaspikematrix(notshown)with20neurons.Inthis example,3assemblieswerepresentinthenetwork(assembly1:neurons#11,#12,#13,#14;assembly2:neurons#14,#15,#16,#17;assembly3:neurons#18,#19,#20). Right:Associatedeigenvaluesandprincipalcomponents.Notethatthreeeigenvaluesaresignificant.(B)Assemblypatternsestimatedbyprincipalcomponents(left)and byindependentcomponents(right).Notethatassemblypatternsarebettersegregatedinthelattercase,i.e.,eachassemblypatternhaslargeweightsforitscorresponding members.(C)Representativetimeintervalofaspikematrix(top)andassemblyactivitytimecourseestimatedbyprincipalcomponentanalysis(PCA)andindependent componentanalysis(ICA)(bottom).Differentcolorsrepresentprojectionsobtainedusingdifferentassemblypatterns(asbefore,projectorsaredefinedbytheouterproduct ofassemblypatterns).NotethatthebluetraceinthePCAframeworkpeaksforactivationsofbothassemblies1and2.Ontheotherhand,assemblyactivityestimatedbyICA properlysegregatesthethreeassemblies.(Forinterpretationofthereferencestocolorinthisfigurelegend,thereaderisreferredtothewebversionofthearticle.)
in Fig.8E);again, notice lowercorrelations for theAV and ICA methods.
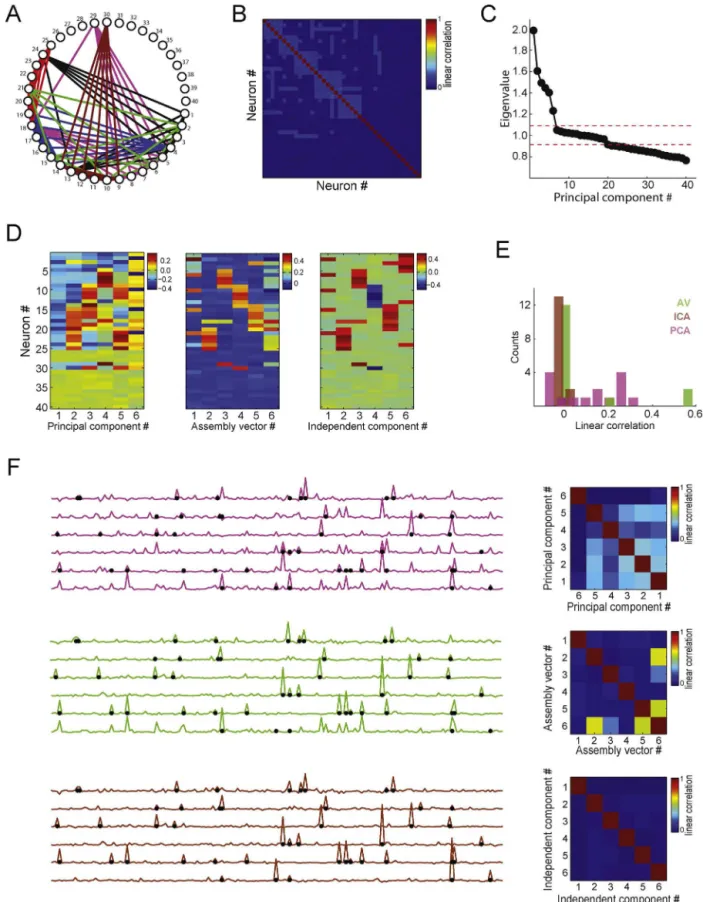
Fig.9showsa casein whichtheAV methodfails. Thespike matrix wassimulated as in the last example but witha slight differencein assembly composition: neuron #31 wasremoved fromassembly6,andthusthisassembly hadnoexclusive neu-ron(Fig.9A).Thecorrectnumberofassembliesisstilldetectedby theanalysisoftheeigenvaluesofthecorrelationmatrix(Fig.9B,C).
Theassemblypatternsestimatedbyallthreemethodsareshownin
Fig.9.PCA,ICAandAVmethodperformanceforcellassemblieswithnoexclusiveneurons.40neuronsweresimulatedasinFig.8.(A)Simulatedcellassemblies.Same asFig.8,exceptthatneuron#31doesnotpertaintoassembly6,whichconsequentlyhasnoexclusiveneuron(thatis,allneuronsinassembly6participateinatleastone otherassembly).(B)Correlationmatrix.(C)Eigenvaluedistribution.(D)Assemblypatternsestimatedbyeachmethod.NotethatforthiscasetheAVframeworkdoesnotfind assembly6.(E)SameasFig.8E.(F)SameasFig.8F.NotethattheAVmethoddoesnotproperlytracktheactivityofassembly6,whichisestimatedasamixtureofmultiple assemblies.(Forinterpretationofthereferencestocolorinthisfigurelegend,thereaderisreferredtothewebversionofthearticle.)
notethatwhiletheactivitiesofthefirstfiveassembliesarewell estimated,theactivityofthesixthassemblyismostlyamixture ofthethirdandthefifthcellassemblies(leftpanel),ascanalso beseenfromthecorrelationcoefficientsshownintherightpanel.
Finally,noticethat,asinFig.8,theICAmethodstillprovidesagood estimationforallcellassemblies.
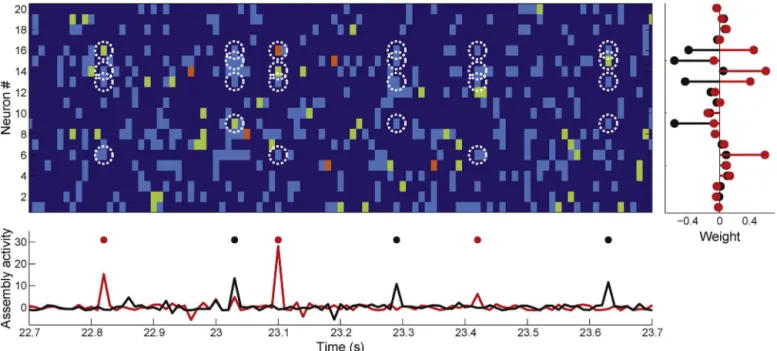
Fig.10.ApplicationoftheICA-basedframeworktorealisticsimulations.Eachneuronofthespikematrixwascreatedfromacircularshiftofactualspiketimesofahippocampal neuron(sameprocedureasinFig.3C).Twocellassembliesweresimulatedbyincludingcommonspikestoassemblymembers,whichweredrawnfromindependentPoisson processesforeachassembly(meanrate:2Hz).Assembly1wascomposedbyneurons#9,#13,#15and#16;assembly2byneurons#6,#13,#14and#16(notice50%of overlapbetweenassemblies).Topleftpanelshowsatimeintervalofthespikematrix;circlesmarkco-firingofassemblymembers.Rightpanelshowsassemblypatterns extractedbytheICA-basedframework.Bottompanelshowsestimatedtimecourseofassemblyactivitycomputedfromtheassemblypatterns.EventsofthePoissonprocesses usedtogenerateassemblyactivationsareindicatedbycoloreddots.(Forinterpretationofthereferencestocolorinthisfigurelegend,thereaderisreferredtotheweb versionofthearticle.)
actualspiketrainsasinFig.3C.Inordertosimulateacellassembly, commonspiketimesgeneratedbyaPoissonprocesswithmeanrate of0.02spikes/bin(2Hz)wereaddedtothespiketrainsofagroupof neurons.Wesimulatedtwooverlappingcellsassemblies: assem-bly1,composedbyneurons#6,#13,#14and#16;andassembly 2,composedbyneurons#9,#13,#15and#16.Accordingly,the ICA-basedmethodextractedtwo assemblypatterns,which cor-respondedtotheprogrammedcellassemblies(Fig.10topright panel).Weshowarepresentativetimeintervalofthespikematrix inthetopleftpanelofFig.10.Dashedcirclesshowco-activationsof assemblymembers.Thebottompanelshowsestimatedassembly activitiesalongwithcoloreddotsthatindicateeventsofthe Pois-sonprocessesusedtogenerateassemblyactivations.Notethatthe timecoursesofassemblyactivitiesestimatedbytheICAmethod peakaccordingly.
3. Realdataapplications
In this section we analyze spike trains of 19 single-units recordedfromtheCA1regionofthehippocampusofafreely mov-ingratexploringanopenfield.Thedatawasdownloadedfrom theCollaborativeResearchinComputationalNeuroscience(CRCN) webpage(http://crcns.org/).Detailedinformation onrecordings, behaviorandsurgerycanbefoundinMizusekietal.(2009).The spikematrixwasconstructedusing10-msbins.Toestimatethe numberofcellassemblies,theeigenvaluesofthecorrelationmatrix were compared to the theoretical threshold derived from the Marˇcenko–Pasturdistribution.Assemblypatternswereextracted fromthespikematrix usingthemodified ICA-basedframework described above. We here further adapted this framework by increasingitstimeresolution.Sinceneuronalfiringcanoccurin differentbinsevenwhenspikesareseparatedbyafew millisec-onds,weestimatedthetimecourseofassemblyactivitybydirectly applyingtheprojectoroperatorstospiketrainsaftersmoothing themwithaGaussiankernel(maximumvalue=1,standard devia-tion=12ms).Inthisframework,therefore,assemblyactivitiescan
becomputedwiththesametimeresolutionasthelocalfield poten-tial(LFP),andcouplingbetweenthesesignalscanbeevaluated.
Atimeintervalofthespikerasterplotoftheneuronal popu-lationisshowninthetopleftpanelofFig.11A.Therightpanels showthreeassemblypatternsextractedfromtheassociatedspike matrix.Neuronswithlargeweightsinasamepatternaredisplayed withsamecolor.Estimatedassemblyactivitiesareshowninthe plotunderneaththerasterplot.Noticethatonlytheblueassembly isactiveinthedepictedperiod,andthatassemblyactivitypeaks whenmostofitsneuronsareco-active;incontrast,isolatedfiring ofthesameneuronsdoesnotaffectassemblyactivity.Theongoing LFPisshowninthebottompanel.Examplesfromthesame recor-dingsessioninwhichthemagentaandredassembliesareactiveare showninSupplementaryFig.1.
Weusedstandardanalysistechniquestostudytheactivityof CA1cellassembliesidentifiedbythisframework.Althoughitis usu-allyassumedthatneuronswithhigherfiringprobabilityatthesame phaseofanongoingoscillationarepartofthesamecell assem-bly,non-overlappingassemblieswithsamephasepreferencehas beenpreviouslyshownbyHarrisetal.(2003).Inaccordancewith thisresult,herewealsoobservedthatindependentassembliescan havesimilarphasepreferences.Fig.11Bshowstheautocorrelation ofthethreeassemblieshighlightedinFig.11A alongwiththeir correspondingtheta-phasedistributionsofassemblyactivations. Theta-phasedistributions wereobtainedby(1)filteringtheLFP intothethetarange(6–10Hz),(2)computingtheinstantaneous thetaphasesusingtheHilberttransform,(3)localizingthephases associatedwiththepeaksofassemblyactivity,and(4)expressing thephasesbymeansofacircularhistogram.Noticethattheblue andmagentaassemblieshavesimilarpreferredphase,whilethered assemblywasmostactiveinadifferentthetaphase.Allassemblies weresignificantlycoupledtoongoingthetaoscillations(Rayleigh test,p<10−6).
2 4 6 8 10 12 14 16 18 Neuron # 0 40 80
Assembly activity (z)
814.3 814.5 814.7 814.9 815.1
−2 0 2
Time (s)
Amplitude (z)
0 0.5 1 0 0.5 1
Assembly template weight
0 0.5 1
A
B
100 200 5 15 30 210 60 240 90 270 120 300 150 330 180 0 20 60 0.05 0.15 0.25 Linear correlationC
0.05 0.15 0.25 Linear correlation 30 210 60 240 90 270 120 300 150 330 180 0−0.5 −0.3 −0.1 0.1 0.3 0.5
Lag (s) 0.05 0.15 0.25 Linear correlation 30 210 60 240 90 270 120 300 150 330 180 0
Theta phase histogram
25 50 50 100 Inactive Active 0 0.1 0.2 0.3 0.4 0.5 0.6 0.7
Spike−theta phase coherence
30 210 60 240 90 270 120 300 150 330 180 0 30 210 60 240 90 270 120 300 150 330 180 0 Assembly state Active Inactive
Fig.11.Realdataapplications.(A)Top-leftpanelshowsatimeintervalofthespikerasterplotof19single-unitsrecordedfromthehippocampalCA1pyramidallayer. Top-rightpanelsshowthreeassemblypatternsdetectedbytheICA-basedmethod.Theneuronswithlargestweightsineachassemblywerecolor-coded.Estimatedassembly activitiesareshownbelowtherasterplot.Thebottompanelshowstheongoinglocalfieldpotential(LFP).AssemblyactivitiesandLFParez-scored.Notethattheco-activation oftheblueneuronsisindicatedbythepeaksofthecorrespondingassemblyactivity.(B)LeftpanelsshowautocorrelationsofthesamecellassembliesasinA.Rightpanels showthetheta-phasehistogramofassemblyactivations.Noteclearcouplingbetweenassemblyactivityandhippocampalthetaoscillations.(C)Leftpanelsshowthetheta phasedistributionofspikesforanassemblyneuroninside(bottom)andoutside(top)assemblyactivations.Rightpanelshowsmeanspike-thetaphasecoherenceofassembly neuronswhenthecellassemblywasinactiveoractive(blackcircle;errorbarsdenotestandarddeviation).Individualcasesareshowningray.(Forinterpretationofthe referencestocolorinthisfigurelegend,thereaderisreferredtothewebversionofthearticle.)
asassemblyactivityaboveitsmean+2standarddeviations).The remainingspikeswereusedtoconstructtheseconddistribution.A representativeexampleisshowninFig.11C:thebottomleftpanel showsthedistributionofspikephasesduringassemblyactivations, whereasthetopleftpanelshowsthephasedistributionforspikes occurring when the cell assembly was inactive. Note that the neuroninthisexampleis stronglycoupledtothethetarhythm
when its assembly is active. To compute a group result, for eachassembly neuronwecalculatedthespike-phasecoherence inside and outsideassembly activations. Spike-phasecoherence wasdefinedasthelengthofthemeanphasoreiϕ,whereisa
each case and bars indicate standard deviations. These results showthatneuronscouplemorestronglytothethetarhythmwhen firing in synchrony with other assembly members (p=0.0039, Wilcoxonranksumtest).
4. Discussion
Recentadvanceshaveopenedthepossibilityoftesting influen-tialtheoriesonnetworkfunctioninganditsrelationtobehaviorand memory.Herewereviewedthreelinearmethodsforcomputing cellassemblyactivity.WebeganbyintroducingtheoriginalPCA approach,whichwasthefirstemployedtotrackcellassemblies
(Nicolelisetal.,1995),andisstillusefulnowadaysingenerating
insightsaboutorganizedspikingactivity(Benchenaneetal.,2010;
Peyracheetal.,2009).Next,we showedthat assemblypatterns
estimatedbyPCshaveimportantlimitationsthatcanbeovercome theAVframework(Lopes-dos-Santosetal.,2011),whichidentifies cellassembliesbasedoncorrelationpatternswithinthesubspace spannedbythesignificantPCs.Finally,wepresentedamodified versionof a previously described ICAapproach (Laubach et al., 1999),whichincorporatesthestatisticalthresholdprovidedbythe Marˇcenko–Pasturdistribution.Weshowedthatthismethod pro-videsevenmorerobustestimatesofassemblypatternsthantheAV method.
Thelargeinterestinthisfieldledtothedevelopmentof analyti-caltoolsabletoidentifyhigh-ordercorrelationsthatcanpotentially replacepair-wiseanalyses(StevensonandKording,2011). How-ever,severalmethodscanonlybeappliedtosmallnetworksdueto combinatorialexplosion(Bergeretal.,2010;Grunetal.,2002;Tetko
andVilla,2001).Inordertoovercomethisproblem,someauthors
haveproposedmethodologiesthatdetecthigh-ordercorrelations ignoringhowcellsareinvolvedinthecoalitions(Louisetal.,2010;
Staudeetal.,2010a,b).Themethodsreviewedherecanbeapplied
tolargeneuronal populations,andneuronal activityisassessed asawholethroughtheuseofeigenvalueanalysis.Additionally, theMarˇcenko–Pasturdistributionopens thepossibilityofusing ananalyticalandreliablestatisticsinsteadofsurrogatemethods employedinpreviousframeworks(Abeles,2009;AbelesandGat,
2001;AbelesandGerstein, 1988;Humphries,2011; Maldonado
etal.,2008;Shmieletal.,2006).Inadditiontobeing
computation-allydemanding,aprobleminherenttotheuseofsurrogatesisthe factthatthereisnoconsensusaboutwhichstatisticalproperties shouldbepreservedinthesecontroldata(Bergeretal.,2010;Grun, 2009).Forexample,wehaveshownherethatsurrogatemethods that preserveISI counts and auto-correlationsprovidedifferent thresholdsforstatisticalsignificancethanlessconservative shuf-flings(Fig.3C).
We note that although ICA assumesa linear model for cell assemblies,it employsnonlinearequationsin ordertoquantify Gaussianity,whichcanbegreatlyoptimizedbythefastICA algo-rithm (Hyvarinen and Oja, 1997). In fact, while the ICA-based frameworkismorecomputationallydemandingthanthePCAand AVmethods,itisstillfasterthanmostnonlinearalgorithms.In gen-eral,frameworksemployingmorecomplexmathematicsrequire extensivedatacrunchingthatoftenyieldresultsdifficultto inter-pretbynon-specializedresearchers.Themethodsstudiedhereare intuitiveandgenerate resultseasy visualizeinraw data,which shouldfavortheircomprehensionandbroadusebythescientific community.
4.1. Limitations
Noneofrevisedmethodsisoptimal,andthereisroomfor fur-therimprovements.Forexample,ICAcannotfindassembliesifthey followaGaussiandistribution.Moreover,non-linearspike correla-tionsmayproducespuriousresultsinassemblydetectionmethods thatdependonPCA.Roughlyspeaking,whenthescatterplotof tworandomvariableshasacurvedshape,theeigenvalueanalysis mayrevealtwodimensionswithlargevariance.Byconsequence, PCA-basedmethodswouldfalselyidentifytwoassembliesinthe network,whileonlyonepairofneuronsiscorrelated.Itshouldbe notedthatothermethods,suchastheonedescribedinHumphries
(2011),canbeadaptedtoothermeasuresofspiketrainsimilarity
besideslinearcorrelations.
Itisalsorelevanttonotethatthebinsizeusedtocreatethespike matrix(Fig.1)definesthetimescaleofthedetectedassemblies,and thusdifferentbinsizescanyielddifferentresults.Weillustratethis possibilityinFig.12.Inthisexample,neuronsinassembly1fireata Poissonratedefinedbya10-Hzsinusoid(Fig.12Btop),while neu-ronsinassembly2firesynchronousspikesbasedontherealizations ofaPoissonprocess,despitealsoemittingindependentrandom spikesoutsideassemblyactivations(Fig.12Bbottom).Usinga 1-msbinsizetoconstructthespikematrixleadstothedetectionof assembly2(Fig.12Cbottom),whichneuronsspikeinprecise syn-chrony;assembly1isnotdetectedbecauseofthejitterinthespike timesofitsneurons.Ontheotherhand,employinga50-msbinsize leadstotheexclusivedetectionofassembly1(Fig.12Ctop),since atthistimescaleassembly1neuronsareco-activeandthe ran-domspikesofassembly2neuronsoccurringwhentheassembly isnotactivemaskassembly2activations.Thus,theextracted co-activationpatternshaveatimescaledefinedbythebinsize,which shouldbeconsideredwheninterpretingresults.
Finally, one should notethat thereviewed methods do not disambiguatebetweenstimulus-drivenandinternallygenerated spikecorrelations.Forinstance,spikecorrelationscanbedetected whenneuronshavesimilartuningcurves,irrespectiveofwhether theyare wired togetheror not. Thus, a pair of CA1 pyramidal cellswithoverlappingplacefieldscanbepotentiallyidentifiedas composinganassembly dependingonthe timescale (bin size) employedintheanalysis.However,wenotethatthisfeatureis inherenttothedefinitionofacellassembly,whichisusuallytaken asagroupofcellsthatfiretogether(andcollectivelyrepresentan object,asensation,anaction,etc.),independentlyofwhatcauses thecorrelatedfiring.Inourview,whetherneuronspresenting cor-relatedactivityduetocommonsensoryinputsshouldornotbe consideredacellassemblyisamatterofdefinition.
5. Conclusion
Linearmethodsarecomputationallylowdemanding,andyet quiteefficientfortrackingcellassemblyactivity.Hebb’sseminal workcomprises oneofthemostinfluential theoriesinmodern neuroscience.Yet,todateonlyfewstudieshaveaddressedHebb’s ideasatthesystemslevel.Wehopethatthemethodsreviewed herecanleadtoaproperestimationofco-activationpatternsand helpansweringwhethercellassemblieshaveanyfunctionalrole, asoriginallyenvisionedbyHebb.
Acknowledgements
SupportedbyConselhoNacionaldeDesenvolvimentoCientífico eTecnológico(CNPq),Coordenac¸ãodeAperfeic¸oamentodePessoal deNívelSuperior(CAPES),andFundac¸ãodeApoioàPesquisado EstadodoRioGrandedoNorte(FAPERN).WethanktheBuzsáki labformakinginvivoCA1recordingspubliclyavailablethrough
theCollaborativeResearchinComputationalNeurosciencewebsite
(http://crcns.org/),adatasharingwebsitefundedbytheNational
ScienceFoundation.WealsothankSergioConde-Ocazionez,Enio AguiarandAdrienPeyracheforhelpfuldiscussions.Theauthors declarenocompetingfinancialinterests.
AppendixA. Supplementarydata
Supplementarydataassociatedwiththisarticlecanbefound, in the online version, at http://dx.doi.org/10.1016/j.jneumeth.
2013.04.010.
References
AbelesM.SynfireChains2009,http://www.scholarpedia.org/article/Synfirechains AbelesM,GatI.Detectingprecisefiringsequencesinexperimentaldata.JNeurosci
Methods2001;107:141–54.
AbelesM,GersteinGL. Detectingspatiotemporalfirigingpatternsamog simulta-neouslyrecordedsingleneurons.JNeurophysiol1988;60:909–24.
AdrianED,ZottermanY. Theimpulsesproducedbysensorynerve-endingsPartII. Theresponseofasingleend-organ.JPhysiol(Lond)1926;61:151–71. ArabzadehE,PanzeriS,DiamondM.Whiskervibrationinformationcarriedbyrat
barrelcortexneurons.JNeurosci2004;24:6011–20.
BenchenaneK, PeyracheA, KhamassiM,TierneyPL, GioanniY, BattagliaFP, etal. CoherentThetaoscillationsandreorganizationofspiketiminginthe hippocampal-prefrontalnetworkuponlearning.Neuron2010;66:921–36. BergerD,BorgeltC,LouisS,MorrisonA,GrünS.Efficientidentificationofassembly
neuronswithinmassivelyparallelspiketrains.ComputIntelNeurosci2010:18. BiroliG,BouchaudJP,PottersM. Onthetopeigenvalueofheavy-tailedrandom
matrices.EurophysLett2007;78:5.
Buzsaki G. Large-scale recording of neuronal ensembles. Nat Neurosci 2004;7:446–51.
ChapinJK,NicolelisMAL. Principalcomponentanalysisofneuronalensemble activityrevealsmultidimensionalsomatosensoryrepresentations.JNeurosci Methods1999;94:121–40.
ComonP. Independent componentanalsysis, a newconcept? SignalProcess 1994;36:287–314.
GanselKS,SingerW.Detectingmultineuronaltemporalpatternsinparallelspike trains.FrontNeuroinform2012:6.
GrunS.Data-drivensignificanceestimationforprecisespikecorrelation.J Neuro-physiol2009;101:1126–40.
GrunS,DiesmannM,AertsenA. Unitaryeventsinmultiplesingle-neuronspiking activity:1detectionandsignificance.NeuralComput2002;14:43–80. HarrisKD,CsicsvariJ,HiraseH,DragoiG,BuzsakiG.Organizationofcellassemblies
inthehippocampus.Nature2003;424:552–6.
HebbDO.Theorganizationofbehaviour:aneuropsychologicaltheory.NewYork: PsychologyPress;1949.
HubelDH,WieselTN.Receptivefieldsofsingleneuronesinthecat’sstriatecortex. JPhysiol(Lond)1959;148:574–91.
HumphriesMD. Spike-traincommunitiesfindinggroupsofsimilarspiketrains.J Neurosci2011.
HyvarinenA. Fastandrobustfixed-pointalgorithmsforindependentcomponent analysis.IEEETransNeuralNetworks1999;10:626–34.
HyvarinenA,OjaE.Afastfixed-pointalgorithmforindependentcomponent anal-ysis.NeuralComput1997;9:1483–92.
HyvarinenA,OjaE.Independentcomponentanalysis:algorithmsandapplications. NeuralNetworks2000;13:411–30.
JuttenC,HeraultJ. Blindseparationofsources,partI:anadaptivealgorithmbased onneuromimeticarchitecture.SignalProcess1991;24:1–10.
LaubachM,ShulerM,NicolelisM.Independentcomponentanalysesforquantifying neuronalensembleinteractions.JNeurosciMethods1999;94:141–54. LaubachM,WessbergJ,NicolelisMAL.Corticalensembleactivityincreasingly
pre-dictsbehaviouroutcomesduringlearningofamotortask.Nature2000:405. LeeAK,WilsonMA. Memoryofsequentialexperienceinthehippocampusduring
slowwavesleep.Neuron2002;36:1183–94.
Lopes-dos-SantosV,Conde-OcazionezS,NicolelisM,RibeiroS,TortA. Neuronal assemblydetectionandcellmembershipspecificationbyprincipalcomponent analysis.PLoSOne2011;6:e20996.
LouieK,WilsonM.Temporallystructuredreplayofawakehippocampalensemble activityduringrapideyemovementsleep.Neuron2001;29:145–56. LouisS,BorgeltC,GrunS.Complexitydistributionasameasureforassemblysize
andtemporalprecision.NeuralNetworks2010;23:705–12.
MaldonadoP,BabulC,SingerW,RodriguezE,BergerD,GrunS.Synchronizationof neuronalresponsesinprimaryvisualcortexofmonkeysviewingnaturalimages. JNeurophysiol2008;100:1523–32.
MarˇcenkoVA,PasturLA.Distributionofeigenvaluesforsomesetsofrandom matri-ces.MathUSSR-Sbornik1967;1:457–83.
NicolelisMAL,BaccalaLA,LinRCS,ChapinJK. Sensorimotorencodingby syn-chronousneuralensembleactivityatmultiplelevelsofthesomatosensory system.Science1995;268:1353–8.
OkeefeJ,DostrovsJ. Hippocampusasaspatialmap–preliminaryevidencefrom unitactivityinfreely-movingrat.BrainRes1971;34:171–5.
PerrettD,RollsE,CaanW. Visualneuronesresponsivetofacesinthemonkey temporalcortex.ExpBrainRes1982;47:329–42.
PeyracheA,KhamassiM,BenchenaneK,WienerSI,BattagliaFP. Replayof rule-learningrelated neuralpatternsintheprefrontalcortexduring sleep.Nat Neurosci2009;12(919),U143.
PeyracheA,BenchenaneK,KhamassiM,WienerSI,BattagliaFP.Principal compo-nentanalysisofensemblerecordingsrevealscellassembliesathightemporal resolution.JComputNeurosci2010;29:309–25.
PlerouV,GopikrishnanP,RosenowB,AmaralLAN,GuhrT,StanleyHE. Random matrixapproachtocrosscorrelationsinfinancialdata.PhysRevE2002:65. QuirogaRQ,PanzeriS.Extractinginformationfromneuronalpopulations:
informa-tiontheoryanddecodingapproaches.NatRevNeurosci2009;10:173–85. RibeiroS,GervasoniD,SoaresES,ZhouY,LinSC,PantojaJ,etal.Long-lasting
novelty-inducedneuronalreverberationduringslow-wavesleepinmultipleforebrain areas.PLoSBiol2004;2,126-37.
SebaP.RandommatrixanalysisofhumanEEGdata.PhysRevLett2003;91:4. ShmielT,DroriR,ShmielO,Ben-ShaulY,NadasdyZ,ShemeshM,etal.Temporally
precisecorticalfiringpatternsareassociatedwithdistinctactionsegments.J Neurophysiol2006;96,2645-52.
SiapasAG,LubenovEV,WilsonMA.Prefrontalphaselockingtohippocampaltheta oscillations.Neuron2005;46,141-51.
StaudeB,GrunS,RotterS.Higher-ordercorrelationsinnon-stationaryparallelspike trains:statisticalmodelingandinference.FrontComputNeurosci2010a:4. StaudeB,RotterS,GrunS. CuBIC:cumulantbasedinferenceofhigher-order
cor-relationsinmassivelyparallelspiketrains.JComputNeurosci2010b;29, 327-50.
StevensonIH,KordingKP. Howadvancesinneuralrecordingaffectdataanalysis. NatNeurosci2011;14:139–42.
TetkoIV,VillaAEP.Apatterngroupingalgorithmforanalysisofspatiotemporal pat-ternsinneuronalspiketrains,detectionofrepeatedpatterns.JNeurosciMethods 2001;105:1–14.
TracyCA,WidomH.Level-spacingdistributionsandtheairykernel.CommunMath Phys1994;159:151–74.