1
SOME CORRELATIONS BETWEEN YIELD
ELEMENTS IN INTRODUCED DURUM WHEAT
ACCESSIONS
Zapryanka POPOVA* , Nikolay NEYKOV
*Institute of Plant Genetic Resources, 4122 Sadovo, Bulgaria e-mail:[email protected]
ABSTRACT
The correlations between the yield and the elements which determine it in 10 accesions of durum wheat have been studied. A positive correlation has been established between plant height and the last internode length (r=0.72). It was established that the length of the top /1 st / internode take about 40% of the total stem length. A positive correlation was found between the weight of seeds per plant and the productive tillering (r=0.81). The correlation between number of seeds per spike and weight of seeds per spike, number of spikelets per spike and weight of seeds per spike and the weight of seeds per spike and per plant is - 0.86, 0.83 and 0.76.Moderately the correlations exists between the weight of seeds from the main spike and from the rest stems and correlation between spike length and weight of seeds per spike (r=0.45 and r=0.36). A negative correlation between the weight of seeds per plant and mass of 1000 seeds was established (r=-0.51).
Keywords: durum wheat, agronomic characters, accessions, correlations
10 .
(r=0.72). ,
40 % .
(r=0.81).
,
r= 0.86, 0.83 0.76.
(r=0.45 r=0.36).
1000 (r=-0.51).
: , , ,
99 99 99
2
DEATAILED ABSTRACT
The
correlations between the yield and the elements which determine it in 10 accesions of durum wheat have been studied. A positive correlation has been established between plant height and the last internode length (r=0.72). Conducted research on these morphological parameters are important in the selection for resistance to lodging. It was established that the length of the top /1 st / internode take about 40% of the total stem length. A positive correlation was found between the weight of seeds per plant and the productive tillering (r=0.81). For yield of grain in durum wheat are important productive tillering and grain yield of plants. It should be passed samples equivalent brothers. The correlation between number of seeds per spike and weight of seeds per spike, number of spikelets per spike and weight of seeds per spike and the weight of seeds per spike and per plant is - 0.86, 0.83 and 0.76. The highest positive correlation indicators are number and weight of grain in the central class. When building the productivity of the class they participatesignificantly.Moderately the correlations exists between the weight of seeds from the main spike and from the rest stems and correlation between spike length and weight of seeds per spike (r=0.45 and r=0.36). A negative correlation between the weight of seeds per plant and mass of 1000 seeds was established (r=-0.51).Durum wheat has biological features that can be used to create a high yield and quality of varieties, we are witnessing the last years.
, ,
,
.
,
, .
, ,
(Kdaltsikes et al.,1971; Grignac, 1973; Lee, 1973; Tesema et al., 1992).
-, ,
.( , 1985; .,1995;
.,1996; , 2004).
.
-. ( , 1969).
-, ,
,
.
.
100 100 100
3
.
2002 . 2010 .
IPGRI/1994./ 15 25
. :
;
; ;
;
1000 ; ;
;
.
10
. ,
(Draper and Smith, 1973; Grandon, 1979),
( r ) .
, - .
70.5 102.5 ,
97102076 87102065
.
.
.
,
-- - . ( , 1966).
,
, .
, -
38.9 % 50.5 % .
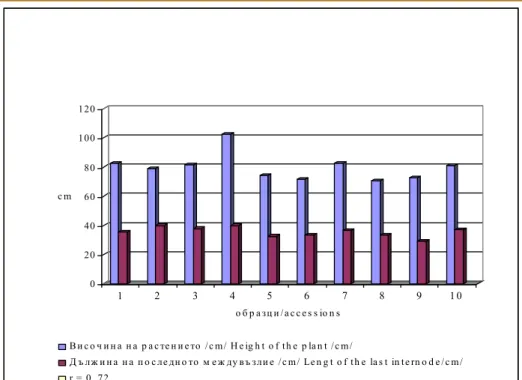
, ( .1)
r=0.72.
-. ,
40-45%.
,
.
( ., 1966 ) ,
- ,
-.
.
- -
-. ,
1.9 2.6 , 2.4 g
3.9 g. .2 .
101 101 101
4
.
r = 0.81.
,
. -
-. . 3
. r =
0.76. - ,
,
. . 4
.
,
. r = 0.86.
. 1000
. , 37.0 g 52.3 g,
, 40.0 g. .5 ,
1000 .
r = -0.51, o
. .
, ,
-,
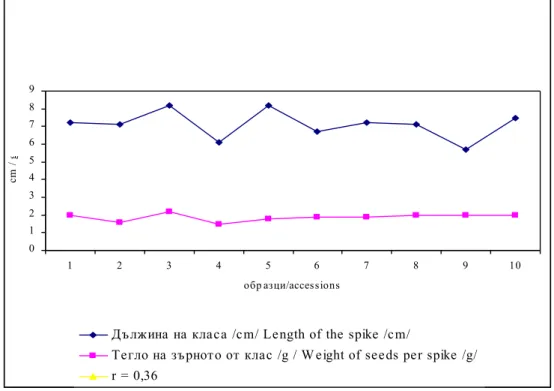
-. . 6 ,
5.7 cm 8.2 cm,
1.5 g 2.2 g.
. r = 0.36.
,
. .7
,
r = 0.83.
-, .
, . . 8
. ,
r = 0.50.
102 102 102
5
. 1
Fig. 1 Correlation between plant height and the last internode
. 2
Fig. 2 Correlation between the weight of seeds per plant and productive tillering (number stems per plant)
0 1 2 3 4 5
1 2 3 4 5 6 7 8 9 10
g
/accessions
, ./Productive tillering (number stems per
plant)
0 2 0 4 0 6 0 8 0 1 0 0 1 2 0
c m
1 2 3 4 5 6 7 8 9 1 0
/ a c c e s s io n s
o / m / H e ig h t o f t h e p la n t / c m /
/ m / Le n g t o f t h e la s t in t e rn o d e / c m / r = 0 , 7 2
103 103 103
6
. 3 , g
Fig. 3 Correlation between the weight of seeds per spike and per plant, g
0 3 6 9 12 15 18 21 24 27 30 33 36 39 42 45 48 51 54
1 2 3 4 5 6 7 8 9 10
/accessions
n
u
m
b
er
/
g
/ Number seeds per spike
/g/ Weight of seeds per plant,/g/ r = 0,86
. 4
Fig. 4 Correlation between number of seeds per spike and weight of seeds per spike
0,00 1,00 2,00 3,00 4,00 5,00
1 2 3 4 5 6 7 8 9 10
/accessions g
, g/ Weight of seeds per spike, g , g/ Weight of seeds per plant, g r = 0,76
104 104 104
7 0
5 10 15 20 25 30 35 40 45 50 55 60
1 2 3 4 5 6 7 8 9 10
/accessions
g
/g/ Weight of seeds per plant /g/
1000 /g/ Mass of 1000 seeds /g/
r = -0,51
.5 /g / 1000
Fig. 5 Correlation between weight of seeds per plant and mass of 1000 seeds
0 1 2 3 4 5 6 7 8 9
1 2 3 4 5 6 7 8 9 10
/accessions
c
m
/
g
/c m/ Le ngth of the spike /c m/
/g / W e ight of se e ds pe r spike /g/ r = 0,36
. 6 /cm /
/g/
Fig. 6 Correlation between length of the spike /cm/ and weight of seeds per spike /g
105 105 105
8 0
3 6 9 12 15 18 21 24
1 2 3 4 5 6 7 8 9 10
/accessions
n
u
m
b
er
/
g
/ Number spikelets per spike
/ g / Weight of seeds per spike / g / r = 0,83
. 7
Fig. 7 Correlation between number of spikelets per spike and weight of seeds per spike
. 8
Fig. 8 Correlation between the weight of seeds from the main spike and from the rest stems
0 0,5 1 1,5 2 2,5
1 2 3 4 5 6 7 8 9 10
/ accessions g
/g / Weight of seeds from the rest stems
/ g / Weight of seeds from the main spike
r = 0,45
106 106 106
9
-
.
.
40-45%. ,
.
r = 0.72.
. a
r = 0.81.
.3.
, r = 0.86.
.
,
.
r = 0.83.
, .
, r = 0.76.
, -
, r = 0.45
, r = 0.36.
1000
, r = -0.51.
.
,
,
.
Literatura
Gramatikova M., I.Todorov. (1996) Prouchvane varialbilnostta na niakoi priznaci niskostableni mutantni linii zimen echemik. Naychni trudove, Institut po echemika Karnobat, t.VII, 21-26.
Dechev D. (2004) Ocenka na niakoi priznaci i genotipove tvarda pshenica v usloviata na razlichni godini. Rastenievadni nauki , 6, 495-498.
107 107 107
10
Peev Hr. (1966) kn. Problemi na biologiata na tvardata pshenica. Sofia, BAN, 97-104.
Popova At., R. Dimova. (1966) kn. Problemi na biologiata na tvardata pshenica. Sofia, BAN, 85-93.
Popova Z., R. Koeva. (1995) Podbor na sortove echemik za ekologichnite uslovia na Centralna Juzhna Balgaria. gro ko Plovdiv /95/, Nauchni trudove na VSI, t. XL, kn. 1, 313-318.
Rachinski . (1969). kn Problemi na selekciata i agrotehnikata na mekata zimna pshenica. Sofia, BAN, 133-147.
Filev K., ( 1985)kn. Problemi na savremennoto balgarsko zemedelie. Sofia-BAN, 181-187.
Draper, N. and H. Smith. 1973. Step regression method. Pp. 22-24 in Applied regression analysis,statistics. (N. Draper and H. Smith). Statistics, Moskow.
Grandon, G.M. 1979. A subset of plant 78(tm) forte Applell(tm) computer. Pp. 130-132 in Modernfactor statistics. (G.M. Grandon). Statistics, Moskow.
Grignac, P., (1973) Relations between yield components of yields of durum wheat
and certain morphological characters. In: Proc. Symp. Genetics and Breeding
of Durum Wheat, Bari ,275-284.
IPGRI. 1994. Descriptors for barley (Hordeum vulgare L.). International Plant Genetic Resources Institute, Rome, Italy.
Kdaltsikes, P. J., J. Lee, (1971). Quantitative inheritance in durum wheat. Can. J.
Genet. Cytol., 13, 2, 210-218.
Lee, J., P. J. Kdaltsikes, (1973) Multivariate statistical and analysis of grain yield and
agronomic characters in durum wheat. Theoret. Appl. Genet., 43, 226-231.
Tesema Tanto and Hailu Mekbeb (1992). Evaluation of Ethiopian barley landraces for yield potential and correlations among agronomic characters, Rachis Barley and Wheat newsletter, vol. 11, 1-2.
108 108 108