Systems/Circuits
Slow Oscillations in the Mouse Hippocampus Entrained by
Nasal Respiration
Yevgenij Yanovsky,
1Mareva Ciatipis,
2Andreas Draguhn,
1Adriano B.L. Tort,
3* and Jurij Brankacˇk
1*
1Institute for Physiology and Pathophysiology, University Heidelberg, 69120 Heidelberg, Germany,2Spinal Cord Injury Center, Heidelberg University
Hospital, 69118 Heidelberg, Germany, and3Brain Institute, Federal University of Rio Grande do Norte, RN 59056-450 Natal, Rio Grande do Norte, Brazil
Different types of network oscillations occur in different behavioral, cognitive, or vigilance states. The rodent hippocampus expresses
prominent
oscillations at frequencies between 4 and 12 Hz, which are superimposed by phase-coupled
␥
oscillations (30 –100 Hz). These
patterns entrain multineuronal activity over large distances and have been implicated in sensory information processing and memory
formation. Here we report a new type of oscillation at near-
frequencies (2– 4 Hz) in the hippocampus of urethane-anesthetized mice.
The rhythm is highly coherent with nasal respiration and with rhythmic field potentials in the olfactory bulb: hence, we called it
hip-pocampal respiration-induced oscillations. Despite the similarity in frequency range, several features distinguish this pattern from
locally generated
oscillations: hippocampal respiration-induced oscillations have a unique laminar amplitude profile, are resistant to
atropine, couple differently to
␥
oscillations, and are abolished when nasal airflow is bypassed by tracheotomy. Hippocampal neurons are
entrained by both the respiration-induced rhythm and concurrent
oscillations, suggesting a direct interaction between endogenous
activity in the hippocampus and nasal respiratory inputs. Our results demonstrate that nasal respiration strongly modulates
hippocam-pal network activity in mice, providing a long-range synchronizing signal between olfactory and hippocamhippocam-pal networks.
Key words:
␥
oscillations; hippocampus; network oscillations; rodent;
rhythm; urethane
Introduction
The mammalian entorhinal– hippocampal system expresses a
va-riety of network oscillations that provide a temporal framework
for coordinated neuronal activity (
Buzsa´ki and Draguhn, 2004
).
The resulting spatiotemporal discharge patterns are causally
involved in memory formation, consolidation, and retrieval
(
Montgomery and Buzsa´ki, 2007
;
Girardeau et al., 2009
;
Buzsa´ki
and Moser, 2013
). Accordingly, different behavioral states go
along with different hippocampal oscillations at
(4 –12 Hz),
␥
(30 –100 Hz), or ripple (150 –250 Hz) frequency (
Ylinen et al.,
1995a
;
Csicsvari et al., 1999
;
Buzsa´ki et al., 2003
;
Buzsa´ki and
Silva, 2012
).
Hippocampal
oscillations occur during active waking and
REM sleep (
Vanderwolf, 1969
;
Buzsa´ki, 2002
). Together with
superimposed
␥
oscillations, they organize the sequential
activa-tion of hippocampal neurons (
O’Keefe and Recce, 1993
;
Skaggs et
al., 1996
;
Harris et al., 2002
). The mechanisms underlying
os-cillations include intrinsic resonance properties of pyramidal
cells (
Leung and Yu, 1998
;
Hu et al., 2002
), selective activation of
interneurons (
Chapman and Lacaille, 1999
;
Dragoi et al., 1999
),
and cholinergic and GABAergic inputs from the septum (
Stewart
and Fox, 1991
;
Buzsa´ki, 2002
). Consistently, urethane-induced
oscillations are sensitive to the muscarinic acetylcholine receptor
antagonist atropine (
Kramis et al., 1975
;
Buzsa´ki et al., 1986
; but
see
Stewart and Fox, 1989
).
The hippocampus receives multimodal sensory inputs from
the entorhinal cortex. Because of its strong links with the
olfac-tory system, the hippocampal formation has long been regarded
as an olfactory sensory area (
Cajal, 1911
). Indeed, it is involved in
odor discrimination in humans (
Eichenbaum et al., 1983
) and
rodents (
Eichenbaum et al., 1988
,
1989
), as well as in
odor-related associative learning (
Eichenbaum, 1998
;
Alvarez et al.,
2002
). Anatomically, olfactory bulb (OB) neurons project to the
lateral entorhinal cortex in rodents (
Kosel et al., 1981
;
Wouter-lood and Nederlof, 1983
;
Shipley and Adamek, 1984
;
Wouterlood
et al., 1985
;
Kerr et al., 2007
) from where disynaptic and
polysyn-aptic afferents reach the dentate gyrus (DG) (
Wilson and
Stew-ard, 1978
;
Schwerdtfeger et al., 1990
;
Liu and Bilkey, 1997
).
Little is known, however, about the influence of olfactory
in-puts on hippocampal network activity. Based on recordings from
urethane-anesthetized mice, here we demonstrate that nasal
res-piration causes prominent 2– 4 Hz local field potential (LFP)
oscillations in the DG. The unique laminar profile and several
further properties reveal a clear distinction between hippocampal
and respiration-driven oscillations. Unit discharges and
mem-brane potential of hippocampal neurons are entrained by the
Received Dec. 18, 2013; revised March 17, 2014; accepted March 20, 2014.Author contributions: Y.Y., A.D., and J.B. designed research; Y.Y. and M.C. performed research; Y.Y., A.B.L.T., and J.B. analyzed data; Y.Y., A.D., A.B.L.T., and J.B. wrote the paper.
This work was supported by the Deutsche Forschungsgemeinschaft (SFB 636/B06), Bundesministerium fu¨r Bil-dung und Forschung (Bernstein Center for Computational Neurosciences 01GQ1003A and German-Brazil Coopera-tion Grant 01DN12098), and the Brazilian NaCoopera-tional Council of Technological and Scientific Development. We thank Steven E. Fox for his valuable suggestions on an earlier manuscript version, Nadine Zuber and Reinhold Wo-jciechowski for excellent technical support, and Valery I. Kukushka for programming.
The authors declare no competing financial interests. *A.B.L.T. and J.B. contributed equally to this work.
Correspondence should be addressed to Dr. Jurij Brankacˇk, Institute for Physiology and Pathophysiology, Univer-sity Heidelberg, Im Neuenheimer Feld 326, 69120 Heidelberg, Germany. E-mail: [email protected].
DOI:10.1523/JNEUROSCI.5287-13.2014
respiration-driven oscillation, underlining its impact on
hip-pocampal activity patterns. Our results suggest that
respiration-induced oscillations have a role in information processing in
hippocampal networks.
Materials and Methods
In brief, we recorded from the hippocampus of 51 female urethane-anesthetized mice with simultaneous measurement of respiratory activ-ity through a piezoelectric sensor placed below the animal’s chest. Intracellular recordings with simultaneous LFP acquisition were per-formed in 13 animals, three of which were subjected to tail pinching during anesthesia; in the remaining 10, we replaced tail pinching with electric stimulation of the brainstem, targeted at the nucleus pontis oralis (NPO), to induce arousal without diminishing the stability of intracellu-lar recordings. In 27 mice, we implanted NeuroNexus silicon probes with 16 recording sites separated by 100m across the CA1–DG axis. Ana-tomical landmarks were identified by stimulation of the angular bundle (Brankacˇk et al., 1993). Recording sites started at the stratum oriens and reached the ventral blade of the DG. In 6 anesthetized animals, we simul-taneously recorded from the OB. Atropine (50 mg/kg i.p.) was used in eight mice. Six mice were tracheotomized before the recording session. Below we provide further methodological details.
Ethics statement
This study was performed in accordance with guidelines of theEuropean Science Foundation (2001) and the U.S. National Institutes of Health Guide for the Care and Use of Laboratory Animals (Institute of Labora-tory Animal Research, 1996) and has been approved by the Governmen-tal Supervisory Panel on Animal Experiments of Baden Wu¨rttemberg at Karlsruhe (35–9185.81/G-30/08). All efforts were made to minimize an-imal suffering and to reduce the number of anan-imals used. Because of the system-level approach of our study, alternatives toin vivotechniques were not available.
Animal care and housing conditions
Mice (C57BL/6N) were purchased at 28 or 45 d of age from Charles River. Animals were housed in groups of four or five inside a ventilated Scant-ainer (Scanbur BK A/S Denmark) on an inverted 12/12 h light/dark cycle (light on 8:00 P.M.) for a minimum of 2 weeks. Animals had free access to water and food. The animals were killed with an overdose of ketamine-xylazine after the experiment.
Animal preparation
Fifty-one female C57BL/6N mice weighting 20 –30 g (12–16 weeks old) were anesthetized with a mixture of urethane (1.5 g/kg) and ketamine-xylazine (10 mg/kg, 1 mg/kg, i.p.). The level of anesthesia was maintained so that hindlimb pinching produced no reflex movement. Supplemental doses of urethane (0.2 g/kg) were delivered as needed (approximately every 1.5 h). The animals were mounted on a stereotaxic frame (Kopf Instruments), and body temperature was maintained at 38°C. After ex-posure of the skull, holes of 0.5–1.0 mm in diameter were drilled above the dorsal hippocampus and OB according to stereotaxic coordinates (Paxinos and Franklin, 2001). The dura mater was carefully removed and Teflon-insulated platinum electrodes (125m, FHC) were implanted into the OB (4.0 mm AP, 0.8 mm ML, 2.0 mm DV). A pair of 125m tungsten electrodes (MicroProbes) was positioned at the angular bundle (⫺4.2 mm AP, 2.75 mm ML, 1.8 mm DV) for perforant path stimulation (80 –300A) and additionally at the lateral olfactory tract (4.0 mm AP, 0.8 mm ML, 2.5 mm DV). In experiments with intracellular recordings, stimulation of the brainstem NPO (⫺6.2 mm AP, 1.0 mm ML, 4.8 –5.0 mm DV, 8 –30A, 250 Hz for 1 s) was used to replace urethane-induced sleep-like LFP activity by wake-like patterns (Clement et al., 2008). Ex-tracellular field potentials were recorded from the dorsal hippocampus (stereotaxic coordinates relative to bregma:⫺2.0 mm AP, 1.5 mm ML, 2.2–2.5 mm DV for the deepest position) using 16-channel silicone probes (A1⫻16-5 mm-100-177-A16 or A1⫻16-5 mm-100-703-A16, NeuroNexus Technologies). In all animals, respiration was monitored by recording the chest wall movements using a piezoelectric device (EPZ-20MS64, EKULIT) located beneath the animal’s body; in 2 animals, we
compared recordings obtained with the piezoelectric sensor with those of a thermosensor located at the nostrils and found fully coherent estima-tion of respiratory activity by both methods (data not shown). In six mice, tracheotomy was performed under additional local lidocaine anes-thesia. Atropine (50 mg/kg) was applied intraperitoneally in eight mice.
Drug preparation
Urethane, ketamine-xylazine, and atropine were freshly dissolved in iso-tonic (0.9%) NaCl solution. All solutions were heated to 38°C before application.
Electrophysiology
Extracellular signals were filtered (1–500 Hz), amplified (EXT-16DX and/or EXT 10-2F, npi, Tamm), digitized (2 kHz) using the CED 1401 board (CED), and stored for offline analyses with custom-written MATLAB routines (Mathworks). Intracellular recordings of hippocam-pal neurons were obtained with high-impedance quartz-glass micropi-pettes (o.d.1.0/i.d.0.5 mm; impedance: 60 –120M⍀) pulled with the P-2000 puller (Sutter Instruments). Recording electrodes were filled with 1Mpotassium acetate and slowly lowered in 5m steps using the Micro-positioner 2660 (Kopf Instruments). Axoclamp 900A (Molecular De-vices) in current-clamp mode with a bridge circuit was used to amplify intracellular signals. For unit recordings, signals were filtered (0 –10 kHz) and digitized at 20 kHz. All neurons included in this study showed stable membrane potentials below⫺50 mV without holding current and gen-erated action potentials with overshoots. Juxtacellular recordings were performed by using quartz-glass micropipettes with impedance lowered to 10 –20M⍀. DG neurons had mean resting membrane potential of
⫺66.0⫾2.9 mV with an overshoot of 14.9⫾3.2 mV; CA1 neurons had mean resting membrane potential of⫺58.3⫾1.6 mV (significantly de-polarized compared with DG neurons;p⬍0.05,ttest) with an overshoot of 14.9⫾2.5 mV. The intracellularly recorded units in CA1 and DG were most likely principal cells because of the duration of action potentials (⬎1.0 ms), low level of spontaneous activity, and strong frequency ac-commodation to depolarizing square pulses (Ylinen et al., 1995b;Freund and Buzsa´ki, 1996). Extracellularly recorded multiunit activity (MUA) from the 16-channel probes was obtained by high pass filtering (500 Hz). Spike times were defined by setting a threshold above background noise upon visual inspection of individual MUA signals. Because MUA was obtained from single probe contacts, we did not attempt to identify single-unit cell types in these signals.
Data analysis
Data were analyzed offline in MATLAB (Mathworks) using built-in and custom-written routines.
Spectral analysis, cross-correlation, and coherence analysis. Power spec-tral density (PSD) was calculated by means of the Welch periodogram method using thepwelch.mfunction from the Signal Processing Toolbox (50% overlapping 4 s Hamming windows). Time-frequency power de-composition was obtained by means of thespectrogram.mfunction; in
Figures 1and3, we used sliding windows of 4 s and 50 ms time step; in
Figure 5, we used windows of 2 s and 100 ms step. The cross-correlation shown inFigure 6Ewas computed using thexcorr.mfunction, with the “coeff” option to normalize values between⫺1 and 1. Phase coherence was obtained by means of themscohere.mfunction from the Signal Pro-cessing Toolbox, using 4 s windows with 50% overlap.
Spike-field coupling. To assess spike-phase coupling, we first filtered the LFP signal within the frequency range of interest. Filtering was ob-tained through a linear finite impulse response filter by means of the
eegfilt.m function from the EEGLAB toolbox (http://sccn.ucsd. edu/eeglab/). The filter order depends on the low-frequency cutoff and is given by 3 times the ratio of the sampling frequency to the low-frequency cutoff (rounded to the nearest integer toward zero). Theeegfil.mfunction calls thefiltfilt.mroutine, which in turn applies the filter forward and then again backwards to ensure that phase delays introduced by the filter are nullified (Delorme and Makeig, 2004). The phase time series was obtained from the analytical representation of the filtered signal based on the Hilbert transform (hilbert.mfunction). Spike times were then asso-ciated with the corresponding instantaneous phases of the filtered signal, used to compute the spike-phase distribution. Coupling strength was
obtained by the lengthRof the mean vector over all phases projected on the unit circle, that isR⫽兩兩1/N⌺exp(ij)兩兩, wherej,j⫽1:N are the
phases associated with spikes, andiis the imaginary number. The refer-ence signal forused inFigure 6was taken from the fissure, whereas the reference signal for the respiration-induced rhythm was taken from the DG hilus.
Depth profile of, respiration-induced rhythm, and␥oscillations. Peri-ods ofand respiration-driven oscillations evoked by tail pinches or stimulation of the brainstem NPO were visually selected. For isolation of respiration-driven cycles, the signals were filtered between⬃2 and⬃4 Hz (the precise cutoff depended on respiration rate), and between⬃4 and⬃6 Hz forcycles (the precise cutoff depended on the power peak in the PSD). Recordings from the hippocampal fissure served as reference for(Brankacˇk et al., 1993), whereas recordings from the hilus were used as reference for the respiration-induced rhythm (see below for laminar profiles). Peaks of identified cycles ofat the hippocampal fissure or the respiratory oscillations at the hilus served as triggers for averaging the filtered signals across the 16 electrode positions of the silicon probes (n⫽
30 waves). Similarly, peaks of identified␥(30 –100 Hz) cycles were used for average (n⫽50 waves). Voltage profiles as a function of recording depth were computed from the averaged evoked potentials in response to
perforant path stimulation. These signals were subsequently used to es-timate probe location (Brankacˇk et al., 1993) (for an example, seeFig. 8C, top). Granule cell layers were localized by the polarity reversal of per-forant path-evoked potentials. In addition, the hippocampal fissure was identified from the amplitude maximum of, and the CA1 pyramidal cell layer from the 180°phase reversal. The hilus was estimated at the middle between both granule cell layers. Voltage profiles from averaged
and respiration-driven oscillations were used to compute current source density (CSD) as previously described (Brankacˇk et al., 1993). For aver-aging across animals, the depth profiles from different mice were ad-justed according to the current sink in the dorsal blade of dentate molecular layer evoked by perforant path stimulation.
Identification ofand hippocampal respiration-induced rhythm. The main criterion for differentiating hippocampaland respiration-driven oscillation was based on tracking respiration rate. The respiration-driven rhythm was defined as the hippocampal LFP rhythm, which peak fre-quency perfectly matched respiration rate. For most cases except one animal, respiration rate was lower thanfrequency (Fig. 2). Additional features that corroborated the correct division between both rhythms included analysis of depth profiles, atropine sensitivity, and dependence of nasal airflow (see Results).
Power correlations. Band power for(recorded at the fissure) and respiration-induced oscillations (recorded at the hilus) was obtained us-ing 1 s slidus-ing windows with no overlap. The Pearson correlation coeffi-cient was computed for each animal individually. Results are expressed as the mean⫾SEM correlation coefficient across animals, along with the range ofpvalues.
Cross-frequency coupling analysis. The heat maps of averaged ampli-tude of fast oscillations time-locked to the troughs ofor respiration-driven oscillations shown inFigure 11Bwere computed as previously described (Scheffzu¨k et al., 2011). Briefly, we first obtained the time points corresponding to troughs ofor respiration-induced oscilla-tions. We then computed the mean amplitude envelope of filtered LFP signals centered at these time points; this procedure was per-formed for multiple filtered bands of 10 Hz bandwidth, covering 10 –210 Hz with 1 Hz steps. To control for 1/f, amplitude values for each frequency were normalized by the mean amplitude. The trace at the bottom of the heat map is the average unfiltered LFP signal also triggered by the same time points.
Phase-amplitude distribution-like plots for low␥(30 –50 Hz), high
␥(70 –90 Hz), and the whole␥band (30 –100 Hz) shown inFigure 11C,Fwere computed using 20° phase bins as previously described (Tort et al., 2010). In this plot, the mean amplitude in each phase bin is normalized by the sum across bins (so that amplitude values for each animal sum to 1, resembling a probability distribution). This procedure therefore corrects for differences in absolute␥amplitude among animals and allows estimating group results. The phase-amplitude modulation index shown inFigure 11Cwas computed as previously described (Tort et al., 2010); in short, this index measures
how much the empirical phase-amplitude distribution deviates from the uniform distribution, which characterizes absence of coupling. The comodulation map shown inFigure 11Ewas obtained by com-puting the modulation index between multiple band-filtered fre-quency pairs (for review, see Tort et al., 2010); we used 2 Hz bandwidth windows and 0.25 Hz steps for phase frequencies, and 10 Hz windows at 5 Hz steps for amplitude frequencies. For each animal, the “mean␥phase” is defined from the phase-amplitude distribution as the mean phase ofor respiration-induced rhythm weighted by␥
(30 –100 Hz) amplitude. The phase vectors shown inFigure 11F (mid-dle) are unit-length vectors which phase represents the mean␥phase.
Histology
Animals were deeply anesthetized and transcardially perfused with 0.9% physiological saline and 10% formalin. Brains were carefully dissected, and coronal frozen sections were cut (50m), mounted, and stained with cresyl violet. Probe positions were verified by light microscopy.
Statistics
Data are expressed as mean (⫾SEM). For group comparisons of normally distributed data (Kolmogorov–Smirnov test), we usedttest or ANOVA followed by Tukey’s multiple-comparison test. For non-Gaussian distributions, we used Mann–Whitney U test or Friedman test. The statistical significance of spike-phase modulation was as-sessed through the Rayleigh test for uniformity of phase distribution. The mean ␥phase for and respiration-induced oscillations was compared using the Watson–Williams test. We usedp ⬍ 0.05 to denote statistical significance.
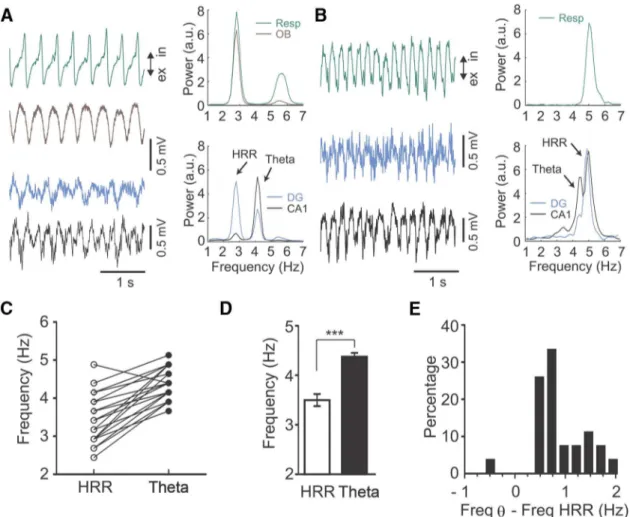
Figure 2. Respiration rate strongly influences the frequency difference betweenand the HRR.A,B, Left panels, Raw traces of LFPs simultaneously recorded from the fissure (black), DG hilus (blue), or OB (brown), along with respiration activity (Resp, green). Respiration rate and HRR are slower thaninA, whereas respiration rate and HHR are faster inB.C, Peak frequencies for HRR and (). HRR is slower than, except in one case (shown inB).D, Mean peak frequency for HRR and(n⫽27; ***p⬍0.0001, pairedttest).E, Distribution of frequency differences between HRR andrecorded simultaneously in, Inspiration; ex, expiration.
Results
Weak arousal elicits two independent rhythms in the
hippocampus of urethane-anesthetized mice
Hippocampal LFPs of urethane-anesthetized rodents resemble
slow-wave sleep activity, which is intermittently replaced by
wake-like activity; this spontaneous alternation of LFP patterns is
similar to the sleep–wake cycle of nonanesthetized animals
(
Clement et al., 2008
). Weak arousal, by
tail pinching or brainstem stimulation,
promptly interrupts urethane-induced
sleep-like activity and evokes wake-like
activity with prominent rhythms between
2 and 6 Hz (
Kramis et al., 1975
). We
con-sistently reproduced this effect in
record-ings from the dorsal hippocampus of
urethane-anesthetized mice (
Fig. 1
A
,
Hi-lus LFP). Surprisingly, however,
time-frequency power analysis of hilar LFPs
after tail pinching revealed two distinct
rhythms between 2 and 6 Hz (
Fig. 1
B
,
C
).
The faster LFP component had relatively
stable peak frequencies of 4 –5 Hz (
Fig.
2
C
,
D
for group means: 4.4 Hz; range 3.7–
5.1 Hz,
n
⫽
27), which corresponds to the
atropine-sensitive
oscillations described
by
Kramis et al. (1975)
. The slower
rhythm showed continuously decreasing
frequencies, starting from
⬃
4.5 Hz and
decaying to
⬃
3.2 Hz within 45 s after tail
pinching (
Fig. 1
B
; see
Fig. 2
D
for group
means: 3.5 Hz; range 2.4 – 4.9 Hz,
n
⫽
27).
Piezoelectrical measurement of thorax
movements revealed that tail pinching
in-duced a similar increase and slow decay of
basal respiration rate (
Fig. 1
B
, bottom
panels). Further analysis showed that
the peak frequency of the slower
arousal-induced LFP rhythm matched
exactly the frequency of respiration
(
Fig. 1
C
). Based on these and other
re-sults shown below, we call the slower
component “hippocampal
respiration-induced rhythm” (HRR) and the faster
component “
oscillations.”
Thus, hippocampal networks express a
slow respiration-coupled field potential
oscillation in addition to
activity upon
tail pinching. Both rhythms were often
observed simultaneously in hippocampal
LFPs but could also occur in isolation (for
an example, see
Fig. 1
B
, between 53 and
57 s). Without monitoring respiration,
identification of the two components was
not possible because of the small
differ-ence in their mean frequencies (1.2
⫾
0.10
Hz,
n
⫽
27) and the possibility that
respi-ration rate could sometimes exceed
fre-quency (
Fig. 2
B
). Indeed, although the
frequency difference between
and HRR
was highly significant (
Fig. 2
D
), its
abso-lute value was
⬍
1 Hz in
⬎
60% of episodes
(
Fig. 2
C
,
E
). Power of
and HRR was not
correlated as revealed from 12 mice where
both oscillations were simultaneously present (mean r:
⫺
0.05
⫾
0.07;
n
⫽
12;
p
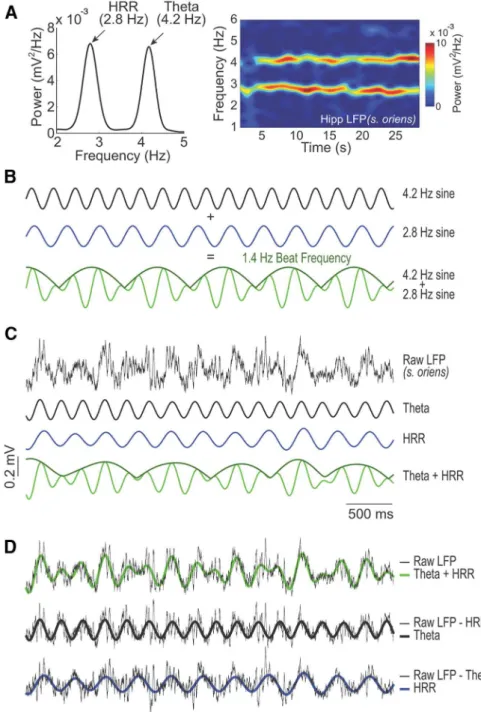
value range: 0.08 to 0.7). Interestingly, in LFP
traces exhibiting concurrent HRR and
oscillations, we could
observe the frequency beating phenomenon, in which the
ampli-tude envelope varied at the same frequency as the frequency
dif-ference between
and HRR (
Fig. 3
); indeed, in the LFP example
shown in
Figure 3
D
(top), the main voltage variations are entirely
Figure 3. LFP signals simultaneous exhibiting HRR andoscillations show frequency beating.A, Power spectrum (left) andaccounted for by the frequency beating. From here on, we focus
our analysis on periods of wake-like LFP activity where the slower
hippocampal oscillations were separated from
oscillations by
⬎
0.4 Hz.
Whereas the slower LFP component in the DG was an
unex-pected finding, parallel field potential recordings from the OB
confirmed the well-known respiration-entrained oscillation in
this brain region (
Adrian, 1950
;
Klingberg and Pickenhain, 1965
;
Fontanini and Bower, 2006
). The hippocampal
respiration-induced rhythm showed strong phase coherence with the slow
OB rhythm, which in turn was highly coherent with respiration
(
Figs. 1
D
and
4
A
). Group means confirmed the strong coherence
between hippocampal respiratory oscillations in CA1 and DG
and both OB activity and respiration itself (
Fig. 4
B
,
C
).
Coher-ence estimates between hippocampal and OB LFPs were clearly
stronger for HRR compared with
both in DG hilus and in CA1
fissure (
Fig. 4
B
;
n
⫽
5;
p
⬍
0.05, paired
t
test). Similarly,
coher-ence between respiration and LFP was larger for HRR than for
in CA1 as well as in DG (
Fig. 4
C
;
n
⫽
10;
p
⬍
0.01, paired
t
test).
Coherence values for HRR and respiration were larger in DG
compared with CA1 (
n
⫽
10;
p
⬍
0.005, paired
t
test).
Hippocampal respiration-induced rhythm and
oscillations
are distinct
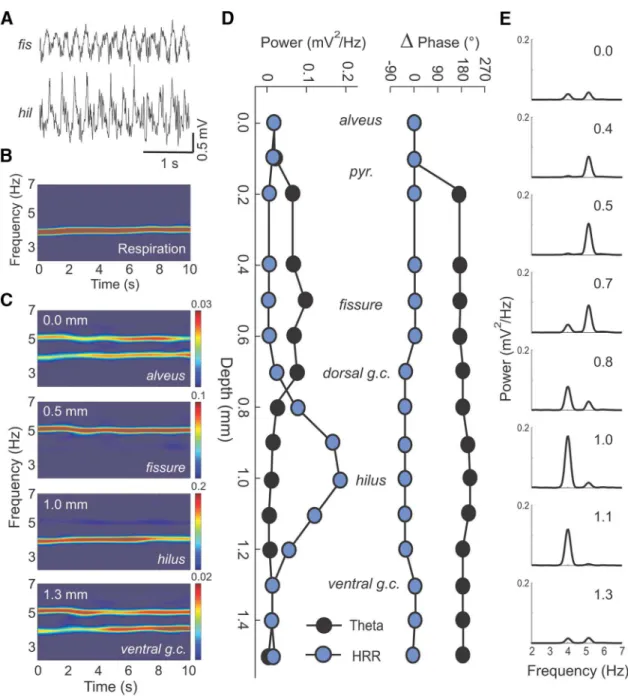
The layered structure of the hippocampus allows mechanistic
inferences from spatial distributions of electrical network activity
called “laminar profiles.” We recorded such depth profiles of
and respiration-induced oscillations across the CA1–DG axis
us-ing 16-channel silicon probes (contact separation: 100
m). A
representative experiment from a urethane-anesthetized mouse
is shown in
Figure 5
. Spectral decomposition of simultaneously
recorded hippocampal LFPs revealed clearly different depth
dis-tributions for the power of
and HRR across the CA1–DG axis
(
Fig. 5
C
,
E
, selected layers;
Fig. 5
D
, left, all recording sites).
Al-though power of both rhythms was low in alveus and the ventral
blade of the dentate (
Fig. 5
C
,
E
, top and bottom), HRR was
max-imal at the hilus and
oscillations peaked at the hippocampal
fissure (
Fig. 5
C
,
E
), in line with previous reports (
Brankacˇk et al.,
1993
). Urethane-induced
oscillations displayed an abrupt
phase reversal of 180° across the CA1 pyramidal cell layer (
Fig.
5
D
, right) as described previously (
Buzsa´ki et al., 1986
;
Brankacˇk
et al., 1993
). In contrast, the phase of HRR exhibited no reversal
at the CA1 pyramidal cell layer but showed a mild phase shift
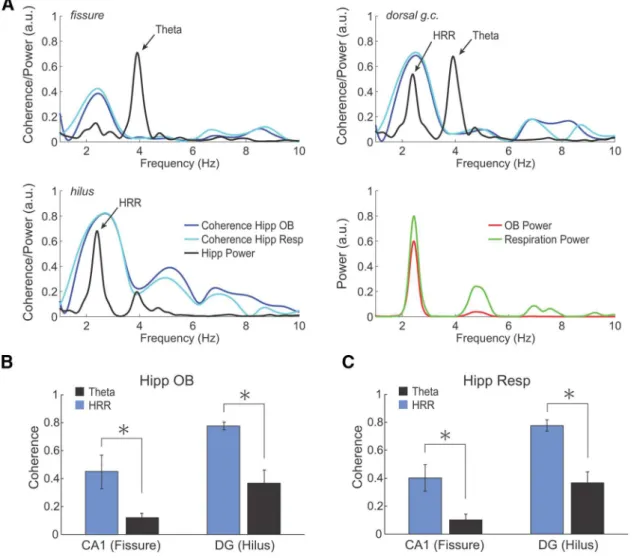
Figure 4. HRR, but not, is coherent with respiration and OB oscillations.A, Representative examples of coherence spectra for hippocampal (Hipp) LFP exhibiting HRR and. Top left panel, PSD for a fissure LFP (black) plotted along its coherence spectrum with OB LFP (dark blue) and respiration activity (Resp, light blue). Top right panel and bottom left panels, Same as before, but for LFPs recorded at the dorsal granule cell layer (g.c.) and at the dentate hilus, respectively. Lower right panel, PSD computed for respiration activity (green) and for the OB LFP (red).B, Mean coherence between hippocampal and OB LFPs. There is higher HRR coherence with OB compared withfor LFPs recorded from both CA1 fissure and DG hilus (n⫽5;p⬍0.05, pairedttest).C, Mean coherence between hippocampal LFPs and respiration activity. There are similar results as before (n⫽10; *p⬍0.01 for CA1 and *p⬍0.001 for DG, pairedttest).between the dorsal and ventral granule cell layers (
Fig. 5
D
, right).
These different and characteristic laminar profiles were
consis-tently found in all animals (
n
⫽
8; for group results and statistics,
see
Fig. 10
) and suggest that different mechanisms underlie
and
respiration-induced oscillations.
Hippocampal neurons are differentially entrained by the
respiration-induced rhythm and
oscillations
Network oscillations are thought to provide a temporal reference
signal for distributed neuronal ensembles. In support, neuronal
discharges are frequently phase-coupled to the underlying
rhythms (
Buzsa´ki, 2002
;
Buzsa´ki and Draguhn, 2004
). We next
investigated whether the respiration-induced oscillations entrain
hippocampal neurons. MUA was recorded from the principal cell
layers of CA1 and DG with 16-channel silicon probes. Spike
probability distributions in both hippocampal subfields were
clearly modulated by both
and HRR (
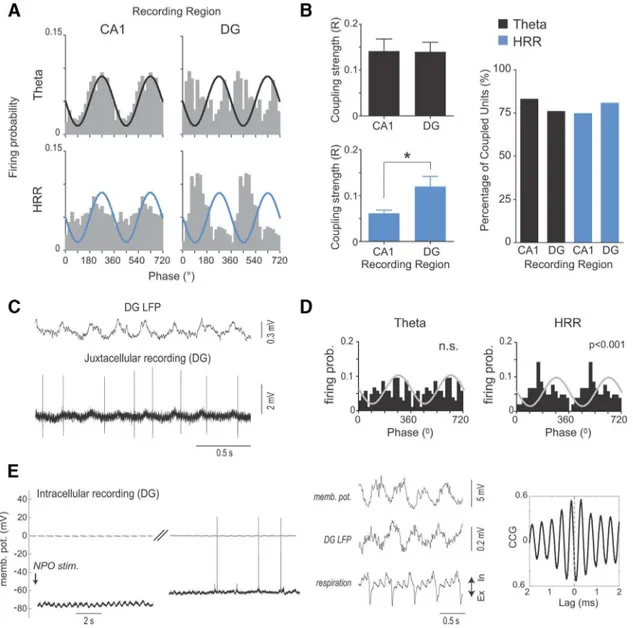
Fig. 6
A
). Quantitative
analysis revealed that the majority of MUA (
⬎
73%) recorded in
CA1 and DG of 12 mice was significantly phase-coupled with
and HRR (
Fig. 6
B
, right panel;
p
⬍
0.05, Rayleigh test). For
oscillations, coupling strength of MUA did not differ between
CA1 and DG (
Fig. 6
B
, left top). In contrast, HRR modulated DG
units stronger than CA1 units (
Fig. 6
B
, left bottom;
p
⬍
0.05,
Mann–Whitney U test). Together, these data show that the
respiration-induced oscillations entrain neuronal discharges in
the hippocampus with strongest influence in DG.
Recordings at cellular resolution revealed that single neurons
in the DG could be selectively entrained by HRR. This is
illus-trated by the juxtacellular recording shown in
Figure 6
C
,
D
, which
shows clear modulation of a DG cell by HRR (
p
⬍
0.001, Rayleigh
test) but no entrainment by
. To study subthreshold effects of
the hippocampal respiration-induced oscillations, we recorded
intracellularly from neurons in the DG and CA1. In these
record-ings, arousal from sleep-like activity was induced by electrical
stim-ulation of the brainstem (see Materials and Methods), as previously
described (
McNaughton et al., 2007
). Recordings from seven
puta-tively principal DG neurons revealed variable effects of brainstem
stimulation (depolarization in 4 neurons, hyperpolarization in 2
cells, and no visible membrane potential change in the remaining
cell). Interestingly, three neurons exhibited subthreshold membrane
potential oscillations after brainstem stimulation (for an example,
see
Fig. 6
E
, left). This oscillation was highly coherent and in
anti-phase with the LFP respiration-induced oscillation (
Fig. 6
E
, middle
and right). In contrast, none of seven putatively principal CA1
neu-rons revealed visible respiratory oscillations at the subthreshold level
upon brainstem stimulation, despite clear shifts of membrane
po-tential in 3 cells (data not shown).
Thus, intracellular recordings suggest a selective subthreshold
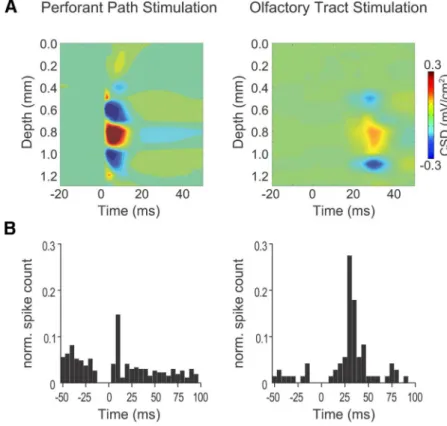
modulation of DG neurons by HRR. Evoked field potential
re-sponses were consistent with these findings: electrical stimulation
of the lateral olfactory tract (LOT) led to current sinks in the
molecular layer of the DG and sources in the granule cell layers
and hilus (
n
⫽
4 mice, see
Fig. 7
A
). This behavior is in line with
synaptic inputs carrying OB information from the lateral
ento-rhinal cortex to the dendrites of DG neurons (
Canning et al.,
2006
). Accordingly, the peak latency of synaptic potentials in DG
Figure 6. HRR modulates DG spiking activity and subthreshold membrane potentials.A, Spike probability distribution as a function of the phase of hippocampal(top; recorded at the fissure) and HRR (bottom; recorded at the hilus) for an example of multiunit activity recorded from the CA1 pyramidal layer (left) and at the DG (right). Oscillation trough and peak corresponds to 90° and 270°, respectively, as indicated by the reference sinusoids.B, Left, Mean modulation strength of CA1 and DG multiunit activity by the hippocampaland HRR. Only significantly modulated spikes were taken into account. There is stronger modulation of DG than CA1 spikes by HRR phase: *p⬍0.05 (Mann–Whitney U test). Right, Percentage of multiunit activity significantly modulated by and HRR in CA1 and DG, as assessed by the Rayleigh test.C,D, LFP and juxtacellular recordings from a single cell in DG (C), along with the cell’s spike distribution over the phases ofand HRR (D). n.s., Not significantE, Left, Intracellular recording of a DG neuron immediately after nucleus pontis oralis (NPO) stimulation (stim.) and after a short period with a diminished arousal level and sleep-like activity (right). Middle, Simultaneous recordings of membrane potential (memb. pot.), DG LFP, and respiration during a time period immediately after NPO stimulation. Right, Cross-correlation (CCG) between membrane potential and DG LFP.was longer for LOT stimulation than for perforant path
stimula-tion (group data: 27.0
⫾
2.9 ms compared with 5.8
⫾
0.1 ms;
p
⬍
0.01, paired
t
test). Similar latencies were found for increased
spike counts after stimulation of LOT or the perforant path (see
Fig. 7
B
). Together, our results show that the hippocampal
respiration-induced oscillations modulate neuronal activity at
both the subthreshold and suprathreshold levels and are most
likely transferred from the OB via the lateral olfactory path and
the lateral entorhinal cortex.
The hippocampal respiration-induced rhythm is resistant
to atropine
Atropine is known to abolish
oscillations in
urethane-anesthetized rodents (
Kramis et al., 1975
). We therefore
investi-gated whether the hippocampal respiration-induced oscillations
share this pharmacological feature. In 4 of 6 animals treated with
atropine (50 mg/kg i.p.), we were able to induce a clear arousal
reaction that was consistently accompanied by HRR. At the same
time,
activity in the hippocampus was disrupted by the
cholin-ergic antagonist (
Fig. 8
A
,
B
). Atropine decreased respiration rate
(
⬃
4 Hz to
⬃
3 Hz), which was exactly followed by HRR frequency
(
Fig. 8
B
). Importantly, HRR amplitude was not changed by
atro-pine, showing its independence of muscarinic receptor
activa-tion, in clear contrast to atropine-sensitive
oscillations.
This result was corroborated by comparing laminar profiles
for both rhythms in the absence and presence of atropine. The
position of 16-channel electrodes along the CA1–DG axis was
confirmed by stimulating the perforant pathway (see Materials
and Methods;
Fig. 8
C
).
oscillations showed the typical phase
reversal across the CA1 pyramidal cell layer and maximal
ampli-tude at the hippocampal fissure (
Fig. 8
D
, top left) (
Brankacˇk et
al., 1993
). Whereas responses to perforant path stimulation were
not changed by atropine (
Fig. 8
C
),
oscil-lations at the fissure were largely
abol-ished (
Fig. 8
D
; for group results, see
Fig.
10
B
: 0.19
⫾
0.03,
n
⫽
8 vs 0.03
⫾
0.01,
n
⫽
4 after atropine;
p
⬍
0.01,
t
test). In strong
contrast, HRR at the hilus was preserved
(and even more pronounced in some
an-imals) after injection of atropine (0.16
⫾
0.03,
n
⫽
8 vs 0.12
⫾
0.03,
n
⫽
4 after
atropine;
p
⫽
0.44,
t
test).
Figure 8
E
shows
the corresponding CSD plots. In
sum-mary, atropine disrupts
-entrained
cur-rent sinks and sources in the CA1 region
but leaves HRR in the DG intact.
Tracheotomy abolishes the
hippocampal respiration-induced
rhythm but not
As stated above, the synchrony between
the slower hippocampal oscillation,
respi-ratory activity, and the OB field potentials
led us to call this network pattern
“hip-pocampal respiration-induced rhythm.”
We hypothesized that there are at least
two possible sources of this oscillation: it
may arise from respiration-coupled nasal
inputs or, alternatively, from activity of
the brainstem respiratory pattern
genera-tor (
Moore et al., 2013
;
Smith et al., 2013
).
To assess the relationship between
respi-ration, nasal input, and the hippocampal
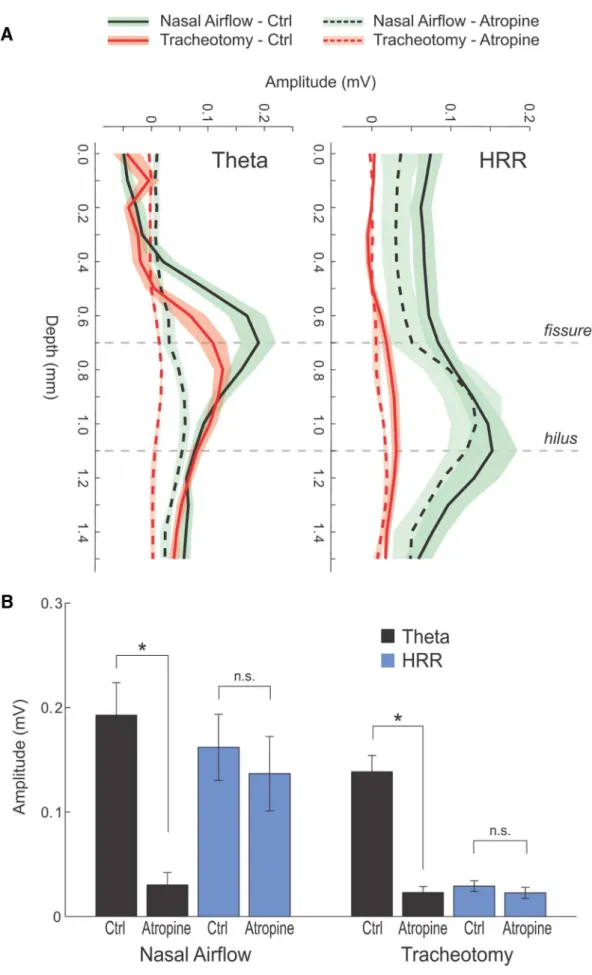
oscillation, we bypassed nasal airflow through tracheotomy (
n
⫽
6 mice;
Fig. 9
). Spontaneous respiration was maintained in these
animals (
Fig. 9
A–C
), indicating that this method distinguishes
between brainstem-driven respiration and inputs induced by
na-sal airflow. Tracheotomy consistently abolished HRR (control
mean amplitude: 0.16
⫾
0.03 mV,
n
⫽
8 vs 0.03
⫾
0.01,
n
⫽
6
after tracheotomy,
p
⬍
0.01,
t
test). In contrast,
oscillations
continued largely unchanged (0.19
⫾
0.03 mV,
n
⫽
8 vs 0.14
⫾
0.02,
n
⫽
6;
p
⫽
0.22,
t
test), although at somewhat slower
fre-quency (
Fig. 9
A
,
B
,
D
; compare with
Figs. 1
C
,
5
E
, and
8
B
). In six
animals, we also recorded LFP from the OB, which were likewise
abolished after bypassing nasal respiration (
Fig. 9
C
; group mean
control: 0.12
⫾
0.03,
n
⫽
6; group mean tracheotomy: 0.01
⫾
0.001,
n
⫽
4;
p
⬍
0.05,
t
test) (
Fontanini et al., 2003
). Similar to
mice with normal nasal airflow, application of atropine suppressed
hippocampal
oscillations in tracheotomized mice (
Fig. 9
A
,
B
,
D
;
tracheotomy: 0.14
⫾
0.02 mV,
n
⫽
5 vs tracheotomy
⫹
atropine:
0.02
⫾
0.01 mV,
n
⫽
4;
p
⬍
0.001,
t
test). Respiration-related
oscil-lations in OB of normally breathing mice are also resistant toward
atropine, similar to HRR (
Fig. 9
C
, bottom left). Thus, the
respiration-induced hippocampal oscillation is clearly driven by
sensory inputs resulting from airflow through the nose.
Figure 10
summarizes the main results of these experiments.
Relationship between hippocampal respiration-induced
rhythm and
␥
oscillations
In addition to the nasal respiration-induced oscillations in the
near-
range, the DG expresses prominent rhythms at
␥
fre-quency (30 –100 Hz) (
Bragin et al., 1995
). Previous studies have
shown that olfactory inputs elicit bursts of
␥
oscillations in
the DG (
Vanderwolf, 1992
,
2001
). Interestingly, we found that
the laminar profile of
␥
oscillations across the CA1–DG axis was
Figure 7. Electrical stimulation of the LOT leads to current sinks in the outer molecular layer of the DG.A, Current source densityvery similar to the laminar profile of HRR, with maxima for both
patterns in the dentate hilus (
Fig. 11
A
).
Nesting of
␥
oscillations within
cycles is a prominent feature
of hippocampal networks (
Chrobak and Buzsa´ki, 1998
;
Tort et
al., 2009
;
Colgin and Moser, 2010
;
Scheffer-Teixeira et al., 2012
;
Lisman and Jensen, 2013
). Does HRR also modulate
␥
oscilla-tions in the hippocampus?
We constructed averaged heat maps of the amplitude of fast
os-cillations (20 –200 Hz) triggered by the troughs of
or HRR (
n
⫽
11;
Fig. 11
B
, left). We found that
␥
amplitude was modulated by the
phase of both slow oscillations. However, the frequency range of
␥
oscillations modulated by HRR was larger than by
(
Fig. 11
B
). We
further corroborated these results by analyzing phase-amplitude
dis-tributions and computing associated modulation indexes (see
Ma-terial and Methods), which showed that, on the group level,
preferentially modulated low
␥
, whereas HRR modulated the whole
␥
band (
Fig. 11
C
). Interestingly, however, in some animals, HRR
specifically modulated high, but not low,
␥
amplitude (
Fig. 11
D
,
E
).
Of note,
␥
nesting into
or HRR phase was visible in raw and filtered
traces (
Fig. 11
D
). Coupling of the whole
␥
band (30 –100 Hz) by the
HRR occurred at a significantly (
n
⫽
11;
p
⬍
0.001,
Watson–Will-iams test) different phase (mean angle: 259.5°, SD: 25.5°) compared
with
-
␥
coupling (mean angle: 30.2°, SD: 9.6°,
Fig. 11
F
). Thus, the
preferred phase and frequency range of coupled
␥
oscillations are
different between
and HRR.
In all, our results show that
and respiration-induced
oscil-lations have different depth distribution in the hippocampus,
different sensitivity to cholinergic blockers, different dependence
on nasal airflow, and different coupling to
␥
oscillations.
Discussion
Here we reported a new pattern of network oscillations between 2
and 4 Hz in the mouse hippocampus. This slow oscillation
synchro-nizes hippocampal networks with nasal respiration and with
the well-known respiration-entrained field potentials in the OB
(
Adrian, 1942
;
Freeman, 1978
;
Fontanini et al., 2003
). The
respi-ration-induced rhythm modulates subthreshold membrane
oscilla-tions and neuronal discharges in the hippocampus. Importantly,
several lines of evidence show that the hippocampal
respiration-induced rhythm is clearly distinct from
oscillations. Together, our
findings suggest that
and respiration-induced oscillations play
dif-ferent roles in hippocampal information processing.
Respiration-induced rhythms propagate to the
hippocampal formation
Respiration-entrained oscillations in the OB have first been
de-scribed by
Adrian (1942
,
1950
). Consistent with our findings,
previous work demonstrated that OB rhythms disappear after
bypassing nasal airflow through tracheotomy, which shows that
they are generated by peripheral stimuli as opposed to central
Figure 8. Atropine disruptsbut not HRR in the hippocampus.A, Representative traces of respiratory activity (top) and LFP signals simultaneously recorded from the hippocampal fissure (middle) and hilus (bottom) before (left) and after atropine (right).B, Power spectra of the same signals as inA. Dashed lines indicate peak respiration frequency.A,B, Atropine abolishes oscillations at the hippocampal fissure (hf) and preserves HRR at the hilus.C, Voltage changes across the CA1– dentate axis upon perforant path (PP) stimulation (Stim.) showing similar profile under control conditions (top) and after atropine (bottom). These responses were used to assess probe location and identify the anatomical landmarks.D,E, Voltage depth profile (D) and current source density (E) analysis ofand HRR before (top) and after atropine (bottom). pc, Pyramidal cell; gc, granule cell.respiratory networks (
Fontanini et al., 2003
). Further studies
sug-gested that the relevant stimulus for slow OB oscillations is nasal
airflow rather than specific odor stimuli: indeed, olfactory
sen-sory neurons do react to mechanical stimulation by odorless
air-flow (
Grosmaitre et al., 2007
). The resulting network oscillation
in the OB propagates to closely related areas, such as the piriform
(olfactory) cortex where it induces rhythmic activity in LFP and
intracellular potentials (
Fontanini et al., 2003
;
Wesson et al.,
2011
). The present work shows a new long-range effect of
respi-ratory oscillations: the generation of prominent network
oscilla-tions in hippocampal networks. It is thus likely that these
oscillations contribute to polymodal sensory integration in this
area.
Hippocampal respiration-induced rhythm and
oscillations
are distinct despite overlapping frequency ranges
The frequency of hippocampal respiration-induced oscillations
in mice is close to the lower frequency boundary of
oscillations,
which may impede their unambiguous identification in
record-ings of spontaneous field potential activity. Basal respiration
fre-quency differs strongly between species: rats, for example, have
basal respiration rates of
⬃
1 to 1.5 Hz at rest (
Crosfill and
Wid-dicombe, 1961
;
Carnevali et al., 2013
). Respiration-driven
rhythms in these animals, as present in the olfactory system, must
therefore be distinguished from slow oscillations known as “up
and down-states” (
Steriade et al., 1993
;
Fontanini et al., 2003
).
Urethane-anesthetized mice breathe at 2– 4 Hz (
Crosfill and
Widdicombe, 1961
;
Depuy et al., 2011
), whereas
oscillations in
urethane-anesthetized rodents are centered
⬃
4 – 6 Hz (
Kramis et
al., 1975
). In our study, the frequency distribution of
respiration-induced oscillations exhibited an overlap with the lower end of
the
frequency range (
Fig. 2
). This similarity has already been
noted for olfaction-related rhythms within the OB, which has
been termed “olfactory
” (
Margrie and Schaefer, 2003
; for
re-view, see
Kay et al., 2009
). However, despite the overlapping
frequency ranges, our results argue against any mechanistic
sim-ilarity between both rhythms: (1) the 2– 4 Hz basal
respiration-induced rhythm depends on nasal airflow, whereas
oscillations
do not; (2) the respiration-induced rhythm is not suppressed by
atropine, in contrast to urethane-induced
(
Kramis et al., 1975
;
Buzsa´ki et al., 1986
); (3) both oscillations have clearly different
laminar profiles across the CA1–DG axis; (4) neurons in DG are
differentially entrained by both rhythms; (5) both rhythms
dif-ferentially modulate
␥
oscillations; and (6) there is no correlation
between the power of both rhythms. We therefore conclude that
hippocampal respiration-induced oscillations represent a unique
network pattern.
al., 1995a
;
Buzsa´ki, 2002
). In our recordings,
oscillations
re-versed across the pyramidal cell layer and reached maximal
power at the hippocampal fissure (
Bland and Whishaw, 1976
;
Buzsa´ki et al., 1986
;
Brankacˇk et al., 1993
). The underlying
cur-rent sinks and sources (
Nicholson and Freeman, 1975
;
Mitzdorf,
1985
) were mainly restricted to the CA1 region and the
hip-pocampal fissure, consistent with previous findings (
Buzsa´ki et
al., 1986
;
Brankacˇk et al., 1993
). Slow respiration-driven
oscilla-tions showed a strikingly different distribution: the amplitude did
not reverse polarity across the pyramidal cell layer but gradually
increased with increasing depth, reaching maximal value at the
hilus. The corresponding current source density analysis showed
pronounced sinks covering the entire molecular layers of the DG,
as well as sources within the granule cell layers. These distinct
profiles show that
and respiration-driven oscillations are driven
by different synaptic inputs.
Notably, stimulation of the perforant path activated similar
sinks in the molecular layer as the respiration-driven oscillation
(
Fig. 8
). This similarity indicates a role for excitatory inputs from
layer II of the entorhinal cortex to the molecular layer of the DG
(
Steward and Scoville, 1976
;
Witter and Groenewegen, 1984
).
Indeed, the lateral entorhinal cortex receives strong synaptic
in-put from olfactory networks, constituting a direct link to the
hippocampal formation. A monosynaptic input to the entorhinal
cortex comes from mitral cells of the OB via the LOT (
Haberly
and Price, 1977
;
Kosel et al., 1981
;
Wouterlood and Nederlof,
1983
;
Schwerdtfeger et al., 1990
), and an additional, disynaptic
input connects the OB via the piriform cortex to the same
neu-rons (
Witter et al., 1989
;
Burwell and Amaral, 1998
). In our
ex-periments, stimulation of the LOT induced a laminar profile
consistent with the lateral entorhinal input (compare left and
right panels in
Fig. 7
A
), and strongly similar to the hippocampal
induced rhythm. It is thus likely that
respiration-driven oscillations in the hippocampus are generated by synaptic
inputs from the OB or piriform cortex via the lateral entorhinal
cortex (
Witter and Groenewegen, 1984
;
Canning et al., 2006
). In
agreement with this, DG neurons exhibited stronger
phase-coupling to respiration-induced oscillations than CA1 neurons.
Functional considerations
What are the possible functions of the respiration-induced
rhythm in the hippocampal formation? The hippocampus
re-ceives polymodal sensory inputs from the entorhinal cortex
(
Brankacˇk and Buzsa´ki, 1986
). Mice and other rodents are
strongly dependent on olfactory cues, and neurons in the lateral
entorhinal cortex respond to odor stimuli (
Xu and Wilson,
2012
). Numerous studies have shown that the flow of olfactory
information along the entorhinal–DG pathway is important for
olfactory learning and memory formation (
Staubli et al., 1984
,
1986
;
Otto and Eichenbaum, 1992
;
Kaut et al., 2003
;
Martin et al.,
2006
). Our results suggest that slow, respiration-entrained
neu-ronal oscillations play a role in the transfer of olfactory
informa-tion to the hippocampus.
Despite the well-known anatomical connections, little is still
known about the impact of olfactory inputs on hippocampal
network activity. The OB also produces pronounced fast network
oscillations, including

and
␥
frequencies (
Bressler and
Free-man, 1980
;
Kay et al., 2009
). Interestingly, olfactory stimuli
in-duce bursts of 15– 80 Hz waves in the DG hilus, but not in CA1
(
Vanderwolf, 1992
;
Vanderwolf, 2001
). This topology
corre-sponds to the laminar profile of the slow hippocampal
respi-ration-induced oscillations described here (
Fig. 11
A
). Slower
oscillatory patterns have also been reported for the OB during
both basal respiration and sniffing (
Kay, 2005
; see also
Fujisawa
and Buzsa´ki, 2011
). Interestingly, previous studies involving
sniffing-related cognitive tasks reported transient synchrony
be-tween hippocampal
oscillations and the OB rhythm, as well as
synchrony with sniffing activity (
Macrides, 1975
;
Macrides et al.,
1982
;
Eichenbaum et al., 1987
;
Vanderwolf, 1992
;
Kay, 2005
).
Our present results suggest that sniffing rather synchronizes
dis-tant cortical regions by a distinct oscillation pattern than
.
How-ever, the distinction between
and respiration-induced
oscillations may be even more difficult in nonanesthetized mice
during sniffing behavior where olfactory rhythms in the OB can
reach up to 12 Hz (
Kay et al., 2009
). Our experiments, in contrast,
have been conducted in anesthetized mice breathing at
⬃
2– 4 Hz
during rest (
Depuy et al., 2011
), which allowed for a clear
sepa-ration between respisepa-ration-induced oscillations and
.
In conclusion, we report an independent type of slow (2– 4 Hz)
respiration-induced hippocampal network oscillations in mice. The
pattern is highly coherent with the basal respiration-induced rhythm
in the OB, and is likely to propagate from olfactory networks via the
lateral entorhinal cortex to the dentate area, where it modulates
neu-ronal activity. We hypothesize that the hippocampal
respiration-induced oscillations contribute to odor information processing in
the entorhinal– hippocampal network.
References
Adrian ED (1942) Olfactory reactions in the brain of the hedgehog. J Physiol 100:459 – 473.Medline
Adrian ED (1950) The electrical activity of the mammalian olfactory bulb. Electroencephalogr Clin Neurophysiol 2:377–388.CrossRef Medline
Alvarez P, Wendelken L, Eichenbaum H (2002) Hippocampal formation lesions impair performance in an odor-odor association task indepen-dently of spatial context. Neurobiol Learn Mem 78:470 – 476.CrossRef Medline
Bland BH, Whishaw IQ (1976) Generators and topography of hippocampal
(RSA) in the anaesthetized and freely moving rat. Brain Res 118:259 – 280.CrossRef Medline
Bragin A, Jando´ G, Na´dasdy Z, Hetke J, Wise K, Buzsa´ki G (1995) ␥(40 –100 Hz) oscillation in the hippocampus of the behaving rat. J Neurosci 15:47– 60.Medline
Brankacˇk J, Buzsa´ki G (1986) Hippocampal responses evoked by tooth pulp and acoustic stimulation: depth profiles and effect of behavior. Brain Res 378:303–314.CrossRef Medline
Brankacˇk J, Stewart M, Fox SE (1993) Current source density analysis of the hippocampalrhythm: associated sustained potentials and candidate synaptic generators. Brain Res 615:310 –327.CrossRef Medline
Bressler SL, Freeman WJ (1980) Frequency analysis of olfactory system EEG in cat, rabbit, and rat. Electroencephalogr Clin Neurophysiol 50:19 –24.
CrossRef Medline
Burwell RD, Amaral DG (1998) Cortical afferents of the perirhinal, postrhi-nal, and entorhinal cortices of the rat. J Comp Neurol 398:179 –205.
CrossRef Medline
Buzsa´ki G (1986) Hippocampal sharp waves: their origin and significance. Brain Res 398:242–252.CrossRef Medline
4
(Figure legend continued.) LG or HG amplitude.-HG coupling strength was significantly lower than-LG, HRR-LG, and HRR-HG coupling: *p⬍0.005 (Friedman test).D, Representa-tive raw LFP trace plotted along with-, HRR-, LG-, and HG-filtered signals, as labeled. There are prominent variations in the amplitude of LG and HG depending on the instantaneous phase of the slower rhythms. The HG-filtered trace was magnified by a factor of 2 for better visualization. E, Comodulation map for the example shown inD. There is prominent HRR-HG coupling along with-LG coupling.F, Left, Mean␥(30 –100 Hz) amplitude according to the phase of(black) and HRR (blue).␥coupling occurs at different phases ofand HRR. Middle, Distributions of the mean phase of maximal␥amplitude. Top panel, Individual samples (n⫽11). Bottom two panels, Circular histograms. Right, Same data points as in middle top panel plotted side by side (n⫽11;p⬍0.001, Watson–Williams test).
Buzsa´ki G (2002) oscillations in the hippocampus. Neuron 33:325–340.
CrossRef Medline
Buzsa´ki G, Draguhn A (2004) Neuronal oscillations in cortical networks. Science 304:1926 –1929.CrossRef Medline
Buzsa´ki G, Moser EI (2013) Memory, navigation and rhythm in the hippocampal-entorhinal system. Nat Neurosci 16:130 –138.CrossRef Medline
Buzsa´ki G, Silva FL (2012) High frequency oscillations in the intact brain. Prog Neurobiol 98:241–249.CrossRef Medline
Buzsa´ki G, Czopf J, Konda´kor I, Ke´llenyi L (1986) Laminar distribution of hippocampal rhythmic slow activity (RSA) in the behaving rat: current-source density analysis, effects of urethane and atropine. Brain Res 365: 125–137.CrossRef Medline
Buzsa´ki G, Buhl DL, Harris KD, Csicsvari J, Cze´h B, Morozov A (2003) Hippocampal network patterns of activity in the mouse. Neuroscience 116:201–211.CrossRef Medline
Cajal SR (1911) Histologie du systeme nerveux de l’homme et des verte´bres T.2. Paris: A. Maloine.
Canning KJ, Wu K, Peloquin P, Klosterman F, Leung LS (2006) Physiology of the entorhinal and perirhinal projections to the hippocampus studied by current source density analysis. Ann N Y Acad Sci 911:55–72.CrossRef Medline
Carnevali L, Sgoifo A, Trombini M, Landgraf R, Neumann ID, Nalivaiko E (2013) Different patterns of respiration in rat lines selectively bred for high and low anxiety. PLoS One 8:e64519.CrossRef Medline
Chapman CA, Lacaille JC (1999) Cholinergic induction of-frequency os-cillations in hippocampal inhibitory interneurons and pacing of pyrami-dal cell firing. J Neurosci 19:8637– 8645.Medline
Chrobak JJ, Buzsa´ki G (1998) ␥oscillations in the entorhinal cortex of the freely behaving rat. J Neurosci 18:388 –398.Medline
Clement EA, Richard A, Thwaites M, Ailon J, Peters S, Dickson CT (2008) Cyclic and sleep-like spontaneous alternations of brain state under ure-thane anaesthesia. PLoS One 3:e2004.CrossRef Medline
Colgin LL, Moser EI (2010)␥oscillations in the hippocampus. Physiology 25:319 –329.CrossRef Medline
Crosfill ML, Widdicombe JG (1961) Physical characteristics of the chest and lungs and the work of breathing in different mammalian species. J Physiol 158:1–14.Medline
Csicsvari J, Hirase H, Czurko´ A, Mamiya A, Buzsa´ki G (1999) Fast network oscillations in the hippocampal CA1 region of the behaving rat. J Neurosci 19:RC20.Medline
Delorme A, Makeig S (2004) EEGLAB: an open source toolbox for analysis of single-trial EEG dynamics including independent component analysis. J Neurosci Methods 134:9 –21.CrossRef Medline
Depuy SD, Kanbar R, Coates MB, Stornetta RL, Guyenet PG (2011) Control of breathing by raphe obscurus serotonergic neurons in mice. J Neurosci 31:1981–1990.CrossRef Medline
Dragoi G, Carpi D, Recce M, Csicsvari J, Buzsa´ki G (1999) Interactions between hippocampus and medial septum during sharp waves and
oscillation in the behaving rat. J Neurosci 19:6191– 6199.Medline
Eichenbaum H (1999) Using olfaction to study memory. Ann N Y Acad Sci 855:857– 869.CrossRef Medline
Eichenbaum H, Morton TH, Potter H, Corkin S (1983) Selective olfactory deficits in case H.M. Brain 106:459 – 472.CrossRef Medline
Eichenbaum H, Kuperstein M, Fagan A, Nagode J (1987) Cue-sampling and goal-approach correlates of hippocampal unit activity in rats performing an odor-discrimination task. J Neurosci 7:716 –732.Medline
Eichenbaum H, Fagan A, Mathews P, Cohen NJ (1988) Hippocampal sys-tem dysfunction and odor discrimination learning in rats: impairment or facilitation depending on representational demands. Behav Neurosci 102: 331–339.CrossRef Medline
Eichenbaum H, Mathews P, Cohen NJ (1989) Further studies of hippocam-pal representation during odor discrimination learning. Behav Neurosci 103:1207–1216.CrossRef Medline
European Science Foundation (2001) Use of animals in research. In: Euro-pean Science Foundation Policy Briefings, Ed 2. Strasbourg: EuroEuro-pean Science Foundation.
Fontanini A, Bower JM (2006) Slow-waves in the olfactory system: an olfac-tory perspective on cortical rhythms. Trends Neurosci 29:429 – 437.
CrossRef Medline
Fontanini A, Spano P, Bower JM (2003) Ketamine-xylazine-induced slow
(⬍1.5 Hz) oscillations in the rat piriform (olfactory) cortex are function-ally correlated with respiration. J Neurosci 23:7993– 8001.Medline
Freeman WJ (1978) Spatial properties of an EEG event in the olfactory bulb and cortex. Electroencephalogr Clin Neurophysiol 44:586 – 605.CrossRef Medline
Freund TF, Buzsa´ki G (1996) Interneurons of the hippocampus. Hip-pocampus 6:347– 470.Medline
Fujisawa S, Buzsa´ki G (2011) A 4 Hz oscillation adaptively synchronized prefrontal, VTA, and hippocampal activities. Neuron 72:153–165.
CrossRef Medline
Girardeau G, Benchenane K, Wiener SI, Buzsa´ki G, Zugaro MB (2009) Se-lective supression of hippocampal ripples impairs spatial memory. Nat Neurosci 12:1222–1223.CrossRef Medline
Grosmaitre X, Santarelli LC, Tan J, Luo M, Ma M (2007) Dual functions of mammalian olfactory sensory neurons as odor detectors and mechanical sensors. Nat Neurosci 10:348 –354.CrossRef Medline
Haberly LB, Price JL (1977) The axonal projection patterns of the mitral and tufted cells of the olfactory bulb in the rat. Brain Res 129:152–157.
CrossRef Medline
Harris KD, Henze DA, Hirase H, Leinekugel X, Dragoi G, Czurko´ A, Buzsa´ki G (2002) Spike train dynamics predicts-related phase precession in hippocampal pyramidal cells. Nature 417:738 –741.CrossRef Medline
Hu H, Vervaeke K, Storm JF (2002) Two forms of electrical resonance at
frequencies, generated by M-current, h-current and persistent Na⫹
cur-rent in rat hippocampal cells. J Physiol 545:783– 805.CrossRef Medline
Institute of Laboratory Animal Research (1996) Guide for the care and use of laboratory animals. Washington, DC: National Academies, Commis-sion on Life Sciences, National Research Council.
Kaut KP, Bunsey MD, Riccio DC (2003) Olfactory learning and memory impairment following lesions to the hippocampus and perirhinal– ento-rhinal cortex. Behav Neurosci 117:304 –319.CrossRef Medline
Kay LM (2005)oscillations and sensorimotor performance. Proc Natl Acad Sci U S A 102:8386 – 8391.CrossRef Medline
Kay LM, Beshel J, Brea J, Martin C, Rojas-Líbano D, Kopell N (2009) Olfac-tory oscillations: the what, how and what for. Trends Neurosci 32:207– 214.CrossRef Medline
Kerr KM, Agster KL, Furtak SC, Burwell RD (2007) Functional neuroanat-omy of the parahippocampal region: the lateral and medial entorhinal areas. Hippocampus 17:697–708.CrossRef Medline
Klingberg F, Pickenhain L (1965) U¨ ber langsame atemsynchrone Potentiale vom Bulbus olfactorius der Ratte. Acta Biol Med Ger 14:749 –763.
Medline
Kosel KC, Van Hoesen GW, West JR (1981) Olfactory bulb projections to the parahippocampal area of the rat. J Comp Neurol 198:467– 482.
CrossRef Medline
Kramis R, Vanderwolf CH, Bland BH (1975) Two types of hippocampal rhythmical slow activity in both the rabbit and the rat: relations to behav-ior and effects of atropine, diethyl ether, urethane, and pentobarbital. Exp Neurol 49:58 – 85.CrossRef Medline
Leung LS, Yu HW (1998) -frequency resonance in hippocampal CA1 neu-rons in vitro demonstrated by sinusoidal current injection. J Neuro-physiol 79:1592–1596.Medline
Lisman JE, Jensen O (2013) The-␥neural code. Neuron 77:1002–1016.
CrossRef Medline
Liu P, Bilkey DK (1997) Parallel involvement of perirhinal and lateral ento-rhinal cortex in the polysynaptic activation of hippocampus by olfactory inputs. Hippocampus 7:296 –306.CrossRef Medline
Macrides F (1975) Temporal relationships between hippocampal slow waves and exploratory sniffing in hamsters. Behav Biol 14:295–308.
CrossRef Medline
Macrides F, Eichenbaum HB, Forbes WB (1982) Temporal relationship be-tween sniffing and the limbicrhythm during odor discrimination rever-sal learning. J Neurosci 2:1706 –1717.Medline
Margrie TW, Schaefer AT (2003)oscillation coupled spike latencies yield computational vigour in a mammalian sensory system. J Physiol 546:363– 374.CrossRef Medline
Martin C, Gervais R, Messaoudi B, Ravel N (2006) Learning-induced oscil-latory activities correlated to odour recognition: a network activity. Eur J Neurosci 23:1801–1810.CrossRef Medline