Analysis of Single Locus Trajectories for
Extracting In Vivo Chromatin Tethering
Interactions
Assaf Amitai1, Mathias Toulouze2, Karine Dubrana2, David Holcman3*
1Institute for Medical Engineering & Science, The Massachusetts Institute of Technology (MIT), Cambridge, Massachusetts, United States of America,2Laboratory of genetic instability and nuclear organization, CEA, Fontenay-aux-Roses, France,3IBENS, Ecole Normale Supérieure, Paris, France and Mathematical Institute, University of Oxford, Oxford, United Kingdom
Abstract
Is it possible to extract tethering forces applied on chromatin from the statistics of a single locus trajectories imagedin vivo? Chromatin fragments interact with many partners such as the nuclear membrane, other chromosomes or nuclear bodies, but the resulting forces can-not be directly measured in vivo. However, they impact chromatin dynamics and should be reflected in particular in the motion of a single locus. We present here a method based on polymer models and statistics of single trajectories to extract the force characteristics and in particular when they are generated by the gradient of a quadratic potential well. Using numerical simulations of a Rouse polymer and live cell imaging of the MAT-locus located on the yeastSaccharomyces cerevisiaechromosome III, we recover the amplitude and the dis-tance between the observed and the interacting monomer. To conclude, the confined trajec-tories we observedin vivoreflect local interaction on chromatin.
Author Summary
Is it possible to recover the local environment, the external and internal forces acting on a polymer from a single locus trajectories? To study this question, we resolve this reverse cell biology problem by developing a method that usesin vivolive single locus trajectories to extract physical forces applied on chromatin. We applied the method to the statistics of theS. cerevisiaeMAT-locus motion and recover tethering forces acting on the chromatin. The local confinement of a chromatin locus can either be due to crowding or to local inter-actions with partners such as the surface of the nuclear membrane, other chromosomes or nuclear bodies that cannot be directly measured. We conclude here that confined trajecto-ries of a single chromatin locus can be generated by local tethering interactions. This approach is applicable to cells under various conditions, such as during double-stranded DNA break repair.
OPEN ACCESS
Citation:Amitai A, Toulouze M, Dubrana K, Holcman D (2015) Analysis of Single Locus Trajectories for Extracting In Vivo Chromatin Tethering Interactions. PLoS Comput Biol 11(8): e1004433. doi:10.1371/ journal.pcbi.1004433
Editor:Alexandre V Morozov, Rutgers University, UNITED STATES
Received:February 28, 2015
Accepted:July 6, 2015
Published:August 28, 2015
Copyright:© 2015 Amitai et al. This is an open access article distributed under the terms of the
Creative Commons Attribution License, which permits unrestricted use, distribution, and reproduction in any medium, provided the original author and source are credited.
Data Availability Statement:All relevant data are within the paper and its Supporting Information files.
Funding:The authors received no specific funding for this work.
Introduction
What can we learn about the local environment, the external and internal forces and the chro-matin itself from the motion of a chrochro-matin locus? This motion can be driven by local diffusion and/or forces between monomers of the model polymer [1–3]. Monomers motion is highly correlated due the polymer hierarchy of relaxation times [4,5], leading in particular to anoma-lous diffusion [6,7]. This anomalous behavior is well documented for chromatin loci [8–10] and we propose here to examine the effect of local external interactions on a locus motion. Much of the chromatin dynamics is reflected in the motion of a single chromosomal locus and conversely, a locus motion allows probing the chromatin dynamics [11,12] at tens of nanome-ters and millisecond scales resolution [13–15]. When this motion is described as a free or con-fined Brownian motion, classical statistical tools such as the mean square displacement (MSD) and radius of confinement [16–18] can be used to extract the values of physical parameters. Other methods have been developed to extract kinetic rates about molecular events from forces imposed in pulling experiments [19,20] or in the context of atomic force microscopy [21,22].
Polymer models can account for various forces acting on chromatin, such as bending elas-ticity, internal rigidity, torsion and Lennard-Jones interactions [2]. In addition, the chromatin fiber can experience local fluctuations driven by ATP [23,24], identified by micrometer long-range coherent [25] and active motion [26]. Other interactions can be due to repulsive forces or self-avoiding interactions with other chromatin parts, attractive forces driven by anchoring a locus at a nuclear pore [27] or tethering to the spindle pole body through the centromere [28] or with other chromosomes mediated by protein-protein interactions. While these interactions are local and extend to tens or hundreds nanometers, they can influence the polymer dynamics and in particular on this polymer, even if positioned far away from the interacting site (Fig 1a). We present here a method based on polymer models and statistical analysis of single particle trajectories, to estimate the local interactions acting on chromatin (Fig 2a). A sufficiently large ensemble of single tagged locus trajectories is the key ingredient of the method. When applied forces are stationary over the time course of the trajectory recording, we extract interactions or their mirror deterministic forces by deriving formulas that link the empirical velocity distribu-tion of a locus to forces applied to a distant single monomer. The present method allows distinguishing external forces applied on a single monomer from intrinsic forces acting on monomers. The principle and the difficulty of the method can be understood as follows: for a single stochastic particle modeled by the Smoluchowski’s limit of the Langevin equation, the velocity of the particlevis proportional to a forcefapplied on the particle plus an additional white noise, summarized as
gv¼fþg ffiffiffiffiffiffi
2D p
_
w; ð1Þ
whereγis the friction coefficient,Dthe diffusion coefficient andwis the normalized Wiener process. Thus by averaging over the ensemble of velocity realizations, it is possible to recover thefirst moment, which is the forcefield [29]. However, for a polymer chain, there are internal forces between monomers and thus, the difficulty that needs to be resolved here, as the data are measured at a single monomer, is to separate the internal forces acting on the measured mono-mer from the external ones acting on a monomono-mer further away. This problem is resolved here, but the inversion formula to recover the force depends on the polymer model. When the exter-nal applied force is the gradient of a quadratic potential (second inversion formula) we explicit the formula analytically and show that the motion of the observed monomer is characterized by an effective force, with an effective elastic spring constantkcthat we compute. We simulate
effective harmonic potential well, but we show that the effective force acting on the observed monomer decays with the distance along the chain between the interacting and the observed monomer. The effective spring constantkcdecays slower with this distance for a general class
of polymers (β–polymer [31]) compared to Rouse. Applying the present approach to live cell-imaging data of the MAT-locus in yeast [32], which appears to be constrained shows that
con-fined trajectories can either be due to local crowding or to direct interactions. Using Single Particle Trajectories (SPTs), we extract forces acting on that locus and show that trajectory localization is mediated by direct forces. This result validates the model predictions and the relation between the strength of a force applied on the chromatin locus and the radius of
con-finement. We conclude that local forces and not only crowding do confine chromatin motion. The present approach can further be applied to other situations, such as yeast telomeres anchored to the nuclear periphery [32], changes in single locus dynamics or repositioning fol-lowing the induction of double-stranded DNA breaks.
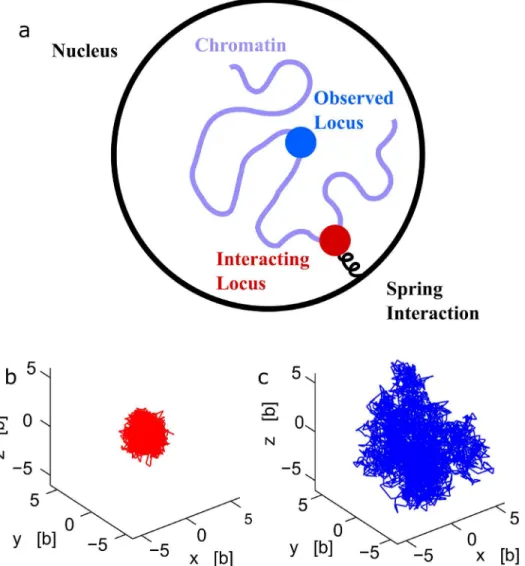
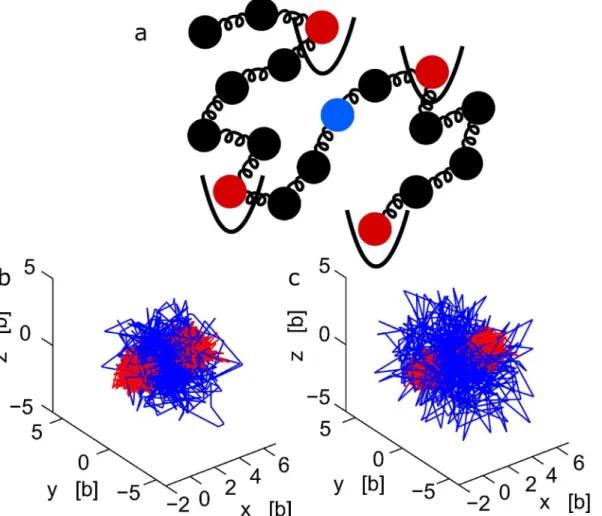
Fig 1. A polymer interacting with multiple potential wells.(a) Schematic representation of a polymer, where some monomers (red) interact with fixed harmonic potential wells, while monomerc(blue) is observed. (b-c) Stochastic trajectories of three monomers, part of a polymer, where the two extremities interact with two potential wells fixed at the origin and at positionμ= (5b, 0, 0) respectively. The middle monomer trajectory (blue) is more extended than the two others, as shown for a polymer of length N = 21 (b) and N = 41 (c).
Results
Polymer framework
When an external force, which is the gradient of the potentialUext(R) is applied to a Rouse
polymer, the interaction is described by the energy
ðRÞ ¼k2X
N
j¼2
ðRj Rj 1Þ 2
þUextð ÞR ; ð2Þ
whereR= (R1,R2,. . .,RN) is the ensemble of monomers, connected by a spring of strengthκ=
dkBT/b2.bis the standard-deviation of the distance between adjacent monomers [4],kBthe
Boltzmann coefficient,Tthe temperature anddthe dimensionality (dim 2 or 3). In the Smolu-chowski’s limit of the Langevin equation [33], the dynamics of monomerRnis described by
dRj
dt ¼ DrRjðRÞ þ ffiffiffiffiffiffi
2D p dwj
dt ; ð3Þ
forj= 1,. . .Nand eachw
jis an independentd-dimensional white noise with mean zero and
Fig 2. Dynamics of interacting versus observed locus.(a) Schematic representation of the nucleus, where one locus is observed and followed with a florescent label while another (non-visible) chromatin locus is interacting with another nuclear element. (b-c) Stochastic trajectories of monomers, part of a polymer (N= 30) where one extremity interacts with a harmonic potential well of strengthκ= 2KBT/b2. When the observed monomer is the interacting
monomer (red), the trajectory is well localized (b). When the middle monomer of the polymer is tracked, the trajectory (blue) is more extended (c).
variance 1,Dis the monomer diffusion coefficient. We will describe specifically thefield ofrRj Uext(R) in the next subsection.
When the chromatin motion is described by Rouse chain, the effective diffusion coefficient can be estimated from data. We shall choose a reference monomerRc, which represents the
tagged locus. One of the key results of the present analysis is the following formula, which links the velocity or first moment of the monomer ofRc(averaged over all realizations) to the
poly-mer configuration distribution: General inversion formula:
lim
Dt!0
EfRcðtþDtÞ RcðtÞ
Dt jRc¼xg ¼ D
Z
O
dR1::
Z
O
dRNðrRcÞPðRjRc ¼xÞ; ð4Þ
whereE{.jR
c=x} denotes ensemble averaging under the condition that the tagged monomer is
at positionRc=x. Formula 4 is generic and does not depend on the particular expression of the
external forces acting on the polymer. Moreover, we do not impose here any restriction on the domainOwhere the polymer evolves. The polymer is reflected on the boundary@O. The con-ditional probabilityP(RjRc=x) is computed from equilibrium probability distribution function
(pdf)P(R1,R2,. . .,RN), which satisfies the Fokker-Planck equation (FPE) in the phase spaceO
× ..OR3N,
0¼DPðRÞ þ r ðrPðRÞÞ; ð5Þ
with boundary condition
@P @niþP
@
@ni¼0for Ri 2@O fori¼1::N;
whereniis the normal vector to the boundary@Oat positionRi.
The external field of forces
−r
U
ext(
R
)
A permanent force located at positionμcan be approximated at order two by a harmonic well.
We suppose that this force is applied to monomern. The force applied onRnis the gradient of
the harmonic potential (Fig 1a)
UextðRnÞ ¼
1
2kðμ RnÞ 2
; ð6Þ
wherekis the force constant. The monomernthat experiences the force is different from the tagged monomercand we shall assume thatn<c. As we shall see now, this potential well affects the dynamics of the entire polymer and specifically the observed locusc.
Extracting an applied force from the ensemble of an observed monomer
To extract the strength of the potential well applied on monomern, from the measured velocity of locusc, we derive an analytical expression for formula 4. First, the force acting on monomer c, when its position isxis given by
Fc
Rc¼x ¼ rRcðRc 1;Rc;Rcþ1ÞRc¼x
¼ kðx Rc 1Þ kðx Rcþ1Þ;
ð7Þ
conditioned onRc=x, that is
PðRjRc¼xÞ ¼Ne ð
R1;:::;Rc 1;x;Rcþ1;::;RNÞ; ð8Þ
where the normalization factor is
N 1 ¼
R
O::
R
O
Q
i6¼c
PðRjRc ¼xÞ: ð9Þ
Finally, computing Gaussian integrals (seeS1 Textfor details) we find that the normaliza-tion factor is (forμ= 0, otherwise we need to replacexbyx−μ),
1
N ¼
ð2pÞN 1k2 N
ðkþ jc njkÞ
3=2
e
x2
ðk2
þðc nþ1ÞkkÞ
2ðkþ ðc nÞkÞ : ð10Þ
Substituting Eqs(7)–(10)intoEq (4), we obtain (S1 Text) an explicit inversion formula for the mean velocity of monomerc.
Second inversion formula:
lim
Dt!0
EfRcðtþDtÞ RcðtÞ
Dt jRcðtÞ ¼xg ¼ Dkcnx;
kcn ¼
kk kþ ðc nÞk:
ð11Þ
Expression 11 is one the key result here: it links the average velocity over empirical trajectories of the observed monomercto a permanent force applied on monomern. The coefficientkcn
depends on the harmonic well strengthk, the inter-monomer spring constantκand is inversely proportional to the distancejn−cjbetween monomersnandcalong the chain. Furthermore,
the steady state varianceRc= limt! 1Rc(t) of the monomer’s position (seeS1 Text) can be
related to the dimension d and the coefficientkcnby
hR2
ci ¼
d kcn
; ð12Þ
whenhRci= 0. Relation 12 is reminiscent of long time asymptotic of classical
Ornstein-Uhlen-beck processes. The dynamics of monomerRcgenerated by Brownian simulations is shown in Fig 2b and 2c. In the limit of largek(pinned monomer), an analogue of formula 12 was used for analyzing chromatin organization [28] and DNA [34]. Inversion formula 1 assumes the Boltzmann distribution for the single monomer and that the entire polymer has reached equi-librium at the time scale of the simulation or the experiment (fromEq 8). Finally, formula 1 reveals how internal and external polymer forces mix together to influence the monomer veloc-ity. It also shows the explicit decay of the force amplitude with the distance between the observed and forced monomer.
Locus dynamics for a polymer constricted by two potential wells
the total potential energy of the Rouse polymer is
UextðRÞ ¼
1
2knðRn μnÞ 2
þ12kmðRm μmÞ
2
; ð13Þ
In that case, the average steady state position of the tagged monomerccan be computed exactly and is given by (seeS1 Textfor details)
hRci ¼
μnknðkþ jm cjkmÞ þμmkmðkþ jc njknÞ
knkmjm nj þ ðknþkmÞk
; n<c<m;
knμnkþkmμmðkþ jm njknÞ
knkmjm nj þkðknþkmÞ
; n<m<c
8
> > > > <
> > > > :
and similarly to the previous inversion formula, we can relate the velocity ofRcto the applied
forces, summarized in this new formula Third inversion formula
lim
Dt!0
EfRcðtþDtÞ RcðtÞ
Dt jx~g ¼ Dkcnmx~; ð14Þ
wherex~¼x hR
ciand
kcnm¼
kcnþkcm; for n<c<m
ð2kþ jm njkÞkk
k2
þ j2c m njkkþ jðm nÞðc mÞjk2; for n<m<c
8
> > > <
> > > :
wherekcnandkcmare given byEq (11)(seeS1 Text). Forn<m<c, in the limitm−n1, we
obtain the limiting formulakcnm*jc−mj−1κ. Thus, the spring coefficient depends on the
dis-tance to the closest anchoring point only. However, whenn<c<m, the effective spring coeffi -cient depends on the distance between the two wells. Finally, the variance of the monomer position with respect to its mean positionEq (14)is given by
hðRc hRciÞ2i ¼ d kcnm
: ð15Þ
The computations are described in theS1 Text. We conclude at this stage that the distance scanned by the tagged monomer is proportional to the distance to the anchoring point (seeFig 1b and 1c). Several interacting forces can certainly be considered, but for a given locus, the two adjacent neighboring interacting monomers are probably enough to characterize the motion, because other forces should be screen by these proximity forces. We shall now extend the inversion formula to other polymer model with a prescribed anomalous exponent.
Inversion formula for polymer models with a prescribed anomalous
exponent
to relate the velocity of a tagged locus to the external force, where the difficulty is to subtract the long-range internal forces between monomers, associated with theβ-polymer to the total force and thus to recover the external forces applied to a different monomer than the one observed.
We recall that for a polymer ofNmonomers, the dynamics of monomercis govern by
Rc¼ac
0u0þ
XN
1
p¼1
ac
pup; ð16Þ
where ac p¼ ffiffiffiffi 1 N r
; p¼0
ffiffiffiffi
2
N
r
cos ðc 1=2Þpp N
; otherwise:
ð17Þ
8 > > > < > > > : and
dup
dt ¼ Dp~kpupþ
ffiffiffiffiffiffi
2D p dw~
p
dt ; ð18Þ
whereD0=D/NandDp=D(p>0),w~pare white noises with mean zero and variance 1, the
coefficients arek~
p¼4ksin pp
2N
b
(2>β>1). At intermediate time, the cross-correlation func-tion of a locus behaves as
hðRcðt0þtÞ Rcðt0ÞÞ
2
i /ta; ð19Þ
witha¼1 1
b[31]. When a gradient force (seeEq (6)) acts on monomerRnof aβ-polymer,
the expectation of the velocity of monomerc(c>n) is: Generalized inversion formula:
lim
Dt!0
EfRcðtþDtÞ RcðtÞ
Dt jRcðtÞ ¼xg ¼ Dkcnðb;N;l;mÞx; ð20Þ
whereμ= 0 and
kcnðb;N;l;mÞ ¼Ac;c
X
l;m6¼c
Al;cAm;c
~ C 1
l;k; ð21Þ
whereC~is a block matrix, thei-th block of which is ~
Ci j;k¼A
i
j;kþkdi;ndj;n; ð22Þ
and [31]
Aj;k ¼
XN
1
p¼0 ~
kpaj pa
k
p: ð23Þ
To conclude, inversion formulaEq 20for aβ-polymer is similar to the one derived for a Rouse polymerEq (11), but the dependency with the parameters is now implicit. Numerical simula-tions of Eqs21–23reveal that the apparent spring constantkcn(β,N,l,m) decays slower with
Recovering a local force acting on a chromatin locus
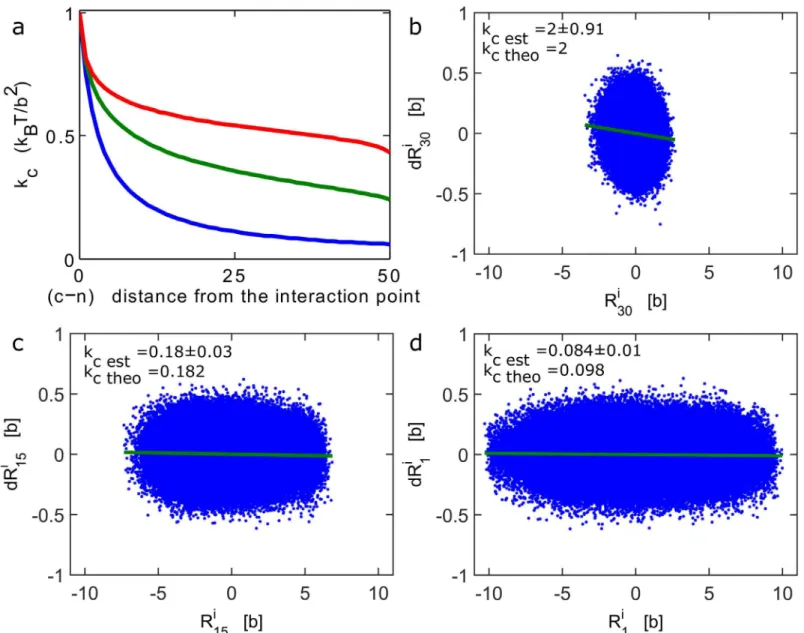
In the previous section, we showed how to extract the local interaction between the underlying polymer and the surrounding environment from the trajectories of an observed locus. When the force is applied far away from the tagged locus, it is possible to recover the strength of the force and the distance where it was applied from the statistics of trajectories. The three inver-sion formulas we derived above can be used for different polymer models. In this section, we apply these formulas to extract parameter from numerical simulations and then we present a Fig 3. Recovering an external force of an interacting polymer.(a)Apparent force acting on a tagged monomer. The apparent spring constantkcis
computed from formula 11 and 20, for a polymer of lengthN= 100, where monomern= 50 interacts with an harmonic potentialEq (6)withk= 2kBT/b2, while
κ= 3kBT/b2. The constantkcis computed for increasing distances |c−n|, between the observed and the interacting monomers forβ= 2 (Rouse polymer)
(blue),β= 1.5 (green) andβ= 1.2 (red). (b-d) Brownian simulations of a Rouse polymer (N= 30), where the first monomer interacts with a harmonic well at the origin (k= 2kBT/b2). A scatter plot (blue asterisk) of the steps distribution (dRi) against the position for the first monomer (b), middle monomer (c) and end
monomer (d). The data clouds are fitted with a linear regression procedure (green line). The apparent spring constantkcSim is empirically estimated from
simulations usingEq (24)and compared with the theoretical valueEq 11(kcn=kκ/(κ+|c-n|k)). We foundkcsim= 2±91, 0.18±0.03, 0.084±0.01 andkcn= 2;
0.182; 0.098 respectively, for b, c, d. In the simulations,Δt= 0.01b2/D.
computational method to recover forces (chromatin interactions) from trajectories of the MAT-locus imaged in living yeast cells.
Empirical estimators to extract from Single particle trajectories, forces acting on a single locus. To extract the empirical effective spring coefficientkcfrom a trajectory given by
Rc(hΔt) (h= 1..Np), whereNpis the number of points, we start by computing the differential
quotient inEq 11. This first step allows extracting the mean position of the locus. Once the steady state is reached, the time average of the locus position is computed from
hRci
1
Np
X
Np
h¼1
RcðhDtÞ:
When the polymer interacts with a single interacting potential, the average positionhRci
esti-mates the location where the force is applied. An upper bound for the number of pointsNpis
of order (τr/Δt), wheretr¼
jc njb
Dkpb is the relaxation time for a portion of the chain betweencand nof aβ-polymer [31].
In the next step, we assume that the diffusion coefficientDhas been estimated, which can be done using second moment estimators [29]. We also consider that the inter-monomer spring constantκis known, which reflects an intrinsic property of the chromatin. To estimate the force from the constantkcninEq 11, we use the linearity of the force with respect to the
position of the locus (seeEq 6). The step size (R(Δt(h+ 1))−R(Δth)) is thus proportional to the
locus position (R(Δt(h+ 1))−hRci) (Fig 3b–3d). In the isotropic case, the apparent force
con-stantkcnacting on monomercis computed from the trajectories ofRc(t)
kc
1
dðNp 1Þ
Xd
i¼1
X
Np 1
h¼1 Ri
cððhþ1ÞDtÞ R i cðhDtÞ
DDtðRi
cðhDtÞ hRiciÞ
; ð24Þ
(dis the dimension andNpis the number of points). To demonstrate the efficiency of inversion
formula 1, we ran stochastic simulations of a Rouse polymer and applied the procedure described above with formula 26 to extract from trajectories the coefficientkcn(Fig 3b–3d). A
potential well is applied on thefirst monomern= 1, and we present three cases where the tagged monomer is thefirst (c= 1), the middle (c=N/2) or the last one (c=N). Using a linear regression, we recover the theoretical apparent force constantkcnin formula (6) from
stochas-tic simulations. Once the parameterkcnis computed, we are left with two unknown parameters:
the spring forcekand the distancejc−nj. For a strong anchoring (kκ), we can approximate
kcκjc−nj−1. In that case, the empirical effective spring constant can be used to estimate the
distance to the interacting monomer.
For a long enough sampled trajectory and a force derived from a stationary potential well, the effective spring coefficient can be recovered directly either from the empirical estimatorEq (24)or by using the reciprocal of the varianceEq (12). However, trajectories are often mea-sured with a small sampling timeΔtallowing probing the fine behavior of the chromatin and recovering accurately the diffusion coefficient. The total length of a trajectory is however lim-ited by photo bleaching effects [35]. Thus, the length of a trajectory may be shorter than the equilibration time scale, and thus acquired before equilibrium is reached. In that case, formula
Eq (24)can still be applied to recover the parameterkc, while formulaEq 12, which implies
equilibrium, cannot be used. The standard error of the mean position iss= ffiffiffiffiffi
Np
p
(where by defi -nitionσ2=hRc−hRci)2i) and the standard error of the variance iss2
ffiffiffiffiffiffiffiffi2
Np 1 q
[36], thus a good
Recovering forces from the auto-correlation function. How is the force applied to a polymer reflected in the auto-correlation functionC(c,t1,t2) =h[Rc(t1)−hRc(t1)i][Rc(t2) −hRc(t2)i]iof the tagged monomerc? We shall demonstrate here that the auto-correlation
function can be used to recover the spring constantk. Indeed, by decomposing the external potentialEq (6)on the basisup, that diagonalizes the Rouse potentialEq (17), we get
UextðRnÞ ¼
1
2k μ
X
N 1p¼0
an pup
2
ð25Þ
and the RouseEq (18)for the polymer are
dup
dt ¼D ka
n pμ ðða
n pÞ
2 kþk~
pÞup
Dkan p
XN
1
q¼0;q6¼p an
quqxþ
ffiffiffiffiffiffi
2D p dw~
p
dt : ð26Þ
forp= 0..N−1. The force applied on monomerncouples the modes dynamics (there are
non-diagonal terms). However, when the strength of the coupling term is relatively weak ðanpÞ2k~k
p, we can neglect the coupling. This will be the case for higher modes given thatk
<κandNlarge. Thus the expansion of the auto-correlation function is
Cðc;t1;t2Þ ¼d ke
Dðan0Þ 2
kðt2 t1ÞþXN
1
p¼1 dðac
pÞ
2
ðan pÞ
2 kþk~
p
e DððanpÞ
2
kþ~kpÞðt2 t1Þ: ð27Þ
Thus the auto-correlation function decays exponentially and the exponent of the dominant term is proportional toDðan
0Þ 2
k. Thus when the diffusion coefficientDis known, it is possible to extract the spring constantk.
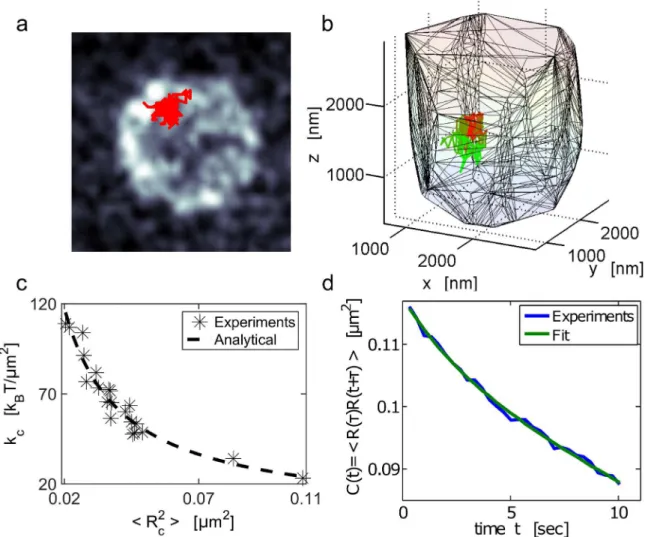
Extracting forces from live cell imaging in yeast. We now apply the present analysis to the dynamics of a chromatin locus. We monitored the time fluctuations of the chromatin fiber by following a GFP tagged DNA locus in the yeastS. cerevisiae(seematerials and methodsand [24]). We followed the MAT-locus (Fig 4a and 4b) for 100sec with a time resolution of Δt= 0.33sec and found that the trajectories were exploring a small region of the nuclear vol-ume. The trajectory shown inFig 4awas contained in a ball of radius 221nm (the nucleus is approximately a ball of the radius 1.5μm). Thus the locus is restricted to a small region of the nucleus. To extract the possible forces constraining this motion, we analyzed independently the trajectories of the MAT-locus in several cells. As cells are observed in the G1 phase, this analysis assumes that interactions on the chromatin do not change transiently, but rather have reached steady state, compared to the time scale of few minutes of the recording.
Within the hypothesis that the chromatin was interacting locally with other nuclear ele-ments, we extracted the overall force resulting from these interactions by applying formulaEq (24)to estimate the effective force constantkcfrom the sampled trajectories. The trajectories
are acquired in three dimensions. However, due to the precision difference in the XY plane (65nm×65nm) compare to thezaxis (300nm), we only used thex−andy−projections to
evalu-ate the constantkc.
Applying the extraction procedure to 21 cells, we found a large heterogeneity between cells for the values ofkc(Fig 4c), with a mean ofhkci= 67 ± 22kBT/μm2. This heterogeneity suggests
that in different cells the locus interacts differently with various nuclear elements. To verify that the motion of the chromatin locus is indeed impacted by external interactions, we plotted inFig 4c, the force constantkcfor each cell with respect to the locus position averaged over
tra-jectories, (empirically estimated byhR2
ci ¼
1
T
PNp h¼1ðR
cðhDtÞ hRciÞ
2
). The distribution of points confirms the prediction of the power law relation 17 betweenkcandhR
2
kc¼
3:0 hR2
ci
0:94. This relation was predicted by formulaEq (12), although the expected value for the
coefficient isd= 2 and not 3. This relation should hold for long trajectories so that the equilib-rium distribution is sufficiently sampled. This condition may not hold in general, but the power law decay suggests that the origin of the localization is due to interactions.
To test that the polymer model we are using, gives a self-consistent framework for interpret-ing the MAT-locus dynamics, we computed the auto-correlation function for the MAT-locus trajectory [33],
CðtÞ ¼ 1
Np t
Xd
i¼1
X
Np t
k¼1 Ri
cðkDtÞR i
cððkþ1ÞDtÞ; ð28Þ
inFig 4d. Fractional Brownian motion has been previously used to model the dynamics of Fig 4. Single locus dynamics and mean applied force on the Yeast chromatin.(a) Trajectory of the chromatin MAT-locus located on chromosome III in the yeast SS. The locus trajectory (red) inside the nucleus is projected on the XY plane. The nuclear membrane (gray scale) was stained with the
nup49-mCherry fusion protein. The time resolution isΔt= 0.33 seconds during an acquisition time of approximately 100 seconds. (b) Three-dimensional trajectories: the color codes for time propagation. Initially (t= 0) the trajectory is red and gradually becomes green (t= 100sec). The convex hull is the nuclear envelope reconstruction. (c) Scatter plot of the effective spring coefficientkcand the variance (R
2
c) of the locus trajectory estimated in two-dimensions,
extracted for 21 cells. The constantkcis estimated using formulaEq (24),fitted to a power law,kc¼hRa2
cib, witha= 3.03
±1.05kBTandb= 0.94±0.1. (d)
Auto-correlation function computed using formulaEq (28)for the trajectory shown in a. Thefit uses the sum of two exponentials:CðtÞ ¼a1e
t=t1 þa2e
t=t2, withτ 1= 45.7±0.005sandτ2= 2.4±0.35 s,a1= 109±5 × 10⁻³μm2,a2= 8.38±4.94 × 10⁻³μm2.
chromatin loci [1,18,37]. For fractional Brownian motion, the auto-correlation functionC(t) decays as a sum of power laws [38]. Thus wefirstfittedC(t) with a power law, but could not obtained a satisfactory approximation, suggesting that the description of the locus motion as a fractional Brownian motion alone is not sufficient. However, we obtain a goodfitting of the functionC(t) by a sum of two exponentials
CðtÞ a1e t=t1þa2e t=t2;
withτ1= 45.7 ± 0.005sec,τ2= 2.4 ± 0.35sec anda1= 109 ± 5 × 10⁻³μm2,a2= 8.38 ± 4.94 × 10⁻³ μm2. Thisfit suggests that the auto-correlation function for the locus position is well described by a sum of two exponentials, as predicted by formulaEq (27)derived for general polymer model.
We conclude that polymer models, such as Rouse orβ−polymer account for the dynamics
of a chromatin locus. In that context, it was possible to extract from SPTs, characteristics of the DNA locus, its dynamics, external forces and some properties of the polymer model. At this stage, we cannot determine the nature and physical origin of the anchoring forces. Forces may occur at the centromere, which is anchored to the nuclear membrane in yeast through interac-tion with the spindle pole body and/or at the telomeres, which are interacting with the nuclear membrane through several pathways [39]. The large variability of the locus position suggests that the extracted forces can happen at sub-telomere regions or with other chromosomes. Future investigations are needed to clarify the nature of these measured forces.
Discussion
We have shown here how to extract from single locus trajectories, chromatin tethering medi-ated by interactions with its surrounding environment. The presented method allows recover-ing an external force applied on chromatin although this one occurs far away from the observed locus. We note that this analysis is valid, although the recorded trajectories are possi-bly shorter than the relaxation time of the anchored chromatin. However, it is not yet possible to discern the forces from a locus positioned between two different interacting potential wells from the one generated by a single force located far away from the observed locus. In the com-plex nuclear environment, interactions of different strength can be randomly and transiently distributed along the chromatin. However, the resulting force on a single locus should mostly be generated by the sum of the two nearest interacting forces (derived from two stable potential wells). The distribution of the spring valueskcshown inFig 4ccan be attributed to different
interaction strength (k—Eq 6) or to the distances between the observed locus and the nearest interacting wellsEq (15). Other traps beyond the two nearest ones should certainly have an additional but lower contribution that needs to be estimated.
A refined description of interactions on the chromatin would require monitoring simulta-neously several loci. The present approach is also applicable for higher order organized poly-mer, modeled byβ-polymers and we extracted herein vivointeractions of the chromatin with other nuclear element that were reflected in the motion of the MAT-locus. These interactions are responsible for constraining the locus in a small fraction of the nucleus.
The motion of the chromatin is driven by both thermal fluctuations and by active ATP-dependent forces [25]. While our modeling is relevant to extract an interaction that does not change during the time acquisition of the trajectory, the spring constantkcthat would be
Materials and Methods
Experimental procedure: Yeast and growth conditions
Yeast strains used in this study are all derivatives of the JKM179 strain [11] which is MATα
ade1 leu2-3, leu2-112 lys5 trp1::HisG ura3-52. The strain was obtained through insertion of both a Lac operator array (256 lacOp repeats), a Nup49-mCherry fusion and a non-tetrameriz-ing lac repressor-GFP fusion under the HIS3 promoter into JKM179. To serve as a static refer-ence point in the nucleus, the Spc42 protein was fused to yEGFP. All insertions or deletions were verified by PCR and phenotypic assays.
Movies analysis. Microscopy Images were captured with a ×100 magnification oil-immer-sion objective (1.46 numerical aperture) on a Leica DMI 6000B microscope (Leica Microsys-tems) equipped with a piezoelectric translator (PIFOC, Physik Instrumente), a ORCA-Flash 4.0 camera (Hamamatsu) an illumination system with leds (Lumencore) and rapid imaging software (Metamorph). Wavelengths of the leds used are 475nm (for GFP, 205mW), and/or 575nm (for mCherry, 300MW). Two-minute movies with a stack of 10 optical slices separated by 300nm every 338ms. Each slice was exposed for 30ms for a total of 338ms per stack. All microscopy was done in a temperature-controlled environment set to 25°C. The raw images were deconvolved using the Autoquant software. The movies were then tracking using ImageJ [40] with the Mosaic macro [41] to produce 3D+t trajectories. Further processing and analysis of the movies was done using Matlab.
Brownian simulations. To simulate the dynamics of the polymer, we used the Euler’s method to discretize the equations into
dRn¼ rnðRÞdtþ
ffiffiffiffiffiffi
2D p
dw; ð29Þ
whereϕ(R) is given byEq (2),Dis the diffusion coefficient andware the three dimensional white Gaussian noise, with mean zero and variance 1.
Supporting Information
S1 Text. This Supplementary information contains the detail of the computations and anal-ysis to extract the strength of a potential well for a Rouse polymer.
(PDF)
Author Contributions
Conceived and designed the experiments: AA MT KD DH. Performed the experiments: AA MT KD DH. Analyzed the data: AA MT KD DH. Wrote the paper: AA DH.
References
1. Kepten E., Bronshtein I. and Garini Y., Phys. Rev. E 83, 041919 (2011).
2. Wong H., Marie-Nelly H., Herbert S., Carrivain P., Blanc H., Koszul R., Fabre E. and Zimmer C., Curr. Biol. 22, 1881–1890 (2012). doi:10.1016/j.cub.2012.06.055PMID:22940469
3. Tokuda N., Terada T. P. and Sasai M., Biophys J 102, 296–304 (2012). doi:10.1016/j.bpj.2011.12.005 PMID:22339866
4. Doi M. and Edwards S. F., The Theory of Polymer Dynamics ( Clarendon Press, Oxford, 1986). 5. Sokolov I. M., Phys. Rev. Lett. 90, 080601 (2003). doi:10.1103/PhysRevLett.90.080601PMID:
12633414
8. Albert B., Mathon J., Shukla A., Saad H., Normand C., Léger-Silvestre I., Villa D., Kamgoue A., Mozzi-conacci J., Wong H., Zimmer C., Bhargava P., Bancaud A. and Gadal O., J Cell Biol. 202, 201–210 (2013). doi:10.1083/jcb.201208186PMID:23878273
9. Kepten E., Weron A., Sikora G., Burnecki K. and Garini Y., PLoS ONE 10, e0117722 (2015). doi:10. 1371/journal.pone.0117722PMID:25680069
10. M. P. Backlund and W. E. Moerner, SPIE BiOS. International Society for Optics and Photonics (2015). 11. Lee S. E., Moore J. K., Holmes A., Umezu K., Kolodner R. D., Haber J. E., Cell 94, 399–409 (1998).
doi:10.1016/S0092-8674(00)81482-8PMID:9708741
12. Meister P., Gehlen L. R., Varela E., Kalck V. and Gasser S. M., Methods Enzymol. 470, 535–567 (2010). doi:10.1016/S0076-6879(10)70021-5PMID:20946824
13. Zimmer C. and Fabre E., J. Cell Biol. 192, 723–733 (2011). doi:10.1083/jcb.201010058PMID: 21383075
14. Fudenberg G. and Mirny L. A., Curr Opin Genet Dev. 22, 115–24 (2012). doi:10.1016/j.gde.2012.01. 006PMID:22360992
15. Dekker J., Marti-Renom M. A., Mirny L. A., Nat Rev Genet. 14, 390–403 (2013). doi:10.1038/nrg3454 PMID:23657480
16. Dion V., Klack V., Horigome C., Towbin B. D. and Gasser S. M., Nat. Cell Biol. 14, 502–509 (2012). doi:10.1038/ncb2465PMID:22484486
17. Mine-Hattab J. and Rothstein R., Nat. Cell Biol. 14, 510–517 (2012). doi:10.1038/ncb2472PMID: 22484485
18. Weber S. C., Thompson M. A., Moerner W., Spakowitz A. J. and Theriot J. A., Biophys. J. 102, 2443 (2013). doi:10.1016/j.bpj.2012.03.062
19. Hummer G. and Szabo A., Free energy profiles from single-molecule pulling experiments. Proc Natl Acad Sci U S A, 107, 21441–6 (2010). doi:10.1073/pnas.1015661107PMID:21098304
20. Hummer G. and Szabo A., Kinetics from nonequilibrium single-molecule pulling experiments. Biophys J., 85, 5–15 (2003). doi:10.1016/S0006-3495(03)74449-XPMID:12829459
21. Maghrebi M., Kantor Y. and Kardar M., Europhys. Lett. 96, 66002 (2011). doi:10.1209/0295-5075/96/ 66002
22. Maghrebi M. F., Kantor Y. and Kardar M., Phys. Rev E 86, 061801 (2012). doi:10.1103/PhysRevE.86. 061801
23. Bruinsma R., Grosberg A., and Rabin Y. and Zidovska A., Biophys J. 106, 1871–1881 (2014). doi:10. 1016/j.bpj.2014.03.038PMID:24806919
24. Marshall W., Straight A., Marko J., Swedlow J., Dernburg A., Belmont A., Murray A., Agard D. and Sedat J., Curr Biol. 7, 930 (1997). doi:10.1016/S0960-9822(06)00412-XPMID:9382846
25. Zidovska A., Weitz D. A. and Mitchison T. J., Proc Natl Acad Sci U S A 110, 15555–15560 (2013). doi: 10.1073/pnas.1220313110PMID:24019504
26. Ghosh A. and Gov N. S., Biophys J. 107, 1065–1073 (2014). doi:10.1016/j.bpj.2014.07.034PMID: 25185542
27. Nagai S., Dubrana K., Tsai-Pflugfelder M., Davidson M. B., Roberts T. M., Brown G. W., Varela E., Hediger F., Gasser S. M. and Krogan N. J., Science 322, 597–602 (2008). doi:10.1126/science. 1162790PMID:18948542
28. Verdaasdonk J. S., Vasquez P. A., Barry R. M., Barry T., Goodwin S., Forest M. G. and Bloom K., Mol. Cell 52, 819–831 (2014). doi:10.1016/j.molcel.2013.10.021
29. Hoze N., Nair D., Hosy E., Sieben C., Manley S., Herrmann A., Sibarita JB., Choquet D. and Holcman D., Proc Natl Acad Sci U S A 109, 17052–17057 (2012). doi:10.1073/pnas.1204589109PMID: 23035245
30. Amitai A. and Holcman D., Phys. Rev. Lett. 110, 248105 (2013). doi:10.1103/PhysRevLett.110. 248105PMID:25165966
31. Amitai A. and Holcman D., Phys. Rev E 88, 052604 (2013). doi:10.1103/PhysRevE.88.052604 32. Taddei A., Hediger F., Neumann F. R., Bauer C. and Gasser S. M., EMBO J 23, 1301–12 (2004). doi:
10.1038/sj.emboj.7600144PMID:15014445
33. Schuss Z., Diffusion and Stochastic Processes. An Analytical Approach, ( Springer-Verlag, New York, NY, 2009).
35. Rines D. R., Thomann D., J. F. and Dorn P. and Goodwin P. K. and Sorger, Cold Spring Harbor proto-cols 30, 1026–1041 (2011).
36. Lehmann E. L. and Casella G., Theory of point estimation, ( Springer-Verlag, New York, NY, 1998). 37. Javer A., Long Z., Nugent E., Grisi M., Siriwatwetchakul K., Dorfman K. D., Cicuta P. and Lagomarsino
M. C., Nat. comm. 4, 3003 (2013). doi:10.1038/ncomms3003
38. Jeon J. and Metzler R., Phys. Rev. E 81, 021103 (2010). doi:10.1103/PhysRevE.81.021103 39. Taddei A., Schober H. and Gasser S. M., Cold Spring Harbor perspectives in biology 2, a000612
(2010). doi:10.1101/cshperspect.a000612PMID:20554704
40. Schneider C. A., Rasband W. S. and Eliceiri K. W., Nat. Methods 9, 671–675 (2012). doi:10.1038/ nmeth.2089PMID:22930834