Submitted17 August 2016
Accepted 26 October 2016
Published29 November 2016
Corresponding author
Marià Alemany, [email protected]
Academic editor
Eric Schirmer
Additional Information and Declarations can be found on page 17
DOI10.7717/peerj.2725
Copyright
2016 Rotondo et al.
Distributed under
Creative Commons CC-BY 4.0
OPEN ACCESS
Quantitative analysis of rat adipose tissue
cell recovery, and non-fat cell volume, in
primary cell cultures
Floriana Rotondo1,2, María del Mar Romero1,2,3, Ana Cecilia Ho-Palma1,
Xavier Remesar1,2,3, José Antonio Fernández-López1,2,3and Marià Alemany1,2,3
1Department of Biochemistry and Molecular Biomedicine, Faculty of Biology, University of Barcelona,
Barcelona, Spain
2Institute of Biomedicine, University of Barcelona, Barcelona, Spain 3CIBER OBN, Barcelona, Spain
ABSTRACT
Background. White adipose tissue (WAT) is a complex, diffuse, multifunctional organ
which contains adipocytes, and a large proportion of fat, but also other cell types, active in defense, regeneration and signalling functions. Studies with adipocytes often require their isolation from WAT by breaking up the matrix of collagen fibres; however, it is unclear to what extent adipocyte number in primary cultures correlates with their number in intact WAT, since recovery and viability are often unknown.
Experimental Design. Epididymal WAT of four young adult rats was used to isolate
adipocytes with collagenase. Careful recording of lipid content of tissue, and all fraction volumes and weights, allowed us to trace the amount of initial WAT fat remaining in the cell preparation. Functionality was estimated by incubation with glucose and measurement of glucose uptake and lactate, glycerol and NEFA excretion rates up to 48 h. Non-adipocyte cells were also recovered and their sizes (and those of adipocytes) were measured. The presence of non-nucleated cells (erythrocytes) was also estimated.
Results. Cell numbers and sizes were correlated from all fractions to intact WAT.
Tracing the lipid content, the recovery of adipocytes in the final, metabolically active, preparation was in the range of 70–75%. Cells showed even higher metabolic activity in the second than in the first day of incubation. Adipocytes were 7%, erythrocytes 66% and other stromal (nucleated cells) 27% of total WAT cells. However, their overall volumes were 90%, 0.05%, and 0.2% of WAT. Non-fat volume of adipocytes was 1.3% of WAT.
Conclusions. The methodology presented here allows for a direct quantitative reference
to the original tissue of studies using isolated cells. We have also found that the ‘‘live cell mass’’ of adipose tissue is very small: about 13µL/g for adipocytes and 2µL/g stromal,
plus about 1µL/g blood (the rats were killed by exsanguination). These data translate
(with respect to the actual ‘‘live cytoplasm’’ size) into an extremely high metabolic activity, which make WAT an even more significant agent in the control of energy metabolism.
SubjectsCell Biology, Metabolic Sciences
INTRODUCTION
White adipose tissue (WAT), which has been defined as the adipose organ (Cinti, 2001), is dispersed in a large number of locations, in which its basic energy storage activity is com-plemented by many other physiological functions (Alemany & Fernández-López, 2006). In any case, its main acknowledged role is to contribute to the defense of energy homoeostasis, helping to control glucose (Sabater et al., 2014), lipid (Deschênes et al., 2003;Wang et al., 2016), and amino acid (Arriarán et al., 2015a) metabolism overall. It is responsible for an important share of the control of whole body energy availability (Hall, Roberts & Vora, 2009;Choe et al., 2016), and acts as a platform for the immune system, being actively impli-cated in processes of protection and repair (Parker & Katz, 2006;Dixit, 2008). The complex (and varying) mixture of cell types in WAT depots largely determines and modulates these functions as part of its adaptability (Vielma et al., 2013;Oishi & Manabe, 2016).
Most of WAT volume is taken up by a relatively small number of large cells, the mature adipocytes, which are generally considered the genuine cells of this tissue and thus the main target for the fight against obesity (Nawrocki & Scherer, 2005). However, most of the adipocyte volume is filled by (triacylglycerol) energy reserves (Kotronen et al., 2010). This can be extended, obviously in similar proportions, (often higher than 80%) to the WAT/adi-pose organ taken as a whole. This is a variable but significant share of total body weight (5–50%) in humans and most animal phyla. The rest of WAT cells are loosely called stromal, despite most of them not being actually connective tissue cells (Da Silva Meirelles et al., 2015). In this text, we will use the general term ‘‘stromal cell’’ to refer to all WAT cells different from fat-laden adipocytes.
The stromal fraction of WAT is made up of immune system, stem, blood, endothelial, true stromal and other types of cells, with relevant functions in the maintenance of adipocyte energy homoeostasis (Sadie van Gijsen et al., 2012), defense (Hill, Bolus & Hasty, 2014), regeneration (Domergue et al., 2016), differentiation (Gimble et al., 2011;Mitterberger et al., 2014) and others (Sumi et al., 2007;Takahara et al., 2014). Many of these functions become critical under conditions of inflammation (Lee, 2013), changing the cell composition and overall WAT metabolism (Lolmède et al., 2011;Cignarelli et al., 2012). Adipocytes, despite their small numbers (but huge volume due to their fat stores), have been intensely studied as ‘‘representative’’ of WAT (Leonhardt, Hanefeld & Haller, 1978). To study their metabolic or regulatory capabilities, the cells are isolated from WAT masses and studied using primary (Garvey et al., 1987) or immortalized (Tordjman, Leingang & Mueckler, 1990) cell cultures. The information obtained is often taken as directly representative of WATin vivo,in spite of the large number of factors that are known to rebut this excessively simplistic approach (O’Brien et al., 1996), including the ordeal of cell isolation (Thompson et al., 2012).
into account (Pasarica et al., 2009) and the blood flow/oxygen and substrates’ availability (Mjös & Akre, 1971). Quantification of adipocyte recovery from whole tissue samples, and the analysis of the proportion of ‘‘live’’ cell space in the tissue are necessary steps for direct comparison of data from different sources. Unfortunately, cell number is dependent on the method of quantification used, and is logically affected by cell volume. The proportion of fat in the tissue and cells also proportionally ‘‘reduces’’ the live-cell mass. This is further confounded by the direct estimation of cell numbers via DNA analysis which (at least in mammals) would not detect the number of erythrocytes, but would detect numbers of small hematopoietic cell (Luche et al., 2015) macrophages and lymphocytes (Sell & Eckel, 2010). The latter non-adipocyte populations would then be counted as ‘‘adipocytes,’’ despite having a volume about 104-fold smaller.
Referring cell or tissue experimental data to protein content may be a fair index for comparison, but the large presence (also deeply varying depending on location (Alkhouli et al., 2013)) of extracellular fibrous proteins, such as collagen (Liu et al., 2016) also modifies the quantitative evaluation of the metabolically active fraction of the tissue; this fraction is also deeply affected by obesity and inflammation (Li et al., 2010).
In the present study, we have devised a method for the estimation of actual recovery of viable adipocytes with respect to WAT mass based on the unique presence of large amounts of fat in them. We have also intended to present an estimation of the size of the metabolically active WAT cell mass with respect to the mass/volume of the tissue. We used, as reference, the epididymal WAT fat pads of non-obese healthy adult rats (to limit the known effects of inflammation on WAT cell profile). This location is considered to be one of the less metabolically active (Arriarán et al., 2015b), and is widely used for ‘‘representative’’ WAT adipocyte function for its size, easy dissection and absence of contamination by neighboring tissues.
MATERIALS AND METHODS
Rats and housing conditionsAll animal handling procedures and the experimental setup were in accordance with the animal handling guidelines of the corresponding European, Spanish and Catalan Authorities. The Committee on Animal Experimentation of the University of Barcelona specifically authorized the procedures used in the present study.
Male Wistar rats (Harlan Laboratory Models, Sant Feliu de Codines, Spain), 18-week old, weighing 435±84 g (mean, SD), were used after a 2-week acclimation period in a controlled environment. The animals were kept in two-rat cages with wood shards as bedding material, at 21–22◦
C, and 50–60% relative humidity; lights were on from 08:00 to 20:00. They had unrestricted access to water and standard maintenance rat chow (Harlan #2014).
Isolation of adipocytes
samples were weighed, immersed in the digestion medium described below, and cut in small pieces with scissors. Samples were incubated, at 37◦
C in a shaking bath for 60 min, with 2.5 volumes of Krebs-Henseleit buffer pH 7.4, containing 5 mM glucose, 0.1µM adenosine
(Sigma-Aldrich, St Louis, MO, USA) (Honnor, Dhillon & Londos, 1985), and 10 g/L lipid-free bovine serum albumin (Merck-Millipore, Billerica, MA USA). This was complemented with 3.5 mkat/L collagenase (LS004196, type I; Worthington Biomedical, Lakewood, NJ, USA). The collagenase-containing digestion buffer was prepared in the cold room (4◦
C), and was used within 1 h.
At the end of the digestion process (carried at 37◦
C), the suspensions were gently sieved using a double layer of nylon mesh hose (plain commercial sheer tight stocking; 90% polyamide, 10% elastomer, parallel woven with 15 den cylindrical single-filament threads; with approximate mean—flexible—pores in the range of 300µm), which retained vessel
fragments and (eventually) undigested tissue pieces. The smooth crude suspension of isolated cells was left standing for 5 min in stoppered polypropylene syringes (#SS+10ES1, Terumo, Tokyo, Japan), held vertically, at room temperature (22–24◦C). The adipocytes floated to form a defined upper layer. Then, the lower aqueous fraction was slowly drained off, capping again the syringe to retain the adipocytes. The cells were washed this way three times, using 2.5 volumes of the buffer each time. Before re-suspending the cells in it, the buffer was subjected to 30 s vortexing, to allow for equilibration with air oxygen. The final supernatant fraction contained intact adipocytes and a thin layer of free fat from broken cells. After the final washing, 400µL aliquots of the cells’ fraction were taken for
incubation. The samples were slowly extracted from the central part of the adipocytes’ layer, trying not to disturb the thin-floating lipid layer. The cells were manipulated and maintained at room temperature for a time as short as possible, and used immediately after the final washing.
Stromal cell space in the isolated cell suspension, used to relate their numbers and volumes to initial tissue weight, was considered the sum of the volume of the lower phase of adipocyte separation in the syringes, plus the volume of the adipocyte phase, to which the volume of adipocytes (calculated from cell numbers and volumes) was subtracted. Obviously, the first separation of adipocytes and stromal cells left a high number of the latter mixed with adipocytes. The three successive washings resulted in the presence (calculated) of, at most, 0.1% of the initial stromal cells in the final washed adipocyte fraction (down from an initial 7.3%). This assumption does not take into account stromal cells bound, retained or attached to the larger adipocytes.
Estimation of the efficiency of adipocyte extraction
Practically all fat in WAT is limited to adipocytes. All types of cells contain lipids, mainly as membrane components; the small size of the combined mass and their density do not alter the cells’ density and, consequently their buoyancy. A few types of cells, i.e., macrophages, foam cells and differentiating preadipocytes may contain sizeable amounts of fat, but they only appear under precise physiological conditions (foam cells, differentiating
lipid to generate enough floatability to allow their separation from the rest of cells by just standing—i.e., at 1×g—for five minutes. We used this differential fat content to establish an approximate estimation of the efficiency of the digestion-extraction procedure for adipocyte isolation described above, simply by estimating the recovery of fat from the intact tissue to a preparation containing only viable functional cells.
A sample of just dissected WAT was divided in two parts, one was processed to obtain washed adipocytes as described above, and the other was divided in several aliquots, used to measure the water (dry weight after 24 h at 90◦C) and lipid content. To measure lipids, frag-ments of about 300 mg of intact tissue were weighed and extracted with trichloromethane: methanol (2:1 v/v) (Folch, Lees & Sloane-Stanley, 1957). The resulting values were used to establish the proportion of lipids in the intact tissue. Using this method as originally described, most of membrane lipids were not extracted (Rose & Oklander, 1965;Eder, Reichlmayr-Lais & Kirchgener, 1993), but the recovery of WAT-vacuole lipids (i.e., fat, essentially triacylglycerols) was quantitative. The weights of the lipids present in the fat layer on top of the cells’ suspension (washed and essentially free of stromal cells, as explained above), and those of stromal cells’ fraction and extraction debris were measured. The weight of the recovered adipocyte fraction and their water and lipid content were also estimated, thus obtaining the total weight of lipid present in the isolated adipocytes.
The density of WAT was estimated using tightly capped tubes, which were weighed both dry and completely full of deionized water at 20◦C. The net weight of water was used to calculate the volume of the tube. The process was repeated including weighed 300–500 mg pieces of intact WAT in the tubes and completely filling them with water (nevertheless, no different values were obtained using pieces of 200–1,000 mg). The difference in weight of the tubes with and without WAT samples allowed us to calculate the volume of the samples; their density was estimated from the volume and weight. Other samples of WAT were used to extract its lipid as described above. The density of the extracted lipid was estimated using the same procedure using cold-solidified fat samples.
The weight of lipid extracted from the adipocyte preparation was compared with the initial weight and the actual proportion of lipid present in the intact tissue, after discounting the weight of debris eliminated during the process of extraction. Lipid in the stromal cell fraction was negligible, statistically not different from zero.
Measurement of isolated cell parameters
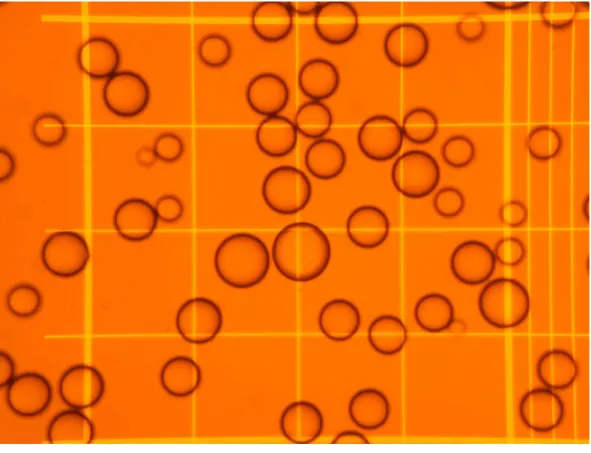
Figure 1 Representative microphotography of an adipocyte preparation observed at the microscope using a Neubauer chamber.The squares in the grid have a width of 250µm, and correspond to a volume
of 6.25 nL.
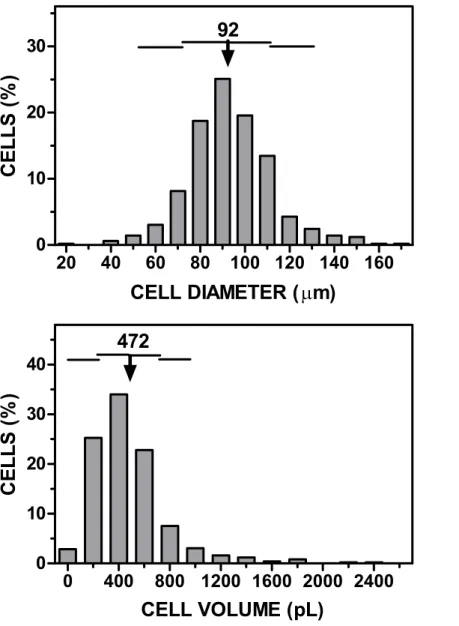
±147 pL in volume.Figure 2shows a representative example of the range of cell sizes
obtained using this procedure on epididymal WAT.
Non-nucleated cells (essentially red blood cells: RBCs) were identified by their smaller size (in the fL range) using the Scepter 2.0 cell counter (EDM Millipore Corp, Billerica, MA USA) hand-held cell sizer. Total stromal cells, (i.e., including RBCs) were analyzed for each sample using two different cell-range tips for the Scepter: Sensor 40, for 3–18µm
particles’ size (PHCC40050; Merck Millipore, Darmstadt, Germany) and Sensor 60, for 6–36µm particles’ size (PHCC60050; Merck Millipore). The data for both ends of the
superimposed size graphs were taken as final values, and those in the overlapping zone were used taking in both series of data against diameter. After the data were arranged, the measured volumes were plotted and the data were statistically analyzed.
Figure 2 Representative graph of cell size (diameter, volume)vs. cell numbers representation obtained applying the cell extraction procedure described in the text to a sample of epididymal adipose tissue. The data have been grouped to facilitate the presentation. The arrow (and the number above) represent the mean cell diameter and volume. The horizontal lines represent each one the extent of one SD.
the presence of blood cells in the whole tissue and stromal cell counts, incorporating these data in the calculations.
Cell viability
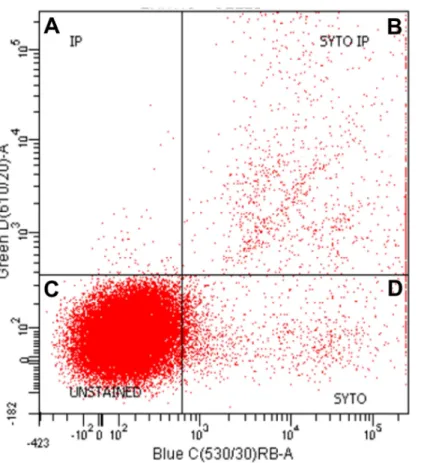
Figure 3 Representative graph of flow cell analysis of stromal fraction of epididymal rat WAT to dis-criminate nucleated from non-nucleated cells.Both propidium Iodide (IP) and Syto-13 (SYTO) bind DNA-positive and double positive particles (i.e., cells). The dots in the (A), (B) and (D) correspond to nu-cleated stromal cells; dots in (C) show the unstained cells, largely corresponding to the high proportion of erythrocytes.
bovine serum albumin (Millipore Calbiochem, MA, USA), 100 U/mL penicillin and 100 mg/L streptomycin (Gibco). Adenosine (Sigma-Aldrich) 100 nM was also added to help maintain the integrity of the cells. D-glucose (7 mM) was added as substrate. Each well received 400 µL of the adipocyte suspension (a second 100µL aliquot was taken
simultaneously to determine the adipocyte content in the well), thus completing a final volume of 2.1 mL. Under these conditions, the cells floated freely (as spheres) and tended to accumulate on the surface of the well. The cells were incubated at 37 ◦
C in an incubation chamber ventilated with air supplemented with 5% CO2, which gave a theoretical pO2of
20 kPa (i.e., 0.2 mM of dissolved O2) (Romero et al., 2015). The calculated pCO2was in the
range of 5 kPa, corresponding to 1.7 mM of dissolved CO2. The cells were incubated for
24 h or 48 h without any further intervention. At the end of the experiment, a sample of the well contents was used to determine the number of cells. Then, the cells were harvested and the medium was extracted and frozen.
Lactate was measured with kit 1001330 (Spinreact, Sant Esteve d’en Bas, Spain), glycerol was estimated with kit #F6428 (Sigma-Aldrich); NEFA were measured using kit NEFA-HR(2) (Wako Life Sciences, Mountain View, CA, USA).
Calculations
A critical factor in the development of this procedure was to keep track of all weights/volumes and incorporate into the calculations all aliquots extracted for testing (i.e., glucose or lactate levels). All data were introduced in a spreadsheet in which the volumes were justified with a (pipetting) error of±3%. When possible, or when no other avenue was available, volumes were estimated from differential weights and the application of the densities calculated as described above.
The calculations used to determine the cell parameters, adipocyte recovery and WAT cell distribution are described in the Tables, presenting the original experimental data along with the derived or calculated data, as well as the formulas used for their estimation.
Statistical analyses were carried out using the Prism 5 Program (Graphpad Software Inc., La Jolla, CA, USA). Statistical differences between groups of data were determined with the unpaired Student’sttest.
RESULTS
Analysis of the recovery of adipocytes from intact epididymal WAT
Table 1 shows the main experimental data for the quantitative analysis of free isolated adipocyte yield from just-dissected epididymal WAT. Both weight, water and fat content, as expected, showed little variation. The suspension obtained after collagenase digestion was estimated by weight, as were the floating fat layer and the debris retained in the nylon mesh. The number, and mean volume of intact adipocytes was also fairly uniform. The number of free (i.e., unattached to adipocytes) stromal cells was 17-fold higher than that of adipocytes, but almost 3/4ths of them were just red blood cells. All stromal cells had cell volumes in the range of 10−4of those of adipocytes. The volumes of all stromal cells,
including erythrocytes were measured after separation via high-speed centrifugation, which may have altered their original shape and volume, a treatment that the large adipocytes could not endure.
All tables contain a first column, labeled #, in which a letter and number are given to each row (or datum). These references are later used, inTables 2–6to present the origin of the data and the calculations done using the experimental data.
Table 1 Results obtained from the collagenase digestion of rat epididymal WAT and the analysis of the tissue and fractions of tissue obtained in the process of separation of viable isolated adipocytes.The data presented as mean±SD are direct experimental results obtained from four different rats.
# Parameter Units Values
A1 Epididymal WAT weight g 4.32±0.44
A2 WAT fat content mg/g 869±15
A3 WAT water content mg/g 45±6
A4 Adipocyte suspension (digested tissue) g 4.78±0.86
A5 Floating fat derived from broken adipocytes mg 105±96
A6 Intact adipocytes suspension (A4–A5) g 4.67±0.85
A7 Fat in the intact adipocytes suspension mg/g 537±199 A8 Total fat in the intact adipocytes suspension g 2.51±1.06 A9 Water in the intact adipocytes suspension mg/g 287±68 A10 Recovery of intact adipocytes cells×106 5.82±3.06
A11 Adipocyte mean volume pL 475±147
A12 Extraction debris mass (dry weight) mg 356±13
A13 Number of total stromal cells freed cells×106 103±45
A14 Stromal cells’ mean volume fL 96.6±43.0
A15 Red blood cells (proportion of A13, total stromal cells) % 71.4±8.5
A16 Red blood cells’ mean volume fL 25.9±1.1
dt Intact WAT density g/mL 0.940±0.013
dl WAT fat density g/mL 0.922±0.022
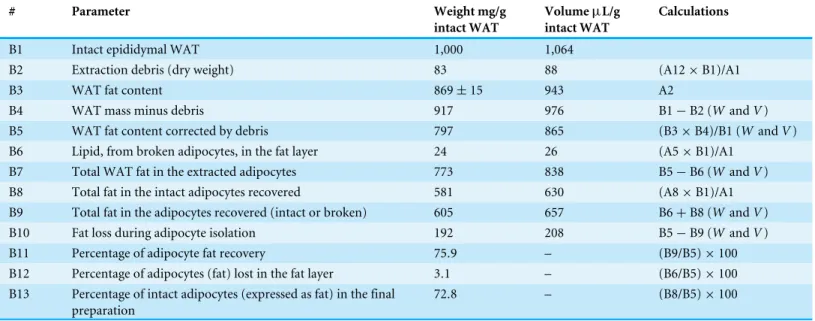
Table 2 Analysis of the effectivity of the adipocyte isolation procedure used based on the analysis of lipid distribution, from intact tissue to the final preparation of adipocytes.The data are mean values calculated from the experimental data inTable 1. The column ‘‘calculations’’ explains the data used in each case. Volumes were calculated withdtordl(Table 1) when applied to tissue (V=W/dt) or lipid (V=W/dl), whereWis weight (in g) andVvolume (in mL). In the calculations marked (WandV), the values were calculated directly from weights and volumes, i.e., not apply-ing the density factors.
# Parameter Weight mg/g
intact WAT
VolumeµL/g
intact WAT
Calculations
B1 Intact epididymal WAT 1,000 1,064
B2 Extraction debris (dry weight) 83 88 (A12×B1)/A1
B3 WAT fat content 869±15 943 A2
B4 WAT mass minus debris 917 976 B1−B2 (WandV)
B5 WAT fat content corrected by debris 797 865 (B3×B4)/B1 (WandV)
B6 Lipid, from broken adipocytes, in the fat layer 24 26 (A5×B1)/A1
B7 Total WAT fat in the extracted adipocytes 773 838 B5−B6 (WandV)
B8 Total fat in the intact adipocytes recovered 581 630 (A8×B1)/A1
B9 Total fat in the adipocytes recovered (intact or broken) 605 657 B6+B8 (WandV)
B10 Fat loss during adipocyte isolation 192 208 B5−B9 (WandV)
B11 Percentage of adipocyte fat recovery 75.9 – (B9/B5)×100
B12 Percentage of adipocytes (fat) lost in the fat layer 3.1 – (B6/B5)×100 B13 Percentage of intact adipocytes (expressed as fat) in the final
preparation
The detailed calculations of the efficiency of adipocyte recovery can be seen onTables 1and2. We assumed that practically all WAT fat was present in the adipocyte fraction, essentially in adipocytes, since membrane lipids were not extracted with the procedure used (Rose & Oklander, 1965;Remesar et al., 2015), the eventual presence of fat in stromal cells went undetected and, in any case, could not represent a significant amount of material given the combined volume of these cells and their density. Consequently, all the fat present in the final intact adipocyte preparation should correspond to that of adipocytes, since free fat was measured and removed, and there were no other fat-carrying cells in the system in mass and/or numbers sufficient to alter the results, and neither membrane lipids could interfere in a significant way. Our previous work provides additional calculations that further support this conclusion (Remesar et al., 2015). Thus, we could equate the losses of fat (with respect to intact tissue) with losses of adipocytes. These losses were found to be significant, and the manipulation of the cells resulted in additional cells breakup. Under the conditions described, the collagenase incubation and extrusion through the nylon mesh resulted in a loss of about 24% of the cells (in fact, losses of fat), and the washings of the isolated cells added an additional loss in the range of 3%, which resulted in a recovery of about 73% of intact functional cells in the final adipocyte preparation, used for incubations, and referred to intact WAT (Table 2).
Isolated adipocyte viability
The viability of the cells obtained was high in the final preparation, with a negligible number of cells broken. The incubation of cells (about 700,000 per well) resulted in a loss of cells of approximately 4% in the first 24 h and an additional 9% in the second 24 h period. Consequently, the cells were viable and remained functional for 2 additional days in primary culture. The rate of glucose uptake (and metabolic utilization) per cell increased significantly in the second day of incubation (Fig. 4). However, the lactate efflux rates were maintained. Glycerol efflux rate also rose several fold in the 24–48 h period, maintaining, in the end, a much higher efflux rate than that of NEFA, which attests to its mainly glycolytic origin (parallel to the increase in glucose uptake and the maintenance of lactate production). However, the sole presence of NEFA proves that lipolysis was clearly present in the second day, probably as a consequence of the loss of about half of the glucose initially present in the medium (i.e., decreasing its availability to support cell metabolism). The higher rates of glycerol efflux in comparison with those of NEFA also support the finding that most of glycerol was not of lipolytic origin (Smith, 1972;Romero et al., 2015), since then the reverse would be true. In any case, the data prove that metabolic activity (at least glucose uptake, glycolysis to lactate, glycerogenesis and lipolysis) were fully functional in the 48 h period studied, in fact increasing during the second day of incubation.
Analysis of WAT cell type distribution and proportions, cumulative volumes
Figure 4 Metabolic activity of epididymal WAT adipocytes in primary culture at 24 h and 48 h of incu-bation.The data represent the mean±SD of four different rats (triplicate wells). The data are presented as rates of uptake (glucose, white bars), or efflux to the medium (lactate, blue bars, glycerol red bars and NEFA beige bars), in concordant units (akat/cell) to facilitate comparisons. Statistical significance of the differences between 24 h and 48 h data: an asterisk * represents aP<0.05 difference (Student’sttest).
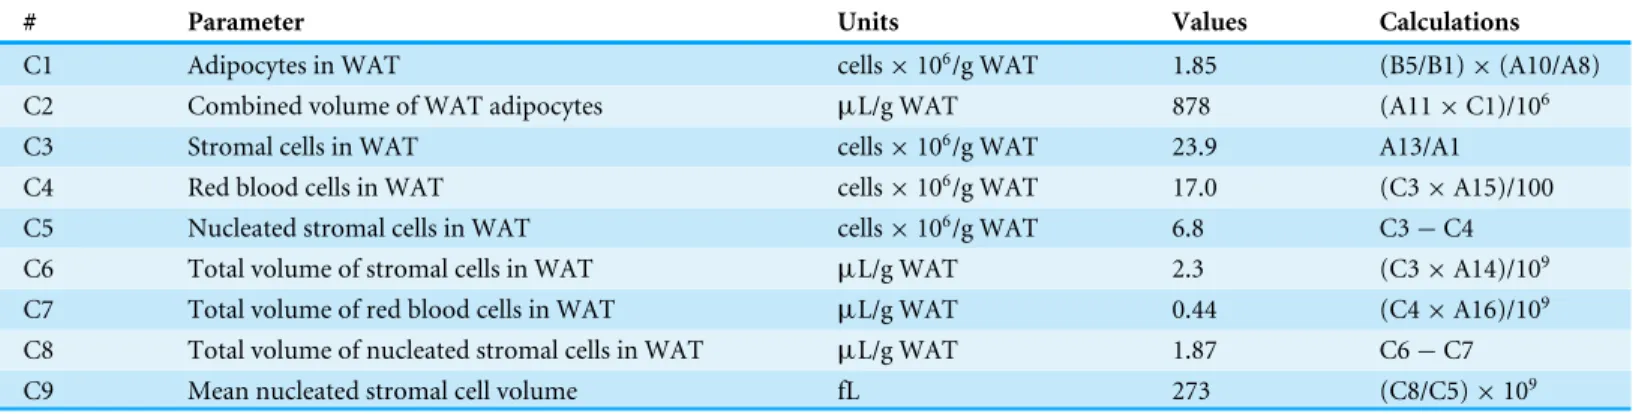
Table 3 Calculation of the volumes of cells from rat epididymal WAT.Data calculated using the experimental results presented inTables 1and2.
# Parameter Units Values Calculations
C1 Adipocytes in WAT cells×106/g WAT 1.85 (B5/B1)×(A10/A8)
C2 Combined volume of WAT adipocytes µL/g WAT 878 (A11×C1)/106
C3 Stromal cells in WAT cells×106/g WAT 23.9 A13/A1
C4 Red blood cells in WAT cells×106/g WAT 17.0 (C3×A15)/100
C5 Nucleated stromal cells in WAT cells×106/g WAT 6.8 C3−C4
C6 Total volume of stromal cells in WAT µL/g WAT 2.3 (C3×A14)/109
C7 Total volume of red blood cells in WAT µL/g WAT 0.44 (C4×A16)/109
C8 Total volume of nucleated stromal cells in WAT µL/g WAT 1.87 C6−C7
C9 Mean nucleated stromal cell volume fL 273 (C8/C5)×109
The total mass of adipocytes was scaled up to the tissue volume from the measured data of mean adipocyte volume and its numbers (estimated from tissue and isolated cells’ fat content). Adipocytes constituted almost 0.88 mL/g WAT volume. Total stromal cells and erythrocytes’ volumes were, likewise, calculated from their mean cell size and numbers, scaled up to the volume of 1 g of intact WAT. Despite their larger numbers, the combined total volume of all stromal cells accounted for a little more than 2µL/g WAT.
Table 4 Calculation of the non-fat cell volume of adipocytes in rat epididymal WAT.Data calculated using the experimental data presented in Tables 1–3.
# Parameter Volume (µL/g WAT) % of total cells volume Calculations
D1 Total volume of adipocytes in 1 g of WAT 878 100 C2
D2 Total fat volume in 1 g of WAT 865 98.5 B5
D3 Non-fat adipocyte cell volume in 1 g of WAT 13 1.5 D1−D2
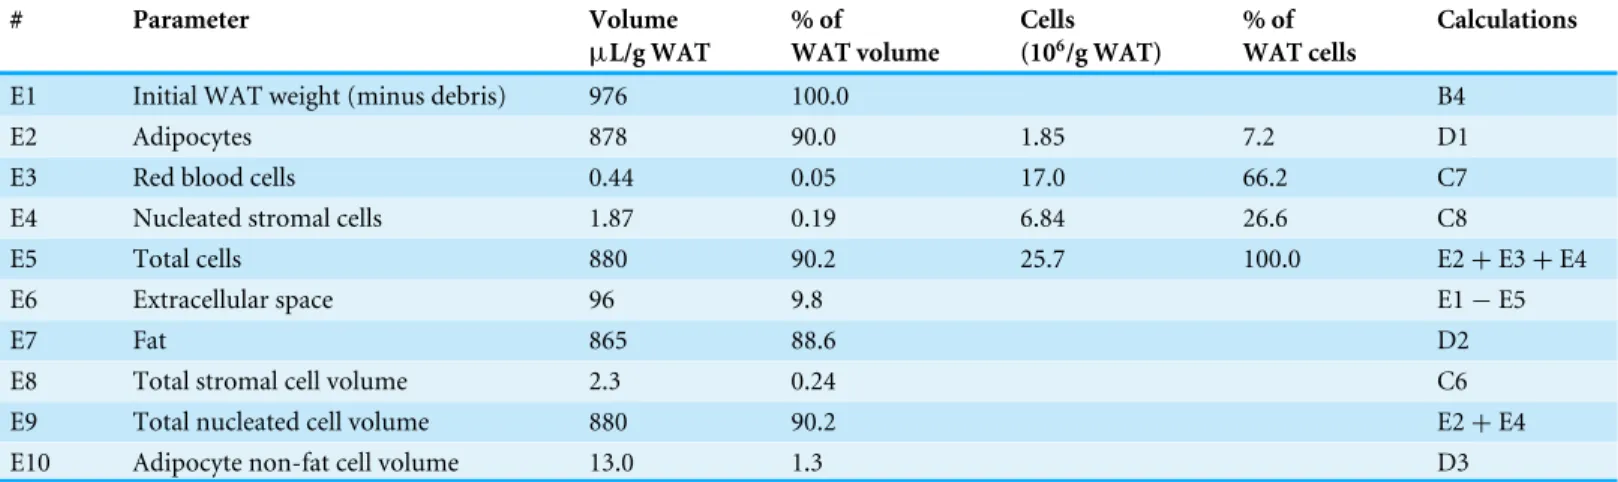
Table 5 Distribution of cell types by volume and number in rat epididymal fat.Data calculated using the results presented inTables 1–4.
# Parameter Volume
µL/g WAT
% of WAT volume
Cells (106/g WAT)
% of WAT cells
Calculations
E1 Initial WAT weight (minus debris) 976 100.0 B4
E2 Adipocytes 878 90.0 1.85 7.2 D1
E3 Red blood cells 0.44 0.05 17.0 66.2 C7
E4 Nucleated stromal cells 1.87 0.19 6.84 26.6 C8
E5 Total cells 880 90.2 25.7 100.0 E2+E3+E4
E6 Extracellular space 96 9.8 E1−E5
E7 Fat 865 88.6 D2
E8 Total stromal cell volume 2.3 0.24 C6
E9 Total nucleated cell volume 880 90.2 E2+E4
E10 Adipocyte non-fat cell volume 13.0 1.3 D3
larger, was calculated from another set of data: cell counting and mean volumes, tracing the cell losses from those of fat. The small difference between both entities was in the range of 1.5% of the cell volume, and taken as such, despite the wide margin of error and the small number of animals used to calculate this mean value, it represents a very small proportion of the whole tissue, which magnifies its active metabolic performance.
Table 5shows the global distribution of epididymal WAT volume and the space taken up by the three types of cells analyzed. Adipocytes took up 90% of the tissue volume (excluding the ‘‘debris,’’ largely vessels and other structures or undigested tissue), but their number was only 7% of the total number of cells. Nucleated stromal cells hardly took 0.2% of the volume but accounted for 27% of the cells. Red blood cells were the most abundant, 66% of numbers, but their space was only 0.05%, a value that roughly corresponds to 1µL of
whole blood per g of WAT (the rats were exsanguinated, thus this is a residual tissue blood volume). Cells did not occupy all the tissue space, since about 10% of the tissue volume was extracellular space (interstitial and vascular). Fat alone filled 89% of the tissue space.
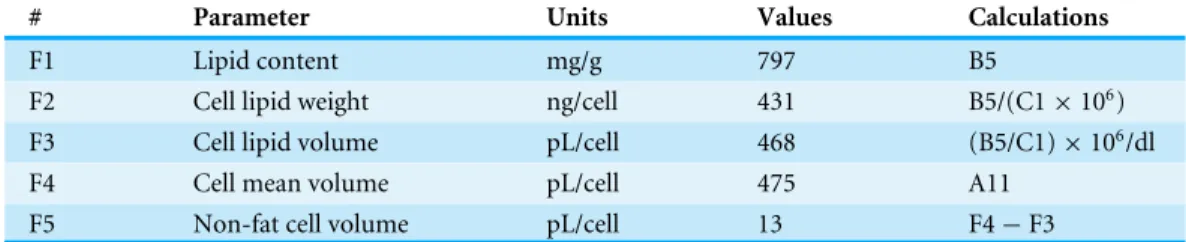
Table 6 Characteristics of the adipocytes isolated from rat epididymal adipose tissue.Data calculated using the results shown inTables 1–3.
# Parameter Units Values Calculations
F1 Lipid content mg/g 797 B5
F2 Cell lipid weight ng/cell 431 B5/(C1×106)
F3 Cell lipid volume pL/cell 468 (B5/C1)×106/dl
F4 Cell mean volume pL/cell 475 A11
F5 Non-fat cell volume pL/cell 13 F4−F3
despite their lower numbers, the mass of ‘‘live-cell material’’ of adipocytes remains the main active component of WAT at least using these gross comparison tools.
DISCUSSION
Probably, the most striking conclusion of the present study is the very small proportion of ‘‘live cell matter’’ found in epididymal WAT of normal young adult rats. Fat stores take up an inordinate amount of the tissue space, the interstitial space found is close to that described in previous reports and is in the range of other tissues (Robert & Alemany, 1981). However, after excluding the inert fat deposits, the remaining ‘‘cell material’’ accounts for about 1.5% of the total tissue mass, which seems very little even in relation to the assumedly limited metabolic activity of the tissue.
The data and viability of cells obtained with our customized version of theRodbell (1964) method for isolation of adipocytes reflect a specific experimental condition, and their absolute values are obviously subjected to a number of possible modifying conditions, such as small changes in the conditions of extraction, the length of incubation, the inflammatory condition of WAT, the location of WAT depots, and the age, mass of WAT and sex of the animals used. Primary adipocytes may be incubated for long periods without loss of response to hormonal or paracrine stimuli (Marshall, Garvey & Miriam, 1984;Fain & Madan, 2005;Giovambattista et al., 2006). The lineal response to excess medium glucose producing lactate for up to 48 h is comparable to that described previously by us in 3T3L1 cells (Sabater et al., 2014). The increased secretion of glycerol and NEFA during the second day of incubation attest not to a loss of metabolic response and viability but to a change in the mechanisms of control of substrate efflux; these results agree with the known glycerogenesis and limited lipolysis of adipocytes when exposed to glucose (Romero et al., 2015).
that the data calculated from the actual experimental results is only an approximation to the real values of this ‘‘live-cell’’ volume of adipose tissue cells. However, the data involved: percentage of fat in the intact tissue, and the combination of mean cell volume and number of adipocytes yield very close figures, with a small difference in cell size over vacuolar fat size. The different origin of the data, plus the use of different animals to get the means (the individual variability gave too much dispersion), decided us to work with experimentally-derived mean values to diminish the noise or clutter of individual data on the calculated/derived parameters. In previous works, we have proven the remarkable metabolic activity of the sum of WAT depots (i.e., taken as adipose organ) (Arriarán et al., 2015b;Arriarán et al., 2015c), especially its considerable glycolytic capability (under normoxic conditions) (Arriarán et al., 2015c;Romero et al., 2015), which adds to its known ability to store fatty acids taken from plasma lipoproteins (Garfinkel, Baker & Schotz, 1967;Wang et al., 2016) or synthesized from glucose (Guerre-Millo, 2003). Its important contribution to amino acid metabolism (Arriarán et al., 2015a), second only to liver (Agnelli et al., 2016;Arriarán et al., 2016), supports the long-proposed active WAT implication in energy and intermediate/substrate metabolism (Cahill, 1962). The data presented here only compound the puzzle, since the actual mass of cells doing the work is only a small fraction of the tissue, much lower than usually assumed. This small number of cells (including the stromal nucleated cells) is able to produce a large number of signaling cytokines (Gerner et al., 2013;Wisse, 2004), hormones (Killinger et al., 1995;Stimson et al., 2009) and maintain an active capacity to defend (immune system) (Chmelar, Chung & Chavakis, 2013), and repair or regenerate (i.e., stem cells) (Ogura et al., 2014) tissues. Compared to liver, which cell volume is upwards of 75% of its volume, the 50-fold lower proportion of WAT ‘‘live cell’’ volume has to show a much higher metabolic activity to be able to carry out the large number of functions and active metabolism that we keep discovering in recent times in WAT. The actual quantitation of the mass of adipocyte cytosol and its correlation with metabolic activity is a study worth carrying out, to definitively establish that WAT cells metabolism is extremely active, and not a dump for excess energy.
Surprisingly, the most abundant cells found in WAT were red blood cells, which accounted for roughly two thirds of the total. The volume of red blood cells was the approximate equivalent to about 1µL of blood per g WAT, lower than previously published
data using 65Fe-labelled red blood cells (Robert & Alemany, 1981). Probably, the blood
figure will be higherin vivo, since the rats were killed by exsanguination, so that most of the blood was drained. Consequently, we can assume thatin vivo,WAT blood content may justify a hefty proportion of the tissue cells.
the large number of studies available that analyze WAT cell populations under different metabolic conditions, since in practically all cases, the studies are not quantitative, neither referred to initial tissue mass, and are usually centered on preadipocytes (Grégoire et al., 1990), macrophages (Makkonen et al., 2007), vascular (Kajimoto et al., 2010) or other specific cell types (Villaret et al., 2010). In addition, most data on WAT adipocyte counts were done in fixed and stained WAT histologic cuts, where, usually, only section areas (of adipocytes) are taken into account, irrespective of the level of the cell at which they have been sliced and then estimated.
The ever-present problem of lipid droplets in cell suspensions has been partially solved in this case by letting them coalesce in a lipid layer before counting adipocytes in micropho-tographs. Nuclear staining may open new possibilities for counting, but the probable presence of other cells attached to adipocytes (i.e., not removed by the washings) and the need to maintain the integrity of the cells for sizing has prevented the use of this approach in the present study.
We expected to find larger numbers of stromal cells, obviously more than blood cells, be-cause this relatively small part of the tissue is responsible for a large number of its metabolic functions and control responses as explained above, and is subjected to considerable variability related to its location and to inflammation (Cildir, Akincilar & Tergaonkar, 2013; Villaret et al., 2010). In any case, adipocytes remain by large (percentage of WAT volume either counting the fat vacuoles or not) the main component of WAT cell populations, but this primacy was lost when considering the numbers of cells.
floating in the buffer after treatment with collagenase and separation of debris (i.e., low density, and preferentially of large volume), were considered adipocytes. Just leaving the cells standing (i.e., centrifugation at 1×g) 5 min prevented pressure-caking of adipocytes and their breakage, but allowed a uniform distribution of smaller stromal cells between both phases. This was no problem for their estimation (numbers and volumes), but introduced a possible source of error when using isolated adipocytes for metabolic analysis, since the nucleated stromal cells remained a significant fraction of the crude adipocyte suspension. Three washings resulted in the loss of about 3% of adipocytes, but theoretically removed almost all non-attached stromal cells, down to a negligible proportion of the initial stromal cells content in the adipocyte fraction. The numbers and volumes of adipocytes found were in the range of those described in the literature (DiGirolamo & Owens, 1976;Francendese & Digirolamo, 1981). In addition, the cell volumes estimated, combined with the numbers of cells measured accounted for almost all the tissue space available, which is, in itself, an internal check that our calculations and estimations were essentially correct.
CONCLUSIONS
The methodology presented here for the estimation of adipocyte recovery allows for a direct quantitative reference to the original intact tissue of studies with isolated cells. This way, the cultured cell data can be used as an approximation to metabolic activity and function related to whole organism.
We have presented proof that the ‘‘live cell mass’’ of adipose tissue is very small. This fact, translates into an extremely high (with respect to the actual ‘‘live cytoplasm’’ size) metabolic activity to justify the overall activity of WAT in glucose-fatty acid relationships, but also in amino acid metabolism. These data justify that comparison of epididymal WAT, often considered the less metabolically active part of the adipose organ, with more metabolically relevant tissues such as liver should take into account these quantitative data, which make WAT an even more significant agent in the control of energy metabolism.
ACKNOWLEDGEMENTS
Thanks are given to Dr. Marta Camps for her help with practical aspects cell isolation methodology. We also thank the staff of the Scientific and Technological Services of the University of Barcelona for their help in the use of cell technologies.
ADDITIONAL INFORMATION AND DECLARATIONS
Funding
The authors received no funding for this work.
Competing Interests
Author Contributions
• Floriana Rotondo performed the experiments, analyzed the data, prepared figures and/or
tables, reviewed drafts of the paper.
• María del Mar Romero conceived and designed the experiments, performed the
experiments, reviewed drafts of the paper.
• Ana Cecilia Ho-Palma performed the experiments, reviewed drafts of the paper.
• Xavier Remesar performed the experiments, analyzed the data, reviewed drafts of the
paper.
• José Antonio Fernández-López analyzed the data, prepared figures and/or tables,
reviewed drafts of the paper.
• Marià Alemany conceived and designed the experiments, analyzed the data, wrote the
paper, prepared figures and/or tables, reviewed drafts of the paper.
Animal Ethics
The following information was supplied relating to ethical approvals (i.e., approving body and any reference numbers):
The Committee on Animal Experimentation of the University of Barcelona authorized the procedures used in the present study.
The animals were only subjected to euthanasia under isoflurane anesthesia, this is not a procedure requiring special permission but simple verbal communication of the execution of the procedure to the Acting Director of the Animal House. The sacrifice of the animals was carried out within a periodic culling procedure to reduce the population of the animal room. The animals were simply used for tissue sampling after anaesthesia instead of leaving them to die because of overdose of anaesthesia. No other manipulation was done on the animals, in accordance with the rules established by the Committee.
Data Availability
The following information was supplied regarding data availability: University of Barcelona Repositoryhttp://hdl.handle.net/2445/102243.
REFERENCES
Agnelli S, Arriarán S, Oliva L, Remesar X, Fernández-Lápez J-A, Alemany M. 2016.
Modulation of rat liver urea cycle and related ammonium metabolism by sex and cafeteria diet.RSC Advances6:11278–11288DOI 10.1039/C5RA25174E.
Alemany M, Fernández-López JA. 2006.Adipose tissue: something more than just
adipocytes.Current Nutrition and Food Science2:141–150
DOI 10.2174/157340106776818817.
Alkhouli N, Mansfield J, Green E, Bell J, Knight B, Liversedge N, Tham JC, Welbourn
R, Shore AC, Kos K, Winlove CP. 2013.The mechanical properties of human
adipose tissues and their relationships to the structure and composition of the extracellular matrix.American Journal of Physiology305:E1427–E1435
Arriarán S, Agnelli S, Remesar X, Alemany M, Fernández-López JA. 2016.White adi-pose tissue urea cycle activity is not affected by one-month treatment with a hyperli-pidic diet in female rats.Food and Function7:1554–1563DOI 10.1039/C5FO01503K.
Arriarán S, Agnelli S, Remesar X, Fernández-López J-A, Alemany M. 2015a.The urea
cycle of rat white adipose tissue.RSC Advances5:93403–93414
DOI 10.1039/C5RA16398F.
Arriarán S, Agnelli S, Remesar X, Fernández-López JA, Alemany M. 2015b.Effects of
sex and site on amino acid metabolism enzyme gene expression and activity in rat white adipose tissue.PeerJ 3:e1399DOI 10.7717/peerj.1399.
Arriarán S, Agnelli S, Sabater D, Remesar X, Fernández-López JA, Alemany M. 2015c.
Evidences of basal lactate production in the main white adipose tissue sites of rats. Effects of sex and a cafeteria diet.PLoS ONE10:e0119572
DOI 10.1371/journal.pone.0119572.
Baviskar SN. 2011.A quick & automated method for measuring cell area using ImageJ.
American Biology Teacher73:554–556 DOI 10.1525/abt.2011.73.9.9.
Cahill GF. 1962.Metabolic role of adipose tissue.Transactions of the American Clinical
and Climatologic Association73:22–29.
Chmelar J, Chung KJ, Chavakis T. 2013.The role of innate immune cells in obese
adipose tissue inflammation and development of insulin resistance.Thrombosis and Haemostasis109:399–406DOI 10.1160/TH12-09-0703.
Choe SS, Huh JY, Hwang IJ, Kim JI, Kim JB. 2016.Adipose tissue remodeling: its role in
energy metabolism and metabolic disorders.Frontiers in Endocrinology7:Article 30
DOI 10.3389/fendo.2016.00030.
Cignarelli A, Perrini S, Ficarella R, Peschechera A, Nigro P, Giorgino F. 2012.Human
adipose tissue stem cells: relevance in the pathophysiology of obesity and metabolic diseases and therapeutic applications.Expert Reviews in Molecular Medicine14:e19
DOI 10.1017/erm.2012.13.
Cildir G, Akincilar SC, Tergaonkar V. 2013.Chronic adipose tissue inflammation: all
immune cells on the stage.Trends in Molecular Medicine19:487–500
DOI 10.1016/j.molmed.2013.05.001.
Cinti S. 2001.The adipose organ: morphological perspectives of adipose tissues.
Proceed-ings of the Nutrition Society60:319–328DOI 10.1079/PNS200192.
Da Silva Meirelles L, Maistro Malta T, Wagatsuma VMD, Viana Bonini Palma P, Goes Araújo A, Ribeiro Malmegrim KC, Morato de Oliveira F, Alexandre Panepucci
R, Araújo Silva W, Kashima Haddad S, Tadeu Covas D. 2015.Cultured human
adipose tissue pericytes and mesenchymal stromal cells display a very similar gene expression profile.Stem Cells and Development 24:2822–2840
DOI 10.1089/scd.2015.0153.
Deschênes D, Couture P, Dupont P, Tchernof A. 2003.Subdivision of the subcutaneous
adipose tissue compartment and lipid-lipoprotein levels in women.Obesity Research
11:469–476DOI 10.1038/oby.2003.64.
DiGirolamo M, Owens JL. 1976.Water content of rat adipose tissue and isolated
Dixit VD. 2008.Adipose-immune interactions during obesity and caloric restriction: reciprocal mechanisms regulating immunity and health span.Journal of Leukocyte Biology84:882–892DOI 10.1189/jlb.0108028.
Domergue S, Bony C, Maumus M, Toupet K, Frouin E, Rigau V, Vozenin MC, Magalon
G, Jorgensen C, Noel D. 2016.Comparison between stromal vascular fraction
and adipose mesenchymal stem cells in remodeling hypertrophic scars.PLoS ONE
11:e0156161DOI 10.1371/journal.pone.0156161.
Eder K, Reichlmayr-Lais AM, Kirchgeßner M. 1993.Studies on the extraction of
phos-pholipids from erythrocyte membranes in the rat.Clinica Chimica Acta219:93–104
DOI 10.1016/0009-8981(93)90200-N.
Fain JN, Madan AK. 2005.Insulin enhances vascular endothelial growth factor,
interleukin-8, and plasminogen activator inhibitor 1 but not interleukin-6 release by human adipocytes.Metabolism Clinical and Experimental54:220–226
DOI 10.1016/j.metabol.2004.08.016.
Folch J, Lees M, Sloane-Stanley GH. 1957.A simple method for the isolation and
purification of total lipides from animal tissues.Journal of Biological Chemistry
226:497–509.
Francendese AA, Digirolamo M. 1981.Alternative substrates for triacylglycerol synthesis
in isolated adipocytes of different size from the rat.Biochemical Journal194:377–384
DOI 10.1042/bj1940377.
Garfinkel A, Baker N, Schotz MC. 1967.Relationship of lipoprotein lipase activity to
triglyceride uptake in adipose tissue.Journal of Lipid Research8:274–280.
Garvey WT, Olefsky JM, Matthaei S, Marshall S. 1987.Glucose and insulin co-regulate
the glucose transport system in primary cultured adipocytes. A new mechanism of insulin resistance.Journal of Biological Chemistry262:189–197.
Gerner RR, Wieser V, Moschen AR, Tilg H. 2013.Metabolic inflammation: role of
cytokines in the crosstalk between adipose tissue and liver.Canadian Journal of Physiology and Pharmacology 91:867–872DOI 10.1139/cjpp-2013-0050.
Gimble JM, Bunnell BA, Chiu ES, Guilak F. 2011.Concise review: adipose-derived
stromal vascular fraction cells and stem cells: let’s not get lost in translation.Stem Cells29:749–754DOI 10.1002/stem.629.
Giovambattista A, Piermaría J, Suescun MO, Calandra RS, Gaillard RC, Spinedi E.
2006.Direct effect of ghrelin on leptin production by cultured rat white adipocytes.
Obesity 14:19–27DOI 10.1038/oby.2006.4.
Grégoire F, Todoroff G, Hauser N, Remacle C. 1990.The stroma-vascular fraction of rat
inguinal and epididymal adipose tissue and the adipoconversion of fat cell precursors in primary culture.Biology of the Cell69:215–222
DOI 10.1016/0248-4900(90)90348-7.
Guerre-Millo M. 2003.Extending the glucose/fatty acid cycle: a glucose/adipose tissue
cycle.Biochemical Society Transactions31:1161–1164DOI 10.1042/bst0311161.
Hall J, Roberts R, Vora N. 2009.Energy homeostasis: the roles of adipose tissue-derived
Hill AA, Bolus WR, Hasty AH. 2014.A decade of progress in adipose tissue macrophage biology.Immunological Reviews262:134–152DOI 10.1111/imr.12216.
Honnor RC, Dhillon GS, Londos C. 1985.cAMP-dependent protein-kinase and lipolysis
in rat adipocytes. 1. Cell preparation, manipulation, and predictability in behavior.
Journal of Biological Chemistry260:15122–15129.
Kajimoto K, Hossen MN, Hida K, Ohga N, Akita H, Hyodo M, Hida Y, Harashima H.
2010.Isolation and culture of microvascular endothelial cells from murine inguinal
and epididymal adipose tissues.Journal of Immunological Methods357:43–50
DOI 10.1016/j.jim.2010.03.011.
Killinger DW, Strutt BJ, Roncari DA, Khalil MW. 1995.Estrone formation from
dehydroepiandrosterone in cultured human breast adipose stromal cells.Journal of Steroid Biochemistry and Molecular Biology52:195–201
DOI 10.1016/0960-0760(94)00164-H.
Kotronen A, Seppänen-Laakso T, Westerbacka J, Kiviluoto T, Arola J, Ruskeepää AL,
Yki-Jarvinen H, Oresic M. 2010.Comparison of lipid and fatty acid composition
of the liver, subcutaneous and intra-abdominal adipose tissue, and serum.Obesity
18:937–944DOI 10.1038/oby.2009.326.
Lee J. 2013.Adipose tissue macrophages in the development of obesity-induced
in-flammation, insulin resistance and type 2 diabetes.Archives of Pharmacal Research
36:208–222DOI 10.1007/s12272-013-0023-8.
Leonhardt W, Hanefeld M, Haller H. 1978.The adipocyte volume in human adipose
tissue: 1. Lipid space, normal and maximum values, and the relation to body weight index.International Journal of Obesity 2:33–45.
Li QK, Hata A, Kosugi C, Kataoka N, Funaki M. 2010.The density of extracellular
matrix proteins regulates inflammation and insulin signaling in adipocytes.FEBS Letters584:4145–4150DOI 10.1016/j.febslet.2010.08.033.
Liu YJ, Aron-Wisnewsky J, Marcelin G, Genser L, Le Naour G, Torcivia A, Bauvois B,
Bouchet S, Pelloux V, Sasso M, Miette V, Tordjman J, Clement K. 2016.
Accumula-tion and changes in composiAccumula-tion of collagens in subcutaneous adipose tissue after bariatric surgery.Journal of Clinical Endocrinology and Metabolism101:293–304
DOI 10.1210/jc.2015-3348.
Lolmède K, Duffaut C, Zakaroff-Girard A, Bouloumie A. 2011.Immune cells in adipose
tissue: key players in metabolic disorders.Diabetes and Metabolism37:283–290
DOI 10.1016/j.diabet.2011.03.002.
Luche E, Sengenès C, Arnaud E, Laharrague P, Casteilla L, Cousin B. 2015.Differential
hematopoietic activity in white adipose tissue depending on its localization.Journal of Cellular Physiology230:3076–3083DOI 10.1002/jcp.25045.
Makkonen J, Westerbacka J, Kolak M, Sutinen J, Corner A, Hamsten A, Fisher RM,
Yki-Jarvinen H. 2007.Increased expression of the macrophage markers and of
Marshall S, Garvey WT, Miriam G. 1984.Primary culture of isolated adipocytes. A new model to study insulin receptor regulation and insulin action.Journal of Biological Chemistry259:6375–6384.
Mitterberger MC, Lechner S, Mattesich M, Zwerschke W. 2014.Adipogenic
differentia-tion is impaired in replicative senescent human subcutaneous adipose-derived stro-mal/progenitor cells.Journals of Gerontology69A:13–24DOI 10.1093/gerona/glt043.
Mjös OD, Akre S. 1971.Effect of chatecolamines on blood flow, oxygen consumption,
and release/uptake of free fatty acids in adipose tissue.Scandinavian Journal of Clinical and Laboratory Investigation27:221–225DOI 10.3109/00365517109080211.
Nawrocki AR, Scherer PE. 2005.The adipocyte as a drug discovery target.Drug Discovery
Today 10:1219–1230DOI 10.1016/S1359-6446(05)03569-5.
O’Brien SN, Mantzke KA, Kilgore MW, Price TM. 1996.Relationship between adipose
stromal-vascular cells and adipocytes in human adipose tissue.Analytical and Quantitative Cytology and Histology18:137–143.
Ogura F, Wakao S, Kuroda Y, Tsuchiyama K, Bagheri M, Heneidi S, Chazenbalk G,
Aiba S, Dezawa M. 2014.Human adipose tissue possesses a unique population of
pluripotent stem cells with nontumorigenic and low telomerase activities: potential implications in regenerative medicine.Stem Cells and Development 23:717–728
DOI 10.1089/scd.2013.0473.
Oishi Y, Manabe I. 2016.Integrated regulation of the cellular metabolism and function
of immune cells in adipose tissue.Clinical and Experimental Pharmacology and Physiology43:294–303DOI 10.1111/1440-1681.12539.
Oliva L, Baron C, Fernández-López J-A, Remesar X, Alemany M. 2015.Marked increase
in rat red blood cell membrane protein glycosylation by one-month treatment with a cafeteria diet.PeerJ3:e1101DOI 10.7717/peerj.1101.
Parker AM, Katz AJ. 2006.Adipose-derived stem cells for the regeneration of damaged
tissues.Expert Opinion on Biological Therapy6:567–578
DOI 10.1517/14712598.6.6.567.
Pasarica M, Sereda OR, Redman LM, Albarado DC, Hymel DT, Roan LE, Rood JC,
Burk DH, Smith SR. 2009.Reduced adipose tissue oxygenation in human
obesity-evidence for rarefaction, macrophage chemotaxis, and inflammation without and angiogenic response.Diabetes58:718–725DOI 10.2337/db08-1098.
Remesar X, Antelo A, Llivina C, Albà E, Berdié L, Agnelli S, Arriarán S,
Fernández-López JA, Alemany M. 2015.Influence of a hyperlipidic diet on the composition of
the non-membrane lipid pool of red blood cells of male female rats.PeerJ 3:e1083
DOI 10.7717/peerj.1083.
Robert M, Alemany M. 1981.Water compartments in the tissues of pentobarbital
anesthetized rats.IRCS Medical Science9:236–237.
Rodbell M. 1964.Metabolism of isolated fat cells. I. Effects of hormones on glucose
metabolism and lipolysis.Journal of Biological Chemistry 239:375–380.
Romero MM, Sabater D, Fernández-López JA, Remesar X, Alemany M. 2015.Glycerol
defense from excess substrate.PLoS ONE10:e0139502
DOI 10.1371/journal.pone.0139502.
Rose H, Oklander M. 1965.Improved procedure for the extraction of lipids from human
erythrocytes.Journal of Lipid Research6:428–431.
Sabater D, Arriarán S, Romero MM, Agnelli S, Remesar X, Fernández-López JA,
Alemany M. 2014.Cultured 3T3L1 adipocytes dispose of excess medium glucose as
lactate under abundant oxygen availability.Scientific Reports4:3663
DOI 10.1038/srep03663.
Sadie van Gijsen H, Smith W, Du Toit EF, Michie J, Hough FS, Ferris WF. 2012.
Depot-specific and hypercaloric diet-induced effects on the osteoblast and adipocyte differentiation potential of adipose-derived stromal cells.Molecular and Cellular Endocrinology348:55–66DOI 10.1016/j.mce.2011.07.030.
Sell H, Eckel J. 2010.Adipose tissue inflammation: novel insight into the role of
macrophages and lymphocytes.Current Opinion in Clinical Nutrition and Metabolic Care13:366–370 DOI 10.1097/MCO.0b013e32833aab7f.
Smith U. 1972.Studies of human adipose tissue in culture. I. Incorporation of glucose
and release of glycerol.Anatomical Record172:597–602DOI 10.1002/ar.1091720401.
Stimson RH, Andersson J, Andrew R, Redhead DN, Karpe F, Hayes PC, Olsson T,
Walker BR. 2009.Cortisol release from adipose tissue by 11β-Hydroxysteroid
Dehydrogenase type 1 in humans.Diabetes58:46–53DOI 10.2337/db08-0969.
Sumi M, Sata M, Toya N, Yanaga K, Ohki T, Nagai R. 2007.Transplantation of adipose
stromal cells, but not mature adipocytes, augments ischemia-induced angiogenesis.
Life Sciences80:559–565DOI 10.1016/j.lfs.2006.10.020.
Takahara K, Ii M, Inamoto T, Komura K, Ibuki N, Minami K, Uehara H, Hirano H,
Nomi H, Kiyama S, Asahi M, Azuma H. 2014.Adipose-derived stromal cells inhibit
prostate cancer cell proliferation inducing apoptosis.Biochemical and Biophysical Research Communications446:1102–1107DOI 10.1016/j.bbrc.2014.03.080.
Thompson ACS, Nuñez M, Davidson R, Horm T, Schnittker K, Hart MV, Suarez
AM, Tsao TS. 2012.Mitigation of isolation-associated adipocyte interleukin-6
secretion following rapid dissociation of adipose tissue.Journal of Lipid Research
53:2797–2805DOI 10.1194/jlr.D031286.
Tordjman K, Leingang K, Mueckler M. 1990.Differential regulation of the HepG2 and
adipocyte/muscle glucose transporters in 3T3L1 adipocytes. Effect of chronic glucose deprivation.Biochemical Journal271:201–207DOI 10.1042/bj2710201.
Vielma SA, Klein RL, Levingston CA, Young MRI. 2013.Adipocytes as immune
regula-tory cells.International Immunopharmacology16:224–231
DOI 10.1016/j.intimp.2013.04.002.
Villaret A, Galitzky J, Decaunes P, Esteve D, Marques MA, Sengenes C, Chiotasso P,
Tchkonia T, Lafontan M, Kirkland JL, Bouloumie A. 2010.Adipose tissue
en-dothelial cells from obese human subjects: differences among depots in angiogenic, metabolic, and inflammatory gene expression and cellular senescence.Diabetes
Wang MY, Gao MM, Liao JW, Qi YF, Du XM, Wang YH, Li L, Liu G, Yang HY. 2016.
Adipose tissue deficiency results in severe hyperlipidemia and atherosclerosis in the low-density lipoprotein receptor knockout mice.Biochimica et Biophysica Acta
1861:410–418DOI 10.1016/j.bbalip.2016.02.018.
Wisse BE. 2004.The inflammatory syndrome: the role of adipose tissue cytokines in
metabolic disorders linked to obesity.Journal of the American Society of Nephrology
15:2792–2800DOI 10.1097/01.ASN.0000141966.69934.21.
Wronska A, Kmiec Z. 2012.Structural and biochemical characteristics of various white
adipose tissue depots.Acta Physiologica205:194–208