www.atmos-chem-phys.net/13/11391/2013/ doi:10.5194/acp-13-11391-2013
© Author(s) 2013. CC Attribution 3.0 License.
Atmospheric
Chemistry
and Physics
Estimating the contribution of ion–ion recombination to sub-2 nm
cluster concentrations from atmospheric measurements
J. Kontkanen1, K. E. J. Lehtinen2, T. Nieminen1,3, H. E. Manninen1, K. Lehtipalo1,4, V.-M. Kerminen1, and M. Kulmala1
1Department of Physics, University of Helsinki, Helsinki, Finland
2Department of Applied Physics, University of Eastern Finland and Finnish Meteorological Institute, Kuopio, Finland 3Helsinki Institute of Physics, Helsinki, Finland
4Airmodus Oy, Helsinki, Finland
Correspondence to:J. Kontkanen ([email protected])
Received: 5 July 2013 – Published in Atmos. Chem. Phys. Discuss.: 9 August 2013 Revised: 16 October 2013 – Accepted: 24 October 2013 – Published: 25 November 2013
Abstract.The significance of ion–ion recombination for at-mospheric new particle formation is not well quantified. Here we present and evaluate a method for determining the size distribution of recombination products from the size distri-butions of neutral and charged clusters. Our method takes into account the production of recombination products in the collisions between oppositely charged ions and the loss due to coagulation. Furthermore, unlike previous studies, we also consider the effect of condensational growth on the size dis-tribution of recombination products. We applied our method to the data measured in Hyytiälä, Finland, to estimate the contribution of ion–ion recombination to the concentrations of atmospheric clusters in the size range of 0.9–2.1 nm. We observed that the concentration of recombination products was highest in the size classes between 1.5 and 1.9 nm. The median concentrations of recombination products were be-tween 6 and 69 cm−3in different size classes, which resulted in a small proportion of all neutral clusters, varying between 0.2 and 13 %. When examining the whole size range between 0.9 and 2.1 nm, the median fraction of recombination prod-ucts of all neutral clusters was only 1.5 %. We also investi-gated how the results change if the effect of condensational growth is neglected. It seems that with that assumption the fragmentation of newly formed recombination products has to be taken into account, or else the concentration of recom-bination products is overestimated. Overall, we concluded that our method provides reasonable results, which are con-sistent with the earlier estimates on the contribution of re-combination products to atmospheric cluster population in
Hyytiälä. Still, in order to determine the size distribution of recombination products more accurately in the future, more precise measurements of the size distribution of atmospheric clusters would be needed.
1 Introduction
New particle formation is, in terms of the particle number concentration, the dominant source of aerosol particles in the atmosphere (Spracklen et al., 2006; Yu et al., 2010). The pro-cess may also influence the Earth’s climate via the indirect climate effects of aerosol particles (Merikanto et al., 2009; Wang and Penner, 2009; Kazil et al., 2010; Kerminen et al., 2012; Makkonen et al., 2012). New particle formation in-cludes the production of nanometer-sized clusters from at-mospheric vapors and the growth of the clusters to larger particles. Although recent studies have provided new insight into the first steps of new particle formation, the picture is still not complete (Zhang et al., 2012; Kulmala et al., 2013). To understand the details of new particle formation better, more knowledge of the dynamics of neutral and charged clus-ters in the atmosphere is needed.
conditions has been widely studied (e.g. Nolan, 1941; Mc-Gowan, 1965; Biondi, 1968; Bates, 1985; Hoppel and Frick, 1986; Sorokin and Mirabel, 2001; Tammet et al., 2006). More recently, researchers have also attempted to estimate the importance of ion–ion recombination for atmospheric new particle formation (e.g. Turco et al., 1998). Kulmala et al. (2007) introduced a method to determine the concen-tration of recombination products from ion size distribution measurements. They concluded that ion–ion recombination has only a minor contribution to particle formation in bo-real forest conditions. Subsequently, other studies using the same approach have obtained similar results (Manninen et al., 2009a; Lehtipalo et al., 2009). Kulmala et al. (2013) were the first to determine the concentration of recombina-tion products in different size classes in the sub-2 nm size range. Thus, they were able to show that in all those size classes the proportion of recombination products of all clus-ters is small in boreal forest. However, the model studies by Yu and Turco (2008) suggest that ion–ion recombination is much more significant than indicated by the measurements.
Although the importance of recombination has been es-timated from measurements in several studies, the applied methods have not been properly evaluated. In addition, the effect of condensational growth on the size distribution of recombination products has not been included in the calcula-tions. Hence, in this paper, we present and evaluate a method to determine the size distribution of recombination prod-ucts from measurements by considering the production of recombination products in the collisions between oppositely charged ions, the loss by coagulation and the loss and gain due to condensational growth. First, we derive the equation for the concentration of recombination products in a certain size range. Then, we show how the production and loss rates of recombination products can be calculated from the mea-sured data. We also apply our method to the data meamea-sured in Hyytiälä, Finland, to assess the role of ion–ion recombination in the dynamics of sub-2 nm neutral and charged clusters. Fi-nally, we examine the sensitivity of our method to uncertain-ties related to the effect of condensational growth.
2 Methods
2.1 Measurements
The measurements were carried out between 14 March and 10 May 2011 at the SMEAR II station (Station for Mea-suring Forest Ecosystem-Atmosphere Relations) in Hyytiälä, southern Finland (61◦51′N, 24◦17′E; 181 m above sea level)
(Hari and Kulmala, 2005). The total concentration of neu-tral and charged clusters in six equally spaced size classes ranging from 0.9 to 2.1 nm in mobility diameter was mea-sured with the Airmodus A09 particle size magnifier (PSM; Vanhanen et al., 2011). The ion concentrations in the same size classes were measured with the Neutral cluster and Air
Ion Spectrometer (NAIS; Manninen et al., 2009b; Mirme and Mirme, 2013). By subtracting ion concentration from the to-tal concentration, we also obtained the concentration of neu-tral clusters in different size classes. Due to the measure-ment uncertainties of both PSM and NAIS, the lowest reli-able values of neutral cluster concentration were estimated to be 100–200 cm−3. In addition to PSM and NAIS data, we used particle size distributions continuously measured at the station between 3 and 1000 nm with the twin-DMPS (dif-ferential mobility particle sizer) system (Aalto et al., 2001). For the more detailed description of the performed measure-ments, see Kulmala et al. (2013).
2.2 Determining the size distribution of recombination products
2.2.1 Equation for the concentration of recombination products
Here we derive an expression for the concentration of neutral clusters due to ion–ion recombination,Nrec. The time evolu-tion of the concentraevolu-tion of recombinaevolu-tion products in a cer-tain size rangei can be described by the balance equation
dNrec,i dt =λiα
P
j,k
rij kNj+Nk−−2βNrec,iP
j
Nj±
−CoagSiNrec,i+N1Drec,i−p1GRi−1−N1Drec,ipGRi+Qi.
(1)
Here αis the ion–ion recombination coefficient and β the
ion-neutral attachment coefficient for which the values of 1.6×10⁻⁶cm3s−1and 0.01×10⁻⁶cm3s−1are used
(Hop-pel and Frick, 1986; Tammet and Kulmala, 2005). However, it has to be noted that, in reality, these coefficients may not be constant but depend on the properties of colliding ions or particles and environmental conditions (Bates, 1985; Hoppel and Frick, 1986). The coefficientλi describes the fraction
of stable recombination products that does not fragment in-stantly after their formation in size classi.Nj+andNk−refer to the concentrations of the positive and negative ions in size ranges j andk, respectively, andrij k tells how large
frac-tion of the recombinafrac-tion products formed in their collisions will end up in size classi. CoagSi denotes the average
co-agulation sink for size rangei. GRi−1and GRi refer to the
growth rates of clusters in size rangesi–1 andidue to
con-densation, and1Dpis the width of the size range. Finally,
Qi denotes the source of clusters to size classi originating
from the break-ups of larger clusters formed by recombina-tion. Note that the summations in the first two terms on the right-hand side go through the ion size classes.
of the size class (the fourth and the fifth terms). In addition, the last term allows for the possibility that breaking up of larger recombination products may produce clusters into size rangei.
In order to estimate the concentration of recombination products from Eq. (1), we first simplify the equation by ne-glecting the last term describing the production of clusters due to breaking up of larger clusters. This simplification may cause errors in the smallest size classes, but the effect on the final results is likely to be only minor. Now, by defining the plain production rate of neutral clusters by recombination as
Rr,i=α
X
j,k
rij kNj+N
−
k , (2)
we may write Eq. (1) as dNrec,i
dt =λiRr,i−2βNrec,i
P
j
Nj±−CoagSiNrec,i
−GRi 1Dp
1−GRi−1 GRi
Nrec,i−1 Nrec,i
Nrec,i.
(3)
In pseudo-steady state, Eq. (3) becomes
Nrec,i=
λiRr,i
CoagSi+2βP
j
Nj±+ GRi
1Dp
1−GRi−1 GRi
Nrec,i−1 Nrec,i
. (4)
Now, let us examine the magnitudes of different terms in the denominator of Eq. (4). From the particle size distri-butions measured during spring 2011 in Hyytiälä, we ob-tain that the average coagulation sink for the clusters in the size range of 1–2 nm (CoagS) was 10−3s−1. From the NAIS data measured at the same time, we get the average ion concentration,P
j
Nj±, of 800 cm−3and consequently the term describing the loss of neutral clusters due to charging (2βP
j
Nj±)is equal to 1.6×10⁻⁵s−1. Thus, we may notice that CoagSi≫2βP
j
Nj±, and Eq. (4) can be written as
Nrec,i=
λiRr,i
CoagSi+1DGRip
1−GRi−1 GRi
Nrec,i−1 Nrec,i
. (5) By considering typical air ion concentrations in the atmo-sphere (Hirsikko et al., 2011), and estimating the variation of coagulation sink based on the reported aerosol number size distributions (Raes et al., 2000), we may conclude that Eq. (5) should be generally valid in the lower troposphere.
From Eq. (5) we can see that the effect of condensational growth on the recombination product concentration depends on the rates at which the concentration of recombination products and cluster growth rate change with the increasing cluster size. However, by assuming that the condensational flux of recombination products to the smallest size class is negligible, we end up with a recursive algorithm that allows for the solution ofNrec,iin an analytical form. This requires,
however, that we know the cluster growth rate both in size classiand in the size class preceding it, which is rarely the case. Thus, we can either assume certain growth rates for the examined size classes and calculate the concentration of re-combination products from Eq. (5), or then we can assume that the effect of condensational growth on the recombina-tion product concentrarecombina-tion is negligible compared with co-agulation sink. With the latter assumption the equation for the concentration of recombination products in size classiis reduced to the form
Nrec,i=
λiRr,i
CoagSi. (6)
In previous studies (e.g. Kulmala et al., 2013) Eq. (6) has been used to calculate the concentration of recombination products. In this study we first present the results obtained when calculating the concentration of recombination prod-ucts in different size classes between 0.9 and 2.1 nm from Eq. (5), which includes the condensational growth term. Af-ter that we examine closer how the changes in the growth rates, or neglecting the condensational growth term and us-ing Eq. (6), affect the results.
2.2.2 Calculating the production and loss rates of recombination products
According to Eq. (5), the concentration of recombination products in a certain size range is determined by the pro-duction of them in the collisions between oppositely charged ions (the term in the numerator), the loss by coagulation (the first term in the denominator) and the gain and loss due to the condensational growth into the size range and out of the size range (the second term in the denominator). The loss due to coagulation, described by the coagulation sink (CoagSi), we
can calculate from particle size distributions (Kulmala et al., 2001). The estimates for growth rates (GRi), needed for the
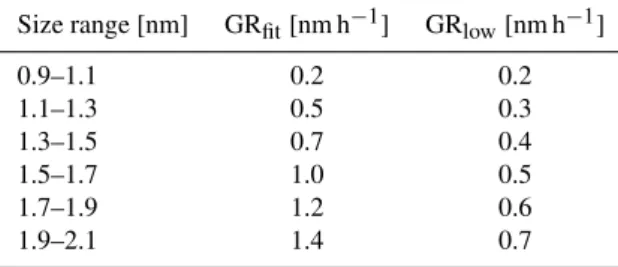
condensational growth term, we can obtain from cluster di-ameter vs. time data presented by Kulmala et al. (2013). The values for growth rates in each size class can be obtained by fitting the data with a third-degree polynomial and differenti-ating (Table 1). However, to calculate the production rate of recombination products, we need to know both the value of the coefficientλi, representing the fraction of stable
recom-bination products, and the plain production rate of neutral clusters by recombination,Rr,i.
Let us first determine the plain production rate of neutral clusters by recombination,Rr,i. From Eq. (2) we can see that
Rr,i in size classidepends on the concentrations of positive
and negative ions,Nj+ andNk−, that form a neutral cluster to that size class when colliding with each other. We can get
Table 1.Growth rates for different size classes between 0.9 and
2.1 nm. GRfit shows the growth rates obtained by fitting a
third-degree polynomial to experimental data, and differentiating. GRlow
shows the growth rates used for analyzing the sensitivity of the re-sults to the changes in the growth rates.
Size range [nm] GRfit[nm h−1] GRlow[nm h−1]
0.9–1.1 0.2 0.2
1.1–1.3 0.5 0.3
1.3–1.5 0.7 0.4
1.5–1.7 1.0 0.5
1.7–1.9 1.2 0.6
1.9–2.1 1.4 0.7
mobility bins to mass bins by using a relationship between ion mobility and mass presented by Mäkelä et al. (1996):
Z=exp−0.0347(ln(m))2−0.0376 ln(m)+1.4662. (7)
HereZis the electrical mobility in cm2V−1s−1andmthe
ion mass in amus. Equation (7) is based on the data by Kil-patrick et al. (1971) for ions in nitrogen. The data have been commonly used in conversions between mobility and mass, although the applicability of the data under atmospheric con-ditions has been questioned (e.g. Böhringer et al., 1987; Tam-met, 1995). In addition, the relationship between ion mobil-ity and mass may in realmobil-ity depend on the polarmobil-ity (Swider, 1988). For the comparison of the relationship between mass, mobility and diameter determined by using different meth-ods, see Ehn et al. (2011).
The mass ranges corresponding to the mobility ranges of different NAIS channels according to Eq. (7) are presented in Table 2. From the mass ranges of different channels we can determine the lower and upper limits for the masses of re-combination products formed in the collisions between ions from different channels. This can be done for each pair of re-combining ions by adding up their smallest possible masses and their largest possible masses. The mass limits of the re-combination products can then be converted to mobilities by using Eq. (7). Thereafter, we may convert the mobilities into mobility diameters using the modified Stokes–Millikan equation, which takes into account the finite mass of the par-ticle (Tammet, 1995; Ehn et al., 2011):
dp=q 1
1+mgm
qCc(dp)
3π µZ . (8)
Heredp denotes the mobility diameter,mg the mass of an air molecule andmthe mass of the particle.qis the number of electrical charges in the particle,µis the dynamic viscos-ity of air and Z the electric mobility of the particle. Cc is the slip correction factor taking into account non-continuum effects, which become important at small sizes. Note that in earlier studies (e.g. Kulmala et al., 2013) mobilities have
been converted to diameters according to the original form of Stokes–Millikan equation, which does not include the mass-dependent factor on the right-hand side of Eq. (8).
Table 3 shows the mass and diameter limits of the recom-bination products for the pairs of recombining ions from dif-ferent NAIS channels. From the diameter limits we are able to resolve the contribution of different ion pairs Nj+Nk− to the production rate of neutral clusters by recombination in size classi.
This we can do by determining for each pair of ions the factorrij k, which describes how large fraction of the
recom-bination products of that ion pair will end up in size classi.
The value for the factorrij kcan be resolved for each ion pair
Nj+Nk− by calculating how large fraction of the size range
of their recombination products overlaps with size class i.
Finally, we can calculate the plain production rate of neu-tral clusters by recombination,Rr,i, for each size class from
Eq. (2).
After calculating the plain production rate,Rr,i, for each
size class, we can estimate the maximum fraction of stable recombination products,λmax,i, from the measured size
dis-tributions of neutral and charged clusters by using the method presented by Kulmala et al. (2013). The first step in the anal-ysis is to calculate the concentration of recombination prod-ucts in size classifrom Eq. (5) or Eq. (6) by setting the value ofλi to unity. Furthermore, the total neutral cluster
concen-tration in size class i can be calculated by subtracting the
ion concentration,Nions,i, from the total concentration,Ntot,i.
After that we can estimate the maximum value of the coef-ficientλi by assuming that the concentration of
recombina-tion products cannot exceed the concentrarecombina-tion of all neutral clusters. Thus, this method can reveal the maximum value of the coefficientλi only if the recombination product
concen-trations obtained withλ=1 are occasionally clearly higher than the total neutral cluster concentrations. In other cases we must assume that the coefficientλi equals unity when
esti-mating the maximum contribution of ion–ion recombination to cluster concentrations. The value of unity for the coeffi-cientλihas also been used in several earlier studies (Kulmala
et al., 2007; Lehtipalo et al., 2009; Manninen et al., 2009a).
3 Results and discussion
3.1 Contribution of ion–ion recombination to cluster concentrations
By using the method described above, we calculated the plain production rate of neutral clusters by recombination,
Table 2.The mobility and mass ranges of the NAIS channels.
Channel Mean mobility Mobility upper Mobility lower Mass lower Mass upper
[cm2V−1s−1] limit [cm2V−1s−1] limit [cm2V−1s−1] limit [amu] limit [amu]
1 3.160 3.649 2.737 6 23
2 2.370 2.737 2.054 23 62
3 1.780 2.054 1.539 62 141
4 1.330 1.539 1.153 141 287
5 1.000 1.153 0.866 287 540
6 0.750 0.866 0.649 540 967
7 0.562 0.649 0.487 967 1658
8 0.422 0.487 0.365 1658 2748
9 0.316 0.365 0.274 2748 4431
10 0.237 0.274 0.205 4431 6958
11 0.178 0.205 0.154 6958 10 732
12 0.133 0.154 0.115 10 732 16 239
13 0.100 0.115 0.087 16 239 24 117
14 0.075 0.087 0.065 24 117 35 392
15 0.056 0.065 0.049 35 392 51 232
16 0.042 0.049 0.037 51 232 73 335
17 0.032 0.037 0.027 73 335 103 937
18 0.024 0.027 0.021 103 937 145 623
19 0.018 0.021 0.015 145 623 202 646
20 0.013 0.015 0.012 202 646 279 487
21 0.010 0.012 0.009 279 487 381 732
22 0.008 0.009 0.006 381 732 518 621
23 0.006 0.006 0.005 518 621 699 462
24 0.004 0.005 0.004 699 462 937 801
25 0.003 0.004 0.003 937 801 1 250 695
26 0.002 0.003 0.002 1 250 695 1 656 311
27 0.002 0.002 0.002 1 656 311 2 185 970
28 0.001 0.002 0.001 2 185 970 2 877 563
1e−4 1e−3 1e−2 1e−1 1
0.9−1.1 nm 1.1−1.3 nm 1.3−1.5 nm 1.5−1.7 nm 1.7−1.9 nm 1.9−2.1 nm
Recombination production rate [cm
−3 s −1]
Fig. 1. The production rate of neutral clusters by recombination in different size classes. The red lines show the medians, the blue boxes indicate the 25th and 75th percentiles, and the vertical bars show the 5th and 95th percentiles.
rates were obtained in the smallest (0.9–1.1 nm) and the largest (1.9–2.1 nm) size classes in which the median val-ues were 9×10⁻³cm−3s−1and 7×10⁻³cm−3s−1,
respec-tively. Manninen et al. (2009a) estimated that in Hyytiälä the median production rate of neutral clusters by recombination is 5×10⁻²cm−3s−1in the size range of 2–3 nm. However, the difference in the studied size range makes it difficult to compare our results with those of Manninen et al. (2009a).
Table 3.The mass and size ranges of the recombination products formed in the collisions of different ion pairs. N and P refer to the negative and positive ions and the numbers from 1 to 7 to the different NAIS channels shown in Table 2.
Ion pairs Rec. products mass Rec. products mass Mobility diameter Mobility diameter
lower limit [amu] upper limit [amu] lower limit [nm] upper limit [nm]
N1+P1 12 46 0.47 0.80
N1+P2, N2+P1 29 85 0.68 0.97
N2+P2 46 124 0.80 1.09
N1+P3, N3+P1 68 164 0.91 1.17
N3+P2, N2+P3 85 203 0.97 1.24
N3+P3 124 282 1.09 1.35
N1+P4, N4+P1 147 310 1.14 1.39
N2+P4, N4+P2 164 349 1.17 1.43
N3+P4, N4+P3 203 428 1.24 1.51
N1+P5, N5+P1 293 563 1.35 1.62
N4+P4 282 574 1.37 1.63
N2+P5, N5+P2 310 602 1.39 1.65
N3+P5, N5+P3 349 681 1.43 1.70
N4+P5, N5+P4 428 827 1.51 1.79
N5+P5 574 1080 1.61 1.88
N1+P6, N6+P1 546 990 1.62 1.90
N2+P6, N6+P2 563 1029 1.63 1.93
N3+P6, N6+P3 602 1108 1.65 1.94
N4+P6, N6+P4 681 1254 1.70 2.01
N5+P6, N6+P5 827 1507 1.79 2.12
N6+P6 1080 1934 1.87 2.18
N1+P7, N7+P1 973 1681 1.88 2.20
N2+P7, N7+P2 990 1720 1.90 2.22
N3+P7, N7+P3 1029 1799 1.93 2.27
N4+P7,N7+P4 1108 1945 1.94 2.28
N5+P7, N7+P5 1254 2198 2.01 2.36
N6+P7, N7+P6 1507 2625 2.12 2.48
N7+P7 1934 3316 2.18 2.53
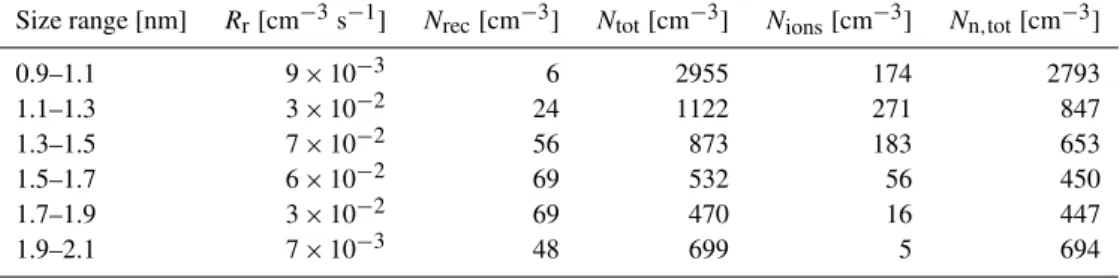
Table 4.The median values for the recombination production rate (Rr)and the concentrations of recombination products (Nrec), all clusters
(Ntot), charged clusters (Nions)and all neutral clusters (Nn,tot)in six size classes between 0.9 and 2.1 nm.
Size range [nm] Rr[cm−3s−1] Nrec[cm−3] Ntot[cm−3] Nions[cm−3] Nn,tot[cm−3]
0.9–1.1 9×10⁻³ 6 2955 174 2793
1.1–1.3 3×10⁻² 24 1122 271 847
1.3–1.5 7×10⁻² 56 873 183 653
1.5–1.7 6×10⁻² 69 532 56 450
1.7–1.9 3×10⁻² 69 470 16 447
1.9–2.1 7×10⁻³ 48 699 5 694
After calculating the plain production rate of neutral clus-ters by recombination,Rr, we calculated the concentration of recombination products in different size classes from Eq. (5) by assuming that the coefficientλ, describing the fraction of stable recombination products, equals unity in all size classes. When comparing the obtained concentrations to the concentrations of all neutral clusters following the method by Kulmala et al. (2013), we noticed that the concentrations of recombination products did not significantly exceed the
con-centrations of all neutral clusters in any of the size classes. Thus, we may assume thatλ=1 in all size classes when
0.01 0.1 1 10 100 1000
0.9−1.1 nm 1.1−1.3 nm 1.3−1.5 nm 1.5−1.7 nm 1.7−1.9 nm 1.9−2.1 nm
Nrec
[cm
−3
]
Fig. 2. The concentration of recombination products in different size classes. The red lines show the medians, the blue boxes in-dicate the 25th and 75th percentiles, and the vertical bars show the 5th and 95th percentiles.
concentration was 69 cm−3. The lowest concentration was observed in the smallest size class (0.9–1.1 nm) with the me-dian value of 6 cm−3.
The fraction of recombination products of all neutral clus-ters is depicted in Fig. 3 for different size classes. The median fraction was lowest, 0.2 %, in the smallest size class (0.9– 1.1 nm). The median fraction was highest, 13 %, in the size classes between 1.5 and 1.9 nm. When looking at the whole size range between 0.9 and 2.1 nm, the median fraction of re-combination products of all neutral clusters was only 1.5 %. Thus, it seems that on average the contribution of ion–ion recombination to neutral cluster concentrations is low com-pared to other particle formation mechanisms. Furthermore, it has to be noted that in reality the proportion of recombi-nation products of all neutral clusters is likely even smaller than obtained with our analysis, as we did not take into ac-count the fragmentation of recombination products.
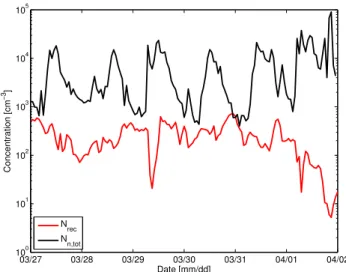
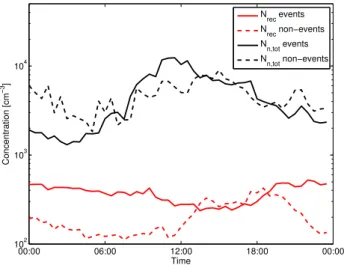
From Fig. 3 it can also be noticed that the fraction of re-combination products of all neutral clusters had a strong tem-poral variation during the measurement period, making the ranges from 25th to 75th percentiles wide. The strong varia-tion in the concentravaria-tion of recombinavaria-tion products and their contribution to cluster concentrations can also been seen in Fig. 4, where the time series for the concentrations of recom-bination products and all neutral clusters between 0.9 and 2.1 nm are presented. In addition, Fig. 4 shows that the re-combination product concentration did not have a similar di-urnal cycle as the total neutral cluster concentration, which increased strongly during daytime. The reason for the differ-ence is that the concentration of recombination products de-pends mainly on relatively stable ion concentrations, whereas the total neutral cluster concentration increases when there is new particle formation taking place. This can be seen in Fig. 5 as well, where the median diurnal variations of the
con-0.001 0.01 0.1 1 10 100
0.9−1.1 nm 1.1−1.3 nm 1.3−1.5 nm 1.5−1.7 nm 1.7−1.9 nm 1.9−2.1 nm
Nrec /Nn,tot
x100% [%]
Fig. 3.The percentage of recombination products of all neutral clus-ters in different size classes. The red lines show the medians, the blue boxes indicate the 25th and 75th percentiles, and the vertical bars show the 5th and 95th percentiles.
03/27 03/28 03/29 03/30 03/31 04/01 04/02
100 101 102 103 104 105
Concentration [cm
−3]
Date [mm/dd] Nrec
Nn,tot
Fig. 4.The concentrations of recombination products (Nrec)and all
neutral clusters (Nn,tot)in the size range of 0.9–2.1 nm during the
period 27 March–1 April 2011. The recombination product concen-tration exceeded the concenconcen-tration of all neutral clusters briefly on 30 March because the total neutral cluster concentration data did not cover the whole size range at that time.
centrations of recombination products and all neutral clusters are depicted for new particle formation event and non-event days. Figure 5 also shows that the concentration of recombi-nation products was on average slightly higher on new parti-cle formation event days than on non-event days, except for the afternoon hours.
00:00 06:00 12:00 18:00 00:00 102
103 104
Time
Concentration [cm
−3]
Nrec events Nrec non−events Nn,tot events Nn,tot non−events
Fig. 5.The median diurnal variations of the concentrations of
re-combination products (Nrec)and all neutral clusters (Nn,tot)in the
size range of 0.9–2.1 nm on new particle formation event and non-event days.
fraction of sub-2 nm neutral clusters observed in Hyytiälä originates from ion–ion recombination. By measuring the concentrations of sub-3 nm particles at the same site, Lehti-palo et al. (2009) observed that the fraction of recombination products of all neutral clusters is on average low (∼5 %) but varies a lot from day to day. Furthermore, the comparison between the formation rates of neutral clusters due to ion– ion recombination and the total particle formation rates indi-cates that ion–ion recombination has only minor contribution to particle formation in boreal forest (Kulmala et al., 2007; Manninen et al., 2009a). However, the model simulations by Yu and Turco (2008) suggest much greater significance for recombination than the studies based on field measurements. This discrepancy illustrates the fact that the details of the dy-namics of sub-3 nm charged and neutral clusters are still not well known. This makes both the modeling and the theoret-ical calculations of the ion–ion recombination process chal-lenging. In addition, the uncertainties in measuring the size distributions of neutral and charged clusters in this size range are also relatively large. For more discussion about the role of ion-mediated processes in atmospheric new particle for-mation, see Hirsikko et al. (2011).
3.2 Sensitivity of the method to uncertainties of the condensational growth effect
In Sect. 2.2.1 we noted that we can calculate the concentra-tion of recombinaconcentra-tion products from Eq. (5) only if we know the growth rates of clusters in each size class. Otherwise, we need to neglect the effect of condensational growth and cal-culate the recombination product concentration from Eq. (6). In this study, we solved this problem by using the average growth rates for new particle formation periods presented by
Kulmala et al. (2013). However, in reality, these growth rates may not be representative regarding the whole measurement period, which also includes time periods with no new particle formation. Thus, in this section we aim to assess how sensi-tive the obtained results are to uncertainties in the growth rates. Furthermore, we examine how the results change if we assume that the condensational growth term is negligible and calculate the concentration of recombination products from Eq. (6) as has been done in earlier studies (Lehtipalo et al., 2009; Kulmala et al., 2013).
To evaluate the sensitivity of our results to the changes in the growth rates, we examined how the results change if the growth rate increases with the increasing cluster size more slowly than shown in the data by Kulmala et al. (2013). The growth rates assumed for different size classes in this analysis are presented in Table 1, and the fractions of recom-bination products of all neutral clusters obtained with these growth rates are illustrated in Fig. 6a. We can see that the dis-tribution of the fraction of recombination products looks very similar to the distribution obtained with the more strongly in-creasing growth rate shown by Fig. 3. The only difference is that with the more gradually increasing growth rate the frac-tion of recombinafrac-tion products reached slightly higher val-ues. The highest median fraction obtained in the size classes between 1.5 and 1.9 nm was 17 %. Thus, it seems that also in the conditions where the cluster growth accelerates more slowly than is typical during new particle formation events, most of the neutral clusters observed in Hyytiälä originate from other processes than ion–ion recombination.
To examine how the results change if the effect of densational growth is neglected, we also calculated the con-centration of recombination products in different size classes from Eq. (6). However, in this case we noticed that it is not reasonable to assume that the coefficientλ, describing the fraction of stable recombination products, equals unity be-cause the concentrations of recombination products obtained with λ=1 were often larger than the total neutral cluster concentrations. Thus, we determined the maximum value for the coefficient,λmax, by using the method presented by Kul-mala et al. (2013). For the smallest size class (0.9–1.1 nm)
coefficientλwas not assumed to equal 1, as was done when the condensational growth term was included in the calcu-lations. In fact, it seems that if the effect of condensational growth is neglected but the value of the coefficientλis still assumed to equal 1, as was the case for example in Lehtipalo et al. (2009), the concentration of recombination products is probably overestimated.
4 Summary and conclusions
In this paper, we presented and evaluated a method for deter-mining the size distribution of recombination products from the measured size distributions of charged and neutral clus-ters. This method takes into account the production of re-combination products in the collisions between oppositely charged ions and the loss of them by coagulation. In addi-tion, contrary to earlier studies, the loss and gain of recom-bination products due to condensational growth are also con-sidered. We applied our method to the size distribution data measured in Hyytiälä, Finland, during spring 2011. From that data we determined the production rate of neutral clusters by ion–ion recombination and the concentration of recom-bination products in six equally spaced size classes between 0.9 and 2.1 nm. In addition, the proportion of recombination products of all neutral clusters was investigated.
The recombination production rate was highest in the size classes between 1.3 and 1.7 nm and lowest in the small-est (0.9–1.1 nm) and the largsmall-est (1.9–2.1 nm) size classes. The median recombination production rates varied between 7×10⁻³cm−3s−1 and 7×10⁻²cm−3s−1in different size
classes. The concentration of recombination products had a maximum in the size classes between 1.5 and 1.9 nm in which the median concentration was 69 cm−3. The concen-tration was lowest in the smallest size class (0.9–1.1 nm) with the median value of 6 cm−3.
On average, recombination products accounted only for 1.5 % of all neutral clusters in the size range of 0.9–2.1 nm during the measurement period. However, the fraction of re-combination products of all neutral clusters varied depending on the examined size class. The median fraction of recombi-nation products was lowest, 0.2 %, in the smallest size class (0.9–1.1 nm), and highest, 13 %, in the size classes between 1.5 and 1.9 nm. The temporal variation of the fraction was also strong. The results are in agreement with earlier studies where a minor contribution of recombination products to the neutral cluster population was observed using particle size distribution data from Hyytiälä (Lehtipalo et al., 2009; Kul-mala et al., 2013). Still, it has to be noted that in those stud-ies the effect of condensational growth on the recombination product size distribution has been neglected. In this study, however, we included the condensational growth effect in our calculations by estimating the cluster growth rates from the data presented by Kulmala et al. (2013).
0.001 0.01 0.1 1 10 100
0.9−1.1 nm 1.1−1.3 nm 1.3−1.5 nm 1.5−1.7 nm 1.7−1.9 nm 1.9−2.1 nm
Nrec
/N
n,tot
x100% [%]
0.001 0.01 0.1 1 10 100
0.9−1.1 nm 1.1−1.3 nm 1.3−1.5 nm 1.5−1.7 nm 1.7−1.9 nm 1.9−2.1 nm
Nrec
/N
n,tot
x100% [%]
Fig. 6.The percentage of recombination products of all neutral clus-ters in different size classes (top) when assuming that the cluster growth rate increases more slowly with the increasing size than shown by experimental data (bottom) when the effect of
conden-sational growth is neglected and the coefficientλis not assumed to
equal 1. The red lines show the medians, the blue boxes indicate the 25th and 75th percentiles, and the vertical bars show the 5th and 95th percentiles.
obtained lower values for the fraction of recombination prod-ucts of all neutral clusters than when the effect of condensa-tional growth was taken into account.
Overall, our method can be assumed to provide a reason-able maximum estimate of the contribution of recombination products to atmospheric cluster concentrations. In the light of our results, it seems that the effect of condensational growth on the size distribution of recombination products should not be neglected, provided that the values for the cluster growth rates are known. Thus, determining the size distribution of recombination products more accurately in the future would require more precise measurements of the size distributions of atmospheric clusters. In addition, the dependency of the recombination coefficient on environmental conditions, es-pecially on temperature, and on the masses of colliding ions should be understood better so that it could be included in the calculations. Finally, more knowledge of the fragmenta-tion of recombinafragmenta-tion products would be needed to establish how important ion–ion recombination truly is for the dynam-ics of atmospheric clusters.
Acknowledgements. The financial support from a European Re-search Council (ERC) Advanced Grant (ATM-NUCLE, 227463), the Academy of Finland Centre of Excellence program (project no. 1118615), and the Nordic Top-level Research Initiative (TRI) Cryosphere-Atmosphere Interactions in a Changing Arctic Climate (CRAICC) is gratefully acknowledged.
Edited by: S. M. Noe
References
Aalto, P. P., Hämeri, K., Becker, E., Weber, R., Salm, J., Mäkelä, J. M., Hoell, C., O’Dowd, C. D., Karlsson, H., Hansson, H., Väkevä, M., Koponen, I., Buzorius, G., and Kulmala, M.: Physi-cal characterization of aerosol particles during nucleation events, Tellus B, 53, 344–358, 2001.
Bates, D. R.: Ion–ion recombination in an ambient gas, Adv. Atomic Molecular Phys., 20, 1–40, 1985.
Biondi, M.: Atmospheric electron-ion and ion-ion recombination processes, Can. J. Chem., 47, 1711–1719, 1968.
Böhringer, H., Fahey, D. W., Lindinger, W., Howorka, F., Fehsen-feld, F. C., and Albritton, D. L.: Mobilities of several mass-identified positive and negative ions in air, Int. J. Mass Spectrom. Ion Proc., 81, 45–65, 1987.
Ehn, M., Junninen, H., Schobesberger, S., Manninen, H. E. , Franchin, A., Sipilä, M., Petäjä, T., Kerminen, V.–M., Tam-met, H., Mirme, A., Mirme, S., Hõrrak, U., Kulmala, M., and Worsnop, D. R.: An instrumental comparison of mobility and mass measurements of atmospheric small ions, Aerosol Sci. Technol., 45, 4, 522–532, 2011.
Hari, P. and Kulmala, M.: Station for Measuring Ecosystem– Atmosphere Relations (SMEAR II), Boreal Environ. Res., 10, 315–322, 2005.
Hirsikko, A., Nieminen, T., Gagné, S., Lehtipalo, K., Manninen, H. E., Ehn, M., Hõrrak, U., Kerminen, V.-M., Laakso, L., McMurry,
P. H., Mirme, A., Mirme, S., Petäjä, T., Tammet, H., Vakkari, V., Vana, M., and Kulmala, M.: Atmospheric ions and nucle-ation: a review of observations, Atmos. Chem. Phys., 11, 767– 798, doi:10.5194/acp-11-767-2011, 2011.
Hoppel, W. A. and Frick, G. M.: Ion-aerosol attachment coefficients and the steady-state charge distribution on aerosols in a bipolar ion environment, Aerosol Sci. Technol., 5, 1–21, 1986.
Kazil, J., Stier, P., Zhang, K., Quaas, J., Kinne, S., O’Donnell, D., Rast, S., Esch, M., Ferrachat, S., Lohmann, U., and Feichter, J.: Aerosol nucleation and its role for clouds and Earth’s ra-diative forcing in the aerosol-climate model ECHAM5-HAM, Atmos. Chem. Phys., 10, 10733–10752, doi:10.5194/acp-10-10733-2010, 2010.
Kerminen, V.-M., Paramonov, M., Anttila, T., Riipinen, I., Foun-toukis, C., Korhonen, H., Asmi, E., Laakso, L., Lihavainen, H., Swietlicki, E., Svenningsson, B., Asmi, A., Pandis, S. N., Kul-mala, M., and Petäjä, T.: Cloud condensation nuclei production associated with atmospheric nucleation: a synthesis based on ex-isting literature and new results, Atmos. Chem. Phys., 12, 12037– 12059, doi:10.5194/acp-12-12037-2012, 2012.
Kilpatrick, W. D.: An experimental mass-mobility relation for ions in air at atmospheric pressure, Proc. 19th Annu. Conf. Mass. Spectrosc., 2–7 May 1971, Atlanta, 320–325, 1971.
Kulmala, M., Dal Maso, M., Mäkelä, J. M., Pirjola, L., Väkevä, M., Aalto, P., Miikkulainen, P., Hämeri, K., and O’Dowd, C. D.: On the formation, growth and composition of nucleation mode particles, Tellus, 53B, 479–490, 2001.
Kulmala, M., Riipinen, I., Sipilä, M., Manninen, H., Petäjä, T., Jun-ninen, H., Dal Maso, M., Mordas, G., Mirme, A., Vana, M., Hir-sikko, A., Laakso, L., Harrison, R. M., Hanson, I., Leung, C., Lehtinen, K. E. J., and Kerminen, V.-M.: Towards direct mea-surement of atmospheric nucleation, Science, 318, 89–92, 2007. Kulmala, M., Kontkanen, J., Junninen, H., Lehtipalo, K., Manni-nen, H. E., NiemiManni-nen, T., Petäjä, T., Sipilä, M., Schobesberger, S., Rantala, P., Franchin, A., Jokinen, T., Järvinen, E., Äijälä, M., Kangasluoma, J., Hakala, J, Aalto, P., Paasonen, P., Mikkilä, J., Vanhanen, J., Aalto, J., Hakola, H., Makkonen, U., Ruuska-nen, T., Mauldin III, R. L., Duplissy, J., Vehkamäki, H., Bäck, J., Kortelainen, A., Riipinen, I., Kurten, T., Johnston, M. V., Smith, J. N., Ehn, M., Mentel, T. F., Lehtinen, K. E. J., Laaksonen, A., Kerminen, V.-M., and Worsnop, D. R.: Direct observations of at-mospheric aerosol nucleation, Science, 339, 943–946, 2013. Lehtipalo, K., Sipilä, M., Riipinen, I., Nieminen, T., and Kulmala,
M.: Analysis of atmospheric neutral and charged molecular clus-ters in boreal forest using pulse-height CPC, Atmos. Chem. Phys., 9, 4177–4184, doi:10.5194/acp-9-4177-2009, 2009. Mäkelä, J. M., Jokinen, V., Mattila, T., Ukkonen, A., and Keskinen,
J.: Mobility distribution of acetone cluster ions, J. Aerosol Sci., 27, 175–190, 1996.
Makkonen, R., Asmi, A., Kerminen, V.-M., Boy, M., Arneth, A., Hari, P., and Kulmala, M.: Air pollution control and decreas-ing new particle formation lead to strong climate warmdecreas-ing, At-mos. Chem. Phys., 12, 1515–1524, doi:10.5194/acp-12-1515-2012, 2012.
Manninen, H. E., Petäjä, T., Asmi, E., Riipinen, I., Nieminen, T., Mikkilä, J., Hõrrak, U., Mirme, A., Mirme, S., Laakso, L., Ker-minen, V.-M., and Kulmala, M.: Long-term field measurements of charged and neutral clusters using Neutral cluster and Air Ion Spectrometer (NAIS), Boreal Environ. Res., 14, 591–605, 2009b. McGowan, S.: Ion–ion recombination in laboratory air, Phys. Med.
Biol., 10, 25–40, 1965.
Merikanto, J., Spracklen, D. V., Mann, G. W., Pickering, S. J., and Carslaw, K. S.: Impact of nucleation on global CCN, At-mos. Chem. Phys., 9, 8601–8616, doi:10.5194/acp-9-8601-2009, 2009.
Mirme, S. and Mirme, A.: The mathematical principles and design of the NAIS – a spectrometer for the measurement of cluster ion and nanometer aerosol size distributions, Atmos. Meas. Tech., 6, 1061–1071, doi:10.5194/amt-6-1061-2013, 2013.
Nolan, P. J.: The recombination law for weak ionization, Nature, 148, 26–26, 1941.
Raes, F., Van Dingenen, R., Vignati, E.,Wilson, J., Putaud, J. P., Se-infeld, J. H., and Adams, P.: Formation and cycling of aerosols in the global troposphere, Atmos. Environ., 34, 4215–4240, 2000. Sorokin, A. and Mirabel, P.: Ion recombination in aircraft exhaust
plumes, Geophys. Res. Lett., 28, 955–958, 2001.
Spracklen, D. V., Carslaw, K. S., Kulmala, M., Kerminen, V.-M., Mann, G. W., and Sihto, S.-L.: The contribution of boundary layer nucleation events to total particle concentrations on re-gional and global scales, Atmos. Chem. Phys., 6, 5631–5648, doi:10.5194/acp-6-5631-2006, 2006.
Swider, W: Ionic mobility, mean mass, and conductivity in the mid-dle atmosphere from near ground level to 70 km, Radio Science, 23, 389–399, 1988.
Tammet, H.: Size and mobility of nanometer particles, clusters and ions, J. Aerosol Sci., 26, 459–475, 1995.
Tammet, H. and Kulmala, M.: Simulation tool for atmospheric aerosol nucleation bursts, J. Aerosol Sci., 36, 173–196, 2005. Tammet, H., Hõrrak, U., Laakso, L., and Kulmala, M.: Factors
of air ion balance in a coniferous forest according to measure-ments in Hyytiälä, Finland, Atmos. Chem. Phys., 6, 3377–3390, doi:10.5194/acp-6-3377-2006, 2006.
Turco, R. P., Hao, J.-X., and Yu, F.: A new source of tropospheric aerosols: Ion–ion recombination, Geophys. Res. Lett., 25, 635– 638, 1998.
Wang, M. and Penner, J. E.: Aerosol indirect forcing in a global model with particle nucleation, Atmos. Chem. Phys., 9, 239–260, doi:10.5194/acp-9-239-2009, 2009.
Vanhanen, J., Mikkilä, J., Lehtipalo, K., Sipilä, M., Manninen, H. E., Siivola, E., Petäjä, T., and Kulmala, M.: Particle size mag-nifier for nano-CN detection, Aerosol Sci. Tech., 45, 533–542, 2011.
Yu, F. and Turco, R.: Case studies of particle formation events observed in boreal forests: implications for nucleation mecha-nisms, Atmos. Chem. Phys., 8, 6085–6102, doi:10.5194/acp-8-6085-2008, 2008.
Yu, F., Luo, G., Bates, T. S., Anderson, B., Clarke, A., Ka-pustin, V., Yantosca, R. M., Wang, Y., and Wu, S.: Spa-tial distributions of particle number concentrations in the global troposphere: Simulations, observations, and implications for nucleation mechanisms, J. Geophys. Res., 115, D17205, doi:10.1029/2009JD013473, 2010.