PRINT ISSN 2284-7995, E-ISSN 2285-3952
THE MAIN INDICATORS ANALYSIS THAT CHARACTERIZE THE
CULTIVATED CROPS TECHNOLOGY IN THE AGRICULTURAL
HOLDING SC TOMA SRL, VILLAGE MODELU, CALARASI COUNTY
Georgiana CRUDU1, Manea DR GHICI1, Diana NECULA2
1
University of Agricultural Sciences and Veterinary Medicine Bucharest, 59 Marasti, District 1, Zip Code 11464, Bucharest, Romania, Phone/Fax: 00 40 744 6474 10,
Email:[email protected], Email:[email protected]
2
The Research Institute for Agriculture Economy and Rural Development, 61 Marasti, District 1,
Ziop Code 011464, Phone: 00 40.21.318.16.86, Email: [email protected]
Corresponding author: [email protected]
Abstract
The case study was conducted in the Călărași County, County cultivated mostly with cereals. The production technology study was performed in the agricultural holding SC Toma SRL, village Modelu, Calarasi County. The agricultural holding S C Toma S.R.L it is entirely a private owned company, established and operating pursuant to law 31/1990. The agricultural holding is currently operating in the area of 360 hectares of arable land. SC TOMA S.R.L., has a vegetal profile, cultivate especially cereals (wheat, maize and barley) and technical crops (sunflower, rape). We had as subject for analysis the main indicators of the holding, the data being processed using statistical formulas that emphasizes the differences between trends, and the efforts profitability made by the enterprise. This work is part of a comprehensive study conducted in the Calarasi County.
Key words: agricultural holding, crop technology, production indicators
INTRODUCTION
CăХărК Т County is one of the youngest counties in the country, it was created in January 1981. The main richness is the natural agricultural land , which occupies over 84% of the County area. Soils, most of them are different types of chernozem and alluvial soils , they have a high fertility, which allows a large scale agriculture, predominantly being the cereal character of vegetal production[3]. Modelu Village is situated in the southern part oП CКХărК Т CoЮnЭв on ЭСО ХОПЭ ЛКnФ oП ЭСО Borcea branch, between the municipalities Roseti at East, Dragalina and Perisoru at North, Stefan Voda and the city of Calarasi to the West and in South Constanta County. Modelu, like most villages in Calarasi county, has an agricultural profile , the inhabitants developing activity in this area, taking advantage of the special soil conditions and climate for the development of cereal grains and technical plants.
The crops that were subject of analysis are the
occupying a very important place in the national and international economy.All five cultures studied are used in human and animal nutrition, biofuel and many other uses.
MATERIALS AND METHODS
In the paper we used the following indicators: arithmetic mean, standard deviation, mean square deviation, coefficient of variation, confidence limits for a given risk, average annual growth rate, the limits amplitude for a given risk towards the average and statistical significance of these indicators.
The formulas used to calculate these indicators are presented : [2] [6]
For the arithmetic mean = n
xi x
; where:
X = the arithmetical mean; Xi = The average production values for a number of years (i); n = number of years taken into account The annual average growth rate [5] =
8 ( 1/ 0) 1 2013
2008
p p r
PRINT ISSN 2284-7995, E-ISSN 2285-3952
r2008-2013 = average annual growth rate; ∏p1/po ţ ОnЭКnРХОН РroаЭС ТnНТМКЭors
For the standard deviation =
1 2 )^ (
xnxi
; where:
= standard deviation; xi = the average
values for a number of years n = number of years taken into account For mean square deviation =
) 1 (
2 )^ (
n n
xi x x
; where:
x
= mean square deviation;
The confidence limits corresponding to a given risk X = +/-ðб * Эp, in which:
X = the arithmetic average; average square deviation;
tp = tabular value for the probability of transgression (risk)[1].
Amplitude of oscillation of the limits of confidence [7] =
ţ ((Б + ðб * Эp)-(X-ðб * Эp)/(Б)) * 100
Coefficient of variation = C X x100
,where: C-coefficient of variation (expressed as a percentage)
Coefficient of variation can be: between 0-10% variation; between 10-20%-sized variation; more than 20%-large variation The data used was source: internal database of SC Toma SRL, the data from the literature.
RESULTS AND DISCUSSIONS
1.The main indicators analysis that characterize the wheat crop technology
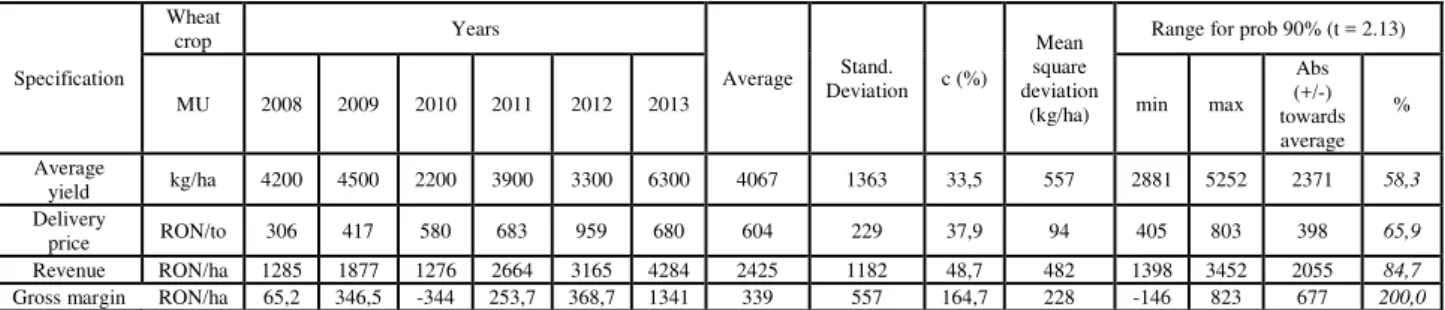
The main economic indicators that characterize the wheat culture technology in SC Toma SRL, are presented in the table.1, as follows:
-The average production during the analysed period registered a minimum value in 2010, 2200 kg/ha, and reached a maximum during the last year analysed, 2013, of 6300 kg per ha. The average of productions is by 4067 kg/ha, with a standard deviation of 1363 kg/ha and a large supply of scattering of variation of 33.5%. The 90% probability interval is bounded below by 2881 kg/ha and higher by the limit 5252 kg/ha. The delivery price, is situated between the values 306 (2008) and 959 (2012), the average being of 604 Ron per ton, the coefficient of variation was over the threshold of 20 %,( 37.9 %), which indicates a high degree of scattering of values around the average. Calculating the confidence limits, for the probability of 90%, it is indicated a range between 405 Ron/ton and 805 Ron /ton; - The holding's revenues made from wheat culture, shows an average of 2425 Ron/ha, with a deviation of 1182 Ron/ha and a high coefficient of variation, 48.7%.
-The Gross margin is the indicator with the highest oscillations, recording in 2010, even a negative value,-344 Ron/ha, as well as a satisfying value in 2013 of 1341 Ron/ha. The average is of 339 Ron/ha, and the coefficient of variation demonstrate a very high degree of scattering, 164,7% .
Table 1. The main indicators evolution that characterize the wheat crop technology in SC Toma SRL, Modelu,
CăХărК Т CoЮnЭвĽ Пor ЭСО pОrТoН 2008-2013
Specification Wheat
crop Years
Average Stand. Deviation c (%)
Mean square deviation
(kg/ha)
Range for prob 90% (t = 2.13)
MU 2008 2009 2010 2011 2012 2013 min max Abs (+/-) towards average
%
Average
yield kg/ha 4200 4500 2200 3900 3300 6300 4067 1363 33,5 557 2881 5252 2371 58,3 Delivery
price RON/to 306 417 580 683 959 680 604 229 37,9 94 405 803 398 65,9 Revenue RON/ha 1285 1877 1276 2664 3165 4284 2425 1182 48,7 482 1398 3452 2055 84,7
Gross margin RON/ha 65,2 346,5 -344 253,7 368,7 1341 339 557 164,7 228 -146 823 677 200,0
Source: Own calculation after internal database of SC Toma SRL.[4]
2.The main indicators analysis that characterize the barley crop technology.
PRINT ISSN 2284-7995, E-ISSN 2285-3952
Table 2. The main indicators evolution that characterize the barley crop technology in SC Toma SRL, Modelu,
CăХărК Т CoЮnЭвĽ Пor ЭСО pОrТoН 2008-2013
Specification Barley
crop Years
Average Stand. Deviation c (%)
Mean square deviation
(kg/ha)
Range for prob 90% (t = 2.13)
Mu 2008 2009 2010 2011 2012 2013 min max Abs (+/-) average
girl %
Average
yield kg/ha 4400 4700 3900 4100 3700 7000 4633 1213 26,2 495 3579 5688 2109 45,5 Delivery
price RON/to 295 358 520 656 780 720 555 198 35,7 81 383 727 344 62,0 Revenue RON/ha 1298 1683 2028 2690 2886 5040 2604 1335 51,3 545 1443 3765 2321 89,1
Gross margin RON/ha 18 170,6 167 478,6 565 2597 666 968 145,4 395 -176 1508 1332 200,0
Source: Own calculation after internal database of SC Toma SRL.[4]
- The average production shows a stability until 2012, followed by an increase of almost 90% in 2013, reaching 7000 kg / ha.The average of the 6 years is 4633 kg / ha, with a large variation productions 35.7%, as shown by the coefficient of variation;
- The price of delivery has an upward trend, reaching to record in the last two years much higher values compared to the early years. On average for those 6 years, barley was sold with 555 Ron/ton, with a deviation of 198 Ron/ha, and the variation in prices of 35,7% around the average price. The confidence interval with 90% probability is lower bounded by 383 Ron/ha and higher by 727Ron/ha.
- In terms of revenue and gross margin we can affirm that 2013 was the year in which the company has registered considerable values with 5040 Ron/ha as revenue and a gross margin of 2597 Ron/ha. These values are due, of course, to the higher quantity of production.
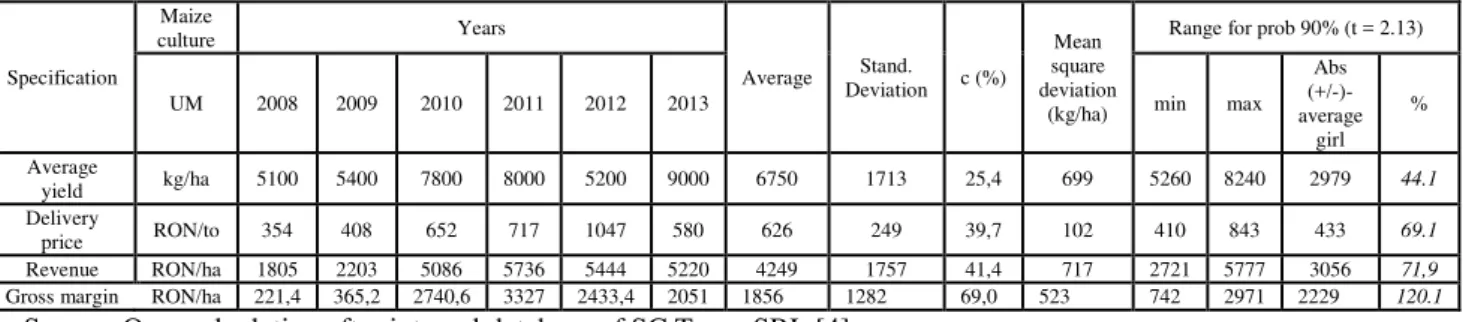
3.The main indicators analysis that characterize the maize crop technology Regarding the maize crop technology , its indicators are presented as follows:
Production/hectare has an averaged value over the years of 6750 kg/ha, the greatest production being obtained in the last year, 2013, 9000 kg/ha.
The delivery price has varied values throught the period considered, the year 2012 representing the year with a very good capitalization , 1047 Ron/tonne of maize. Although , the most quantitative production was done in the year 2013, taking into account the value of the delivery price and the achieved production, the highest incomes were completed in the year 2011, 5736 Ron/ha, with 516 Ron more compared to the year 2013.
The Gross margin shows a large variation, with a coefficient of 69%, a deviation of 1282 Ron/ha and an average of 1856 Ron/ha.
Table 3. The main indicators evolution that characterize the maize crop technology in SC Toma SRL, Modelu,
CăХărК Т CoЮnЭвĽ Пor ЭСО pОrТoН 2008-2013
Specification Maize
culture Years
Average Stand. Deviation c (%)
Mean square deviation
(kg/ha)
Range for prob 90% (t = 2.13)
UM 2008 2009 2010 2011 2012 2013 min max Abs (+/-)-average
girl %
Average
yield kg/ha 5100 5400 7800 8000 5200 9000 6750 1713 25,4 699 5260 8240 2979 44.1 Delivery
price RON/to 354 408 652 717 1047 580 626 249 39,7 102 410 843 433 69.1 Revenue RON/ha 1805 2203 5086 5736 5444 5220 4249 1757 41,4 717 2721 5777 3056 71,9
Gross margin RON/ha 221,4 365,2 2740,6 3327 2433,4 2051 1856 1282 69,0 523 742 2971 2229 120.1
Source: Own calculation after internal database of SC Toma SRL.[4]
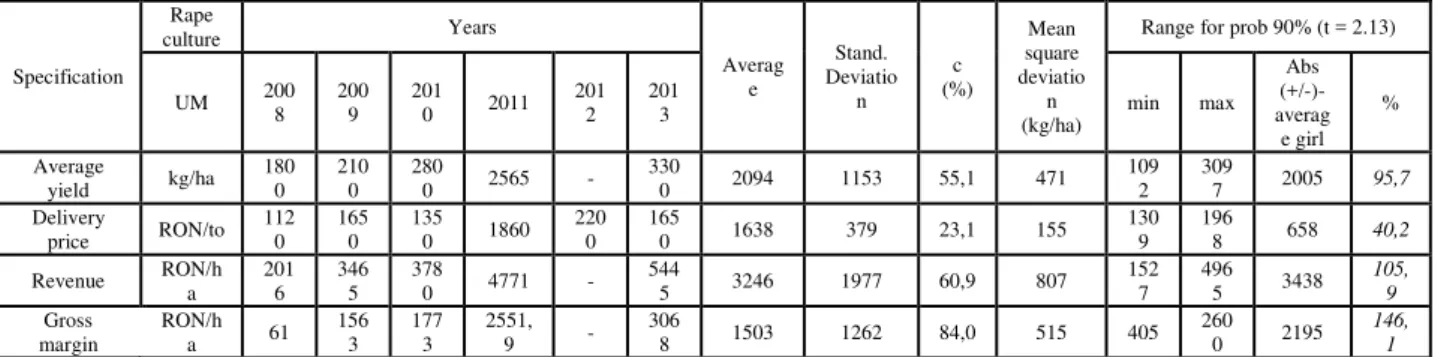
4.The main indicators analysis that characterize the rape crop technology. The average production at the rape culture, as values between 1800 kg/ha and 3300 kg/ha, with an average /years of 2094 kg/ha. In 2012, the agricultural holding has not cultivated the
PRINT ISSN 2284-7995, E-ISSN 2285-3952
values in the last year 2013, of 5445 Ron/ha and 3068 Ron/ha.
Table 4. The main indicators evolution that characterize the rape crop technology in SC Toma SRL, Modelu,
CăХărК Т CoЮnЭвĽ Пor ЭСО pОrТoН 2008-2013
Specification Rape
culture Years
Averag e Stand. Deviatio n c (%) Mean square deviatio n (kg/ha)
Range for prob 90% (t = 2.13)
UM 200 8
200 9
201 0 2011
201 2
201
3 min max
Abs (+/-)-averag e girl % Average
yield kg/ha 180
0 210
0 280
0 2565 - 330
0 2094 1153 55,1 471 109
2 309
7 2005 95,7 Delivery
price RON/to 112
0 165
0 135
0 1860 220
0 165
0 1638 379 23,1 155 130
9 196
8 658 40,2
Revenue RON/h a 201 6 346 5 378
0 4771 - 544
5 3246 1977 60,9 807 152
7 496
5 3438
105, 9
Gross margin
RON/h a 61
156 3
177 3
2551, 9 -
306
8 1503 1262 84,0 515 405 260
0 2195
146, 1
Source: Own calculation after internal database of SC Toma SRL.[4]
5.The main indicators analysis that characterize the sunflower crop technology In the crop technology of sunflower , we see the following developments:
- The average production per hectare has throughout the period considered, a positive evolution, reaching in the year 2013 to record
with 1900 kg/ha more than in 2008. The productions average is of 2485 kg/ha, with a deviation of 637 kg/ha and a high degree of scattering given by the coefficient of variation 25.3%;
Table 5. The main indicators evolution that characterize the sunflower crop technology in SC Toma SRL, Modelu,
CăХărК Т CoЮnЭвĽ Пor ЭСО pОrТoН 2008-2013
Specification
Sunflower
crop Years
Average Stand. Deviation c (%)
Mean square deviation
(kg/ha)
Range for prob 90% (t = 2.13)
UM 2008 2009 2010 2011 2012 2013 min max Abs (+/-)-average girl % Average
yield kg/ha 1700 2300 2400 2800 2300 3600 2517 637 25,3 260 1963 3071 1108 44,0 Delivery
price RON/to 659 712 1337 1397 2035 1050 1198 511 42,7 209 754 1643 890 74,2 Revenue RON/ha 1120 1638 3209 3912 4681 3780 3056 1391 45,5 568 1847 4266 2420 79,2
Gross margin RON/ha 75,3 330,6 1553,8 1994,6 2611,5 1602 1361 977 71,8 399 512 2211 1700 124,9
Source: Own calculation after internal database of SC Toma SRL.[4]
- Regarding the delivery price, its value was the highest in 2012, 2226 Ron per ton, while in 2008 was the lowest, 659 Ron/ton. The average value is of 1198 Ron/ton, with a standard deviation of 511 Ron/ton.
- In light of the above data, we can determine the value of the revenues, and we see that the revenue has had an uptrend in the past three years gathering the highest incomes.
- The Gross margin thas he same uptrend, in the year 2012, being around 2611,5 Ron/ha. The average is 1361 Ron/ha and the value of deviation is very elevated of 977 Ron /ha, demonstrating the very large variation between data.
PRINT ISSN 2284-7995, E-ISSN 2285-3952
Fig.2.The revenues (lei/ha)
CONCLUSIONS
As a result of the analysis carried out in the agricultural society SC Taiga LLC, we conclude the following:
1.The year 2013 was the year in which the productions from all cultures have reached a maximum for the period studied, while the previous year has registered the smallest productions in most cultures.
2.A spectacularly evolution, in terms production performance has the corn crop, which in the last 3 years register values almost double compared to the first year. 3.These production increases are due primarily to the technological evolution of society, followed by good climate conditions from the year 2013.
4.In terms of financial indicators, corn is the culture that manages to bring to the holding's the largest revenue, followed by rape and sunflower crops.
5.In the last year studied, for most crops were recorded high incomes compared to previous years, except the maize, that had a peak in 2010 and the sunflower in 2012; but the homogeneity of revenues from the year 2013 is not common throughout the period studied.
REFERENCES
[1]Build Free Website of your own on, Tripod, http://statisticasociala.tripod.com/tabele.htm
[2]Demographic growth,
http://www.dictsociologie.netfirms.com/_IndDem/IndR eproducere.htm
[3]Calarasi County Council, http://www.calarasi.ro [4]SC Toma SRL, Internal database
[5]Buhociu, L., Buhociu, C.-A., Water and agriculture in human development perspective,
http://www.anif.ro/cnrid/contributii/20100322-APA% 20and% 20AGRICULTURA.pdf
[6]Ceapoiu, N., 1968, Applied statistical methods in agricultural experiments and statistical Ed.Agro-Silvica, Bucharest 1968