Development of Compositions of Aluminium
Welding Fluxes Using Statistical Method
Joseph Ifeanyi Achebo
I, Member, IAENG
Abstract—This paper describes the process of developing a model that relates the shear stresses in a gas welded aluminium alloy weldment with the corresponding flux constituent elements that make up the flux composition. This model, considering the initial composition ranges, from where 13 flux compositions were formulated and their shear stresses determined and transformed into a model. This model was used to develop 3 new flux compositions within the stipulated ranges. However, the weldments made from the 13 flux compositions were subjected to evaluation by some professional welders whose judgements about the quality of the weldments were evaluated by using the rank correlation coefficient method.
Index Terms—Aluminium flux composition; mechanical properties, statistical analysis; weld shear stress, weldments.
I. INTRODUCTION
Over the years researchers have been trying to improve the mechanical properties introduced in welded joints by flux materials by developing different flux compositions [1]-[5].Standard welding flux composition ranges exist [6]-[8]. However, specific welding flux compositions within the standard limits depend on the particular manufacturer and raw materials available. In order to improve on the performance of welding fluxes and to reduce cost, there is need to derive new flux compositions. Several methods are used for derivation of new flux formulations. These include the trial and error approach, matrix design methods, and mathematical analysis methods [9]-[11].
In this work, a statistical model is applied for producing new flux compositions. The mechanical properties of the weld deposits determine the performance of the flux.
ILecturer in the Department of Production Engineering, Faculty of
Engineering, University of Benin, Nigeria (E-mail: [email protected])
In aluminium welding, shear stress has been described as a test of strength and performance [12],[13]. Therefore, in this paper the shear stresses of the corresponding flux compositions were used in the statistical model to produce new flux compositions.
II. METHODOLOGY
A. Experimental Design
The experimental design used here, is Hadamard multivariate matrix design model. This model was used to generate 12 welding flux compositions [14] However, compositions were varied to produce a new composition which finally brought the number of compositions to thirteen.
B. Procedure
Thirteen newly developed aluminium welding fluxes were used to make weld deposits, which were subsequently used to produce 5 specimens for each flux composition, making a total of 65 specimens. These specimens were grounded and polished with emery papers of 400 and 600 grits and further smoothened with a 0.5µm emery cloth. These specimens were subjected to shear strength test and the shear stresses were calculated and recorded. 2 Engineers who are welders with 18 years working experience and as well as 2 independent Professional welders with 20 years working experience were employed to evaluate the performance of the newly developed fluxes. The skills of the
welders were taken into consideration by the coefficient ∂
[10], equal to 2 and 1 which is a 10 point scale, where 2 represents the highest weld quality and 1 the least weld quality. The multivariate mixture design and the rank correlation coefficient were used to determine the uniformity and relationship of the shear stresses to aluminium weldments.
Proceedings of the International MultiConference of Engineers and Computer Scientists 2009 Vol II IMECS 2009, March 18 - 20, 2009, Hong Kong
III.
Results and Discussion
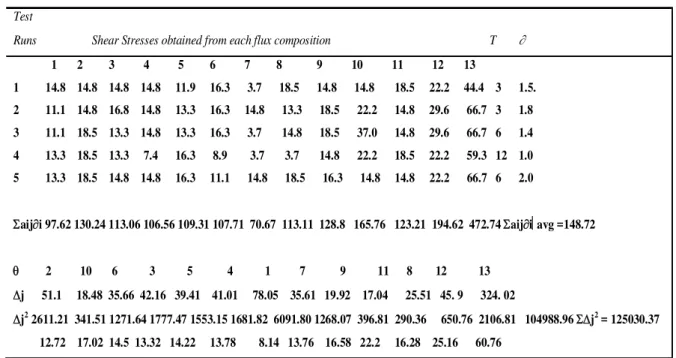
Table I: Multivariate Mixture Experimental Design of Shear Stress Distribution
Test
Runs Shear Stresses obtained from each flux composition T ∂
1 2 3 4 5 6 7 8 9 10 11 12 13
1 14.8 14.8 14.8 14.8 11.9 16.3 3.7 18.5 14.8 14.8 18.5 22.2 44.4 3 1.5.
2 11.1 14.8 16.8 14.8 13.3 16.3 14.8 13.3 18.5 22.2 14.8 29.6 66.7 3 1.8
3 11.1 18.5 13.3 14.8 13.3 16.3 3.7 14.8 18.5 37.0 14.8 29.6 66.7 6 1.4
4 13.3 18.5 13.3 7.4 16.3 8.9 3.7 3.7 14.8 22.2 18.5 22.2 59.3 12 1.0
5 13.3 18.5 14.8 14.8 16.3 11.1 14.8 18.5 16.3 14.8 14.8 22.2 66.7 6 2.0
Σaij∂i 97.62 130.24 113.06 106.56 109.31 107.71 70.67 113.11 128.8 165.76 123.21 194.62 472.74 Σaij∂i⎢avg =148.72
θ 2 10 6 3 5 4 1 7 9 11 8 12 13
Δj 51.1 18.48 35.66 42.16 39.41 41.01 78.05 35.61 19.92 17.04 25.51 45. 9 324. 02
Δj2 2611.21 341.51 1271.64 1777.47 1553.15 1681.82 6091.80 1268.07 396.81 290.36 650.76 2106.81 104988.96 ΣΔj2 = 125030.37
12.72 17.02 14.5 13.32 14.22 13.78 8.14 13.76 16.58 22.2 16.28 25.16 60.76
To evaluate the extent of correlation between the judgements of the welders which were based on the quality of the weldments, the rank correlation coefficient method was used as follows:
(
)
21 1 2
1 2
12
⎥
⎦
⎤
⎢
⎣
⎡
⎥
⎦
⎤
⎢
⎣
⎡
−
−
Δ
=
∑
∑
∑
= = =
m
i i m
i i n
j
T
n
n
M
j
m
W
δ
(1)
Where
2
1 1 1 1
2
1
∑ ∑
∑∑
∑
= = = =
=
⎥
⎦
⎤
⎢
⎣
⎡
−
=
Δ
nj m
i
n
j m
i j i
n
j
aij
aij
j
δ
δ
(2)and
∑
(
)
−
−
=
ni j
j j
i
t
t
T
2 (3)where n is the number of flux compositions whose welds shear stresses were determined; m is the number of test runs and tj is
the number of repetitions of each element in one row;
Δj = Σaij∂i⎢avg - Σaij∂I ; θ represents the variable ranking; w is the ranking coefficient; aij is the shear stress variable in each test run and T is the summation of the repetitions of each element in ith column
Therefore,
[
(
4)
]
27
.
7
30
13
13
5
37
.
125030
5
12
−
−
×
×
=
W
m
(
n
)
w
cal
1
2
=
−
χ
(4)χ2
cal = 5 (13 - 1) 0.89 = 53.4
χ2
table (0.05; 12) = 21.02
Since the calculated value is higher than the table value, it means that the assessments of the welders are in agreement. Therefore the shear stress distribution is uniform, even though there are large variations of shear stresses caused by flux 13 and slightly by fluxes 12 and 10.
Table II shows the ranges of flux constituent elements which was the standard for developing 13 flux compositions used to make weldments whose shear stresses were
determined as shown in Table I. Proceedings of the International MultiConference of Engineers and Computer Scientists 2009 Vol II IMECS 2009, March 18 - 20, 2009, Hong Kong
Table II: Flux Composition Ranges
Variable level
Factor main lower upper variation range
X1 47.5 45 50 2.5
X2 42.5 40 45 2.5
X3 4 2 6 2
X4 6 4 8 2
Where X1 = NaCl, X2 = CaCl2, X3 = CaF2, and X4 = Na3AlF6
Multiple regression analysis in the excel microsoft package was used to analyze the shear stresses and developed a model. The model is expressed in (5).
Y = 5.93 + 1.21X1 – 1.06X2 + 0.63X3 – 0.28X4 (5)
Where Y is the shear stress
This model was the basis for the development of new flux compositions within the initial flux composition ranges in Table II.
Table III shows the process for developing the new flux compositions using the model above
Table III: Flux development process
Factor
X1 X2 X3 X4
Ci 1.21 - 1.06 0.63 - 0.28
Dj 2.5 2.5 2 2
CiDj 3.05 - 2.68 1.26 - 0.56
Compositions % by wt NaCl CaCl2 CaF2 Na3AlF6
Step 0.7 - 0.8 0.3 - 0.2 Zero level 47.5 42.5 4.0 6.0 14 48. 2 41.7 4.3 5.8 15 48.9 40.9 4.6 5.6 16 49.6 40.1 4.9 5.4
IV. CONCLUSION
The model in (5) was applied to the flux development process as seen in Table III and has successfully developed three new compositions (14 - 16), which are within the ranges of the given flux constituent elements in Table II. The mechanical properties of these new fluxes have been tested and found to have excellent welding performances. They are currently been used for flux production in Nigeria. This method can be applied to other given flux composition ranges having developed its model to produce new fluxes. A range of flux compositions are needed to select the optimum composition after determining their mechanical properties, using both destructive and non destructive test methods.
REFERENCES
[1] C. E. Jackson,.“Fluxes and Slags in Welding” Weld. Res. Counc. Bull. No.190, 1971, pp.25-57.
[2] Chao-Ting Chi and Chuen – Guang Chao, “Optimum Evaluation for Electron Beam Weldments of AZ61A-F Extruded Plates” Welding Journal, Vol. 86, No.5, May 2007, pp.115-s.
[3] T. Aizawa, M. Kshani, and K. Okagawa, “Application of Magnetic Pulse Welding for Aluminium Alloys and SPCC Steel Sheet Joints” Welding Journal, Vol. 86, No 5, May 2007, pp. 119-s – 124-s. [4] J. E. Ramirez, “Weldability Evaluation of Supermarkensitic Stainless
Pipe Steels” Weld. J., Vol. 86, No. 5, 2007, pp. 125-5,
[5] P. Kanjilal, T. K. Pal, and K. Majumdar, “Prediction of Element Transfer in Submerged Arc Welding”, Weld. J., Vol. 86, No. 5, 2007, pp.135-s, [6] D. Glizmaneko and G. Yevseyer. (undated) Gas Welding and Cutting,
Moscow: Peace Publishers, pp. 180.
[7] A. C. Davies,(1984) Welding Science, UK: Prentice Hall publication, 1984, pp.55
[8] P. C. Varley, The Technology of Aluminium and its Alloys, London: Newnes- Butterworths, 1970, pp.78
[9] W. J. Diamond, Practical Experimental Design for Engineers and Scientists, 2nd Ed., .New York: Van Nostrand Reinhold, 1989, pp..89
– 123, 296 – 306.
[10] E. V. Nikitina,. (2004) “Development of the Composition of Electrode Coatings for Welding Aluminium Alloys Using the Expert Evaluation Method”, Weld. Inter., 18(4), 2004, pp. 307 – 310.
[11] J. A. Marshall. and J. Heuschkel, ”Statistical Analysis of Dependence of Weld Metal Properties on Composition” Weld. Res. Counc. Bull., No.228, 1977, pp.34-61.
[12] G. Padmanabham, M. Schaper, S. Pandey, and E. Simmchen, ”Tensile and Fracture Behavor of Pulsed Gas Metal Arc Welded Al – Cu – Li” Weld. J., Vol. 86, No. 6, June 2007, p.147-s – 160-s. [13] A. E. Marchenko,. “Improvement of Quality of Welding Electrodes
on the basis of Standards ISO of Series 9000 – 2000”. The Paton Weld.. J., No. 11, 2002, pp. 29-36.
[14] J. I. Achebo. and A. O. A. Ibhadode, “Development of a New Flux for Aluminium Gas Welding”, Z. Y. Shen; M. N. James; W. D. Li, and Y X. Zhao, Eds. Switzerland: Trans Tech Publications Ltd, , Vol. 44 – 46 of Advanced Materials Research, 2008, pp 677- 684
Proceedings of the International MultiConference of Engineers and Computer Scientists 2009 Vol II IMECS 2009, March 18 - 20, 2009, Hong Kong