www.biogeosciences.net/3/557/2006/ © Author(s) 2006. This work is licensed under a Creative Commons License.
Biogeosciences
Distribution of N
2
O in the Baltic Sea during transition from anoxic
to oxic conditions
S. Walter1,*, U. Breitenbach1, H. W. Bange1, G. Nausch2, and D. W. R. Wallace1
1Forschungsbereich Marine Biogeochemie, IFM-GEOMAR, Leibniz-Institut f¨ur Meereswissenschaften, Kiel, Germany 2Leibniz-Institut f¨ur Ostseeforschung, Warnem¨unde, Germany
*now at: Institute for Marine and Atmospheric Research Utrecht, Utrecht University, Utrecht, The Netherlands Received: 22 February 2006 – Published in Biogeosciences Discuss.: 26 June 2006
Revised: 23 October 2006 – Accepted: 14 November 2006 – Published: 21 November 2006
Abstract. In January 2003, a major inflow of cold and oxygen-rich North Sea Water terminated an ongoing stag-nation period in parts of the central Baltic Sea. In order to investigate the role of North Sea Water inflow in the pro-duction of nitrous oxide (N2O), we measured dissolved and atmospheric N2O at 26 stations in the southern and central Baltic Sea in October 2003.
At the time of our cruise, water renewal had proceeded to the eastern Gotland Basin, whereas the western Gotland Basin was still unaffected by the inflow. The deep water renewal was detectable in the distributions of temperature, salinity, and oxygen concentrations as well as in the distri-bution of the N2O concentrations: Shallow stations in the Kiel Bight and Pomeranian Bight were well-ventilated with uniform N2O concentrations near equilibrium throughout the water column. In contrast, stations in the deep basins, such as the Bornholm and the Gotland Deep, showed a clear strat-ification with deep water affected by North Sea Water. In-flowing North Sea Water led to changed environmental con-ditions, especially enhanced oxygen (O2)or declining hydro-gen sulphide (H2S) concentrations, thus, affecting the condi-tions for the production of N2O. Pattern of N2O profiles and correlations with parameters like oxygen and nitrate differed between the basins. Because of the positive correlation be-tween1N2O and AOU in oxic waters the dominant produc-tion pathway seems to be nitrificaproduc-tion rather than denitrifica-tion.
Advection of N2O by North Sea Water was found to be of minor importance. A rough budget revealed a significant surplus of in situ produced N2O after the inflow. However, due to the permanent halocline, it can be assumed that the N2O produced does not reach the atmosphere. Hydrographic Correspondence to:S. Walter
aspects therefore are decisive factors determining the final release of N2O produced to the atmosphere.
1 Introduction
1.1 Nitrous oxide
Nitrous oxide (N2O) is an important atmospheric trace gas which influences, directly and indirectly, the Earth’s climate: In the troposphere, it acts as a greenhouse gas with a rela-tively long atmospheric lifetime of 114 years (Prather et al., 2001). In the stratosphere it is the major source for nitric oxide radicals, which are involved in one of the main ozone reaction cycles (WMO, 2003).
f01
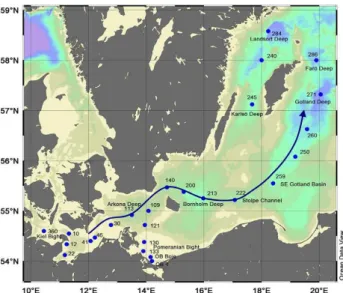
Fig. 1.Map of the western, southern and central Baltic Sea with lo-cations of the stations. The stations were grouped as follows: well-mixed stations are number 10, 12, 22, 30, 41, 46, 121, 130, 133, 360, OB Boje and OB 4; the Arkona Basin is represented by station 109 and 113; the Bornholm Basin is represented by station 140, 200, 213 and 222; in the eastern Gotland Basin station 250, 259, 260, 271 and 286 were grouped; and the western Gotland Basin is represented by station 240, 245 and 284. The arrow indicates the main flow direction of North Sea Water.
The yield of N2O during these processes strongly depends on the concentration of dissolved oxygen and nitrate (Bret-tar and Rheinheimer, 1991; Goreau et al., 1980; Vollack and Zumft, 2001; Wetzel, 1983), with maximal N2O accumu-lation at the interface between oxic and suboxic layers, a general depletion within the core of suboxic water column, and invariably near-zero values in anoxic waters (Codispoti et al., 2005). Positive correlations between N2O and oxygen or nitrate are commonly interpreted as an indication of N2O production by nitrification (Yoshinari, 1976; Yoshida et al., 1989; Cohen and Gordon, 1978). In contrast, production by denitrification is inferred by missing correlations (Elkins et al., 1978; Cohen and Gordon, 1978). However, up to now the dominant production pathway for N2O on the global scale re-mains unclear and is discussed controversially (Codispoti et al., 2001; Popp et al., 2002; Yamagishi et al., 2005).
Oceans account for more than 25% of total natural emis-sions of N2O to the atmosphere, and contribute significantly to the global N2O budget (Prather et al., 2001; Seitzinger et al., 2000). Particularly coastal regions, including estuarine and upwelling regions, play a major role for the formation and release of N2O to the atmosphere (Bange et al., 1996; Naqvi et al., 2000; Seitzinger et al., 2000). The first study of N2O in the Baltic Sea was carried out by R¨onner (1983) who found the region to be a source of atmospheric N2O. In contrast to open ocean areas coastal regions are expected to be more influenced by conversion processes in sediments or
by riverine inputs. In the Bodden waters and Danish fjords of the Baltic Sea enhanced N2O concentrations were correlated with seasonal riverine input (Jørgensen and Sørensen, 1985; Dahlke et al., 2000). Additionally, denitrification processes in sediments were shown to contribute to the release of N2O in Danish fjords (Jørgensen and Sørensen, 1985).
1.2 Study area
The Baltic Sea is an adjacent sea of the Atlantic Ocean and part of the European continental shelf. It consists of a series of basins (Arkona, Bornholm, and Gotland Basin; see Fig. 1), with restricted horizontal and vertical water exchange due to shallow sills and a clear salinity induced stratification of water masses.
In January 2003 a major inflow of cold, highly saline and oxygen-rich North Sea Water was observed. It was the most important inflow event since 1993 and terminated the ongo-ing stagnation period in the central Baltic Sea (Feistel et al., 2003; Nausch et al., 2003). This inflow event was preceded by a minor inflow of warmer and less oxygenated water in August 2002. Due to the inflow of North Sea Water oxy-gen conditions changed from anoxic to oxic in most parts of the Baltic Sea. From the inflow in January 2003 until our cruise in October 2003 water renewal was already detectable at the Far¨o Deep (station 286), however the western Gotland Basin was still unventilated (Feistel et al., 2003; Nausch et al., 2003).
Due to the fact that N2O production strongly depends on environmental conditions such as oxygen concentration (e.g., Naqvi et al., 2000) any natural or anthropogenic-induced shifts of coastal ecosystems will affect the formation and sub-sequent release of N2O to the atmosphere. In this context the inflow of North Sea Water into the Baltic Sea offered a very good opportunity to investigate naturally changing environ-mental conditions with regard to the production of N2O. 1.3 Description of water masses
We refer to four different water masses, characterized by temperature, salinity and oxygen concentrations (Fig. 2). We followed the description of the “Institut f¨ur Ostseeforschung” (IOW) cruise reports (Nausch, 2003a; Nagel, 2003; Feis-tel, 2003; Nausch, 2003b, c; Wasmund, 2003) and the hydrographic-chemical report of the Baltic Sea in 2003 (Nausch et al., 2004). These water masses were character-istic for the time period after the inflow event in summer and autumn 2003.
in-creasing salinity. In this water mass, located below the Win-ter WaWin-ter, oxygen concentrations decreased rapidly, to anoxic conditions at some stations. A permanent halocline between Winter Water and Bottom Water strongly restricts the vertical exchange and is the reason for the development of stagnant deep waters with oxygen depletion culminating in anoxia as indicated by the accumulation of hydrogen sulphide (H2S). Bottom Water, affected by the North Sea Water inflow in January 2003 (abw) was characterized by decreasing temper-ature and enhanced oxygen concentrations compared to pre-vious Bottom Water (bw) values. Due to its higher density the affected Bottom Water lifts up the “old” Bottom Water.
2 Methods
Samples of dissolved N2O were measured at 26 stations in the western, southern and central Baltic Sea. The cruise took place on board the German research vessel Gauss (expedi-tion no. 11/03/04) from 13 October to 25 October 2003 as part of the Cooperative Monitoring in the Baltic Sea ment (COMBINE) program of the Baltic Marine Environ-ment Protection Commission (Helsinki Commission, HEL-COM, see http://www.helcom.fi). The locations of sampled stations are shown in Fig. 1.
Water samples were taken using a combined Seabird SBE911 CTD and Hydrobios rosette sampler equipped with 13 Niskin bottles. Samples for N2O analysis were collected in triplicate from various depths. The analytical method ap-plied was a modification of the method described by Bange et al. (2001). Bubble free samples were taken immedi-ately following oxygen sampling from the rosette in 24 mL glass vials, sealed directly with butyl rubber stoppers and crimped with aluminium caps. To prevent microbial activ-ity, samples were poisoned with 500µL of a 2 mM mercury (II) chloride solution. 10 mL of the sample were then re-placed with a helium headspace for each vial, and the sam-ples were equilibrated for at least two hours at room temper-ature (tempertemper-ature was recorded continuously). A 9 mL sub-sample from the headspace was used to flush a 2 mL sam-ple loop after passing through a moisture trap (filled with Sicapent, Merck Germany). Gas chromatographic separation was performed at 190◦C on a packed molecular sieve column (6 ft×1/8′′SS, 5 A, mesh 80/100, Alltech GmbH, Germany). The N2O was detected with an electron capture detector. A mixture of argon and methane (95:5 by volume) was used as carrier gas with a flow of 21 mL min−1. For the two-point calibration procedure we used standard gas mixtures with 311.8±0.2 ppb and 346.5±0.2 ppb N2O in synthetic air (Deuste Steininger GmbH, M¨uhlhausen Germany). The stan-dard mixtures have been calibrated against the NOAA (Na-tional Oceanic and Atmospheric Administration, Boulder, Co.) standard scale in the laboratories of the Air Chemistry Division of the Max Planck Institute for Chemistry, Mainz, Germany.
Fig. 2. Characterization of different water masses in the Baltic Sea, for example at station 271 in the Eastern Gotland Basin (triangles: temperature (◦C), circles: salinity, squares: oxygen (µmol 101L−1).
2.1 Calculations
N2O water concentrations (cN2O)were calculated as follows:
CN2O
h
nmol L−1i=( βxP Vwp+
xP
RTVhs) /Vwp (1)
whereβ stands for the Bunsen solubility in nmol L−1atm−1 (Weiss and Price, 1980), x is the dry gas mole fraction of N2O in the headspace in ppb, P is the atmospheric pres-sure in atm,Vwp andVhs stand for the volumes of the
wa-ter and headspace phases, respectively. R is the gas con-stant (8.2054 10−2L atm mol−1 K−1)andT is the equilib-rium temperature. The conductivity was measured by the CTD-Sensor during water sample collection; the tempera-ture was measured while subsampling the headspace of the sample vial. The overall relative mean analytical error was estimated to be±1.8%.
The excess N2O (1N2O) was calculated as the difference between the calculated N2O equilibrium concentration and the measured concentration of N2O as follows
(a)
(b) (c)
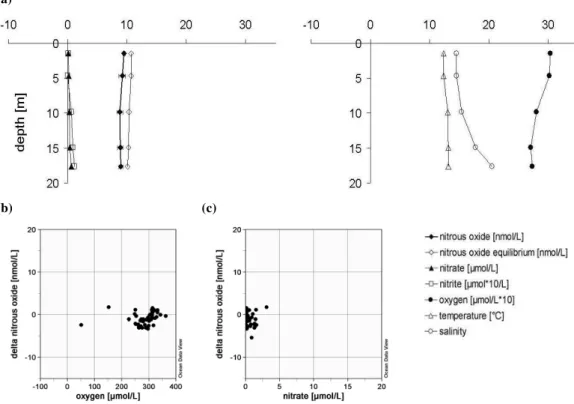
Fig. 3. Well mixed basins;(a)left plot with profiles of N2O, calculated N2O equilibrium concentration, NO−3, NO −
2 at station 41 in the Mecklenburg Bight and right plot with profiles of temperature, salinity and oxygen at station 41 in the Mecklenburg Bight;(b)1N2O plotted against oxygen at all stations<30 m; c)1N2O plotted against NO−3 at all stations<30 m.
Dioxide Information Analysis Center in Oak Ridge, Ten-nessee).
The apparent oxygen utilization (AOU) was calculated as follows:
AOU(µmol L−1)=O2(equilibrium)−O2(observed). (3) The equilibrium values of dissolved oxygen (O2)were calcu-lated with the equation given by Weiss (1970). The concen-tration of H2S is expressed as the negative oxygen equivalent (1µmol L−1 H2S=−2.00µmol L−1 O2). Dissolved nutri-ents and CTD data were provided by the participating work-ing groups. Concentrations of the dissolved inorganic nitro-gen compounds nitrate (NO−3), nitrite (NO−2), ammonium (NH+4), and oxygen (O2) were determined using standard methods (Grasshoff et al., 1983).
The N2O inventory of each basinmN2Owas calculated as follows:
mN2O[tons]= ¯CN2O∗nN2O∗V ∗10−3 (4) where C¯N2O is the mean measured N2O concentration in any given basin from the upper part of the halocline to the bottom (nmol L−1), nN2O is the molecular weight of N2O (44 g mol−1)andV is the water volume of each basin (km3).
The water volumes are based on data published in chapter 4.4.1 (HELCOM, 1996), available at: www.vtt.fi/inf/baltic/ balticinfo/index.html.
The N2O content of basins was calculated with data of the following stations: Bornholm Basin: station 140, 200, 213, 222, eastern Gotland Basin: station 250, 259, 260, 271, western Gotland Basin: station 240, 245, 284. Station 286 is located in the northern part of the Gotland Basin and thus has not been taken into account.
Net nitrification rates (N) were estimated for the Born-holm Basin and the eastern Gotland Basin.
NhnmolL−1d−1i= 1mN2O
dbasin∗Vbasin∗n∗10−9∗rN2O (5)
(a)
(b) (c)
Fig. 4. Arkona Basin;(a)station 113 (Arkona Deep): left plot with profiles of N2O, N2O equilibrium concentration, NO−3, NO−2, right plot with profiles of temperature, salinity and oxygen, the arrow indicate the influence of North Sea Water; abbreviations see Fig. 2.;(b)
1N2O plotted against oxygen (at all stations in the Arkona Basin, y=−0.011 x+3.132,R2=0.67;n=18);(c)1N2O plotted against NO−3 (at all stations in the Arkona Basin, y=0.546 x−0.807,R2=0.66;n=18).
3 Results
In order to account for the hydrographic characteristics of the Baltic Sea and the direction of the inflow of North Sea Water, we present the results according to the following classifica-tions: I) well-mixed stations such as the Kiel, L¨ubeck and Pomeranian Bights and II) clearly stratified basins such as the Arkona, the Bornholm, the western and the eastern Got-land Basin (see Figs. 1, 2). For each basin selected profiles and empirically-tested correlations between N2O and param-eters such as oxygen and nitrate are shown.
3.1 Well-mixed stations
At shallow stations, with depths<30 m (station 10, 12, 22, 30, 41, 46, 121, 130, 133, 360, OB Boje, OB 4, Fig. 1), water columns were well mixed, and profiles showed nearly uniform vertical distributions of all parameters (Fig. 3a). Concentrations of N2O were near equilibrium; however the Pomeranian Bight (station 130, 133, OB Boje, OB 4) showed enhanced saturation values (104.6±7.9%) in com-parison with the bights to the west of it. In the Kiel Bight (station 360), and the L¨ubeck (station 22) and Mecklenburg
Bight (station 10, 12, 41, 46) the mean saturation value was 79.3±10.7%. No correlations were found between1N2O and other parameters like O2and NO−3 (Fig. 3b–c).
3.2 Stratified basins
Basins with water depths>30 m (Fig. 4–7) were clearly strat-ified into layers of well mixed Surface Water (sw), Winter (ww) and Bottom Water (bw) as described above. At sev-eral stations Bottom Water was affected by North Sea Wa-ter (abw), up to the Far¨o Deep in the northern part of the central Baltic Sea (Fig. 1, station 286) (Feistel et al., 2003). However, below 110 m the deep water of the Far¨o Deep was still anoxic, though with decreasing H2S concentrations from 125 m to the bottom (Fig. 6a, lower profiles). Stations in the western Gotland Basin such as the Landsort Deep (station 284, Fig. 7a) or the Karls¨o Deep (station 245, not shown) were still unaffected by the inflow event, and so below 80 m H2S concentrations were uniform.
3.2.1 Arkona Basin
(a)
(b) (c)
Fig. 5. Central Bornholm Basin;(a)station 213 (Bornholm Deep): left plot with profiles of N2O, N2O equilibrium concentration, NO−3, NO−2, right plot with profiles of temperature, salinity and oxygen, abbreviations see Fig. 2;(b)1N2O plotted against oxygen (at all stations in the Bornholm Basin, y=0.0003 x2−0.1531 x+19.517,R2=0.88;n=32);(c)1N2O plotted against NO−3 (at all stations in the Bornholm Basin, y=0.0585 x2+0.1438 x−0.6155,R2=0.90;n=32).
(10.9±0.7 nmol L−1)throughout the water column. In the Winter Water below the thermocline at 15 m O2 concentra-tions decreased, associated with increasing NO−2, NO−3 and NH+4. 1N2O was slightly negatively correlated with O2 (Fig. 4b), and positively correlated with NO−3 (Fig. 4c). At the bottom below 40 m inflowing North Sea Water (arrow in Fig. 4a) formed a 5 to 10 m thick oxygen enriched layer, however with no clear influence on the N2O concentration. 3.2.2 Bornholm Basin
In the Bornholm Basin (Fig. 5, stations 140, 200, 213 and 222), N2O profiles in the central basin (stations 200 (not shown) and 213 (Fig. 5a)) can be clearly distinguished from stations where water flows into and out of the basin. At sta-tion 140 (inflow, not shown) concentrasta-tions and distribusta-tion of N2O and1N2O were comparable to the Arkona Basin. At station 222 (outflow, not shown) N2O concentrations in the surface layer were uniformly near equilibrium at approx-imately 10 nmol L−1, below the surface layer concentrations were uniformly around 15.4 nmol L−1. In the central Born-holm Basin, at station 200 (not shown) and 213 (Fig. 5a) N2O concentrations increased rapidly within the layer af-fected by North Sea Water (abw, below 60 m), with N2O values up to 31.3 nmol L−1 (station 200). These were the highest values measured during the entire cruise. In water
masses above, N2O was near equilibrium, with slightly en-hanced 1N2O values in the “old” Bottom Water (bw, 40– 60 m). In the Bornholm Basin1N2O was clearly negatively correlated with oxygen and positively with NO−3 (Fig. 5b–c), but both correlations were nonlinear with polynomials pro-viding the best fits.
3.2.3 Eastern Gotland Basin
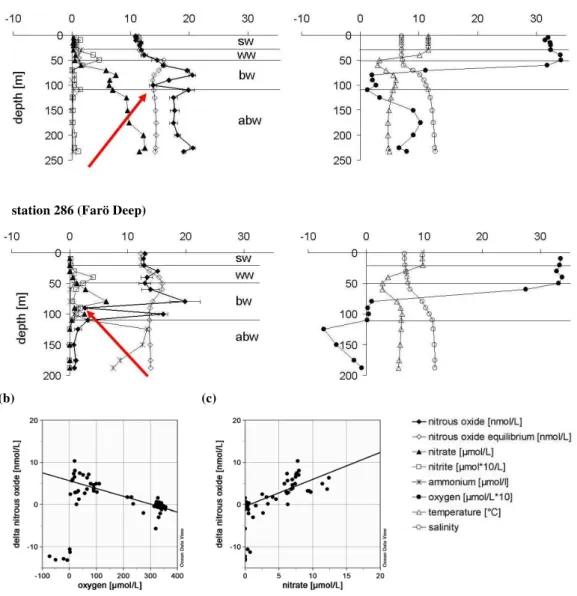
(a) station 271 (eastern Gotland Deep)
station 286 (Farö Deep)
(b) (c)
Fig. 6.Eastern Gotland Basin;(a)station 271 (Gotland Deep, upper plots) and 286 (Far¨o Deep, lower plots): left plots with profiles of N2O, N2O equilibrium concentration, NO−3, NO
−
2; right plots with profiles of temperature, salinity and oxygen, abbreviations see Fig. 2;(b)1N2O plotted against oxygen (at all stations in the Eastern Gotland Basin, y=−0.019 x+5.625,R2=0.67;n=62 (except for O2<3µmol L−1));(c) 1N2O plotted against NO−3 (at all stations in the Eastern Gotland Basin, y=0.639 x−0.459,R2=0.62;n=62 (except for O2<3µmol L−1)); H2S is expressed by the negative oxygen equivalent (1µmol L−1H2S=−2.00µmol L−1O2).
Except for the anoxic water masses,1N2O was linearly cor-related with O2and NO−3 (Fig. 6b–c).
3.2.4 Western Gotland Basin
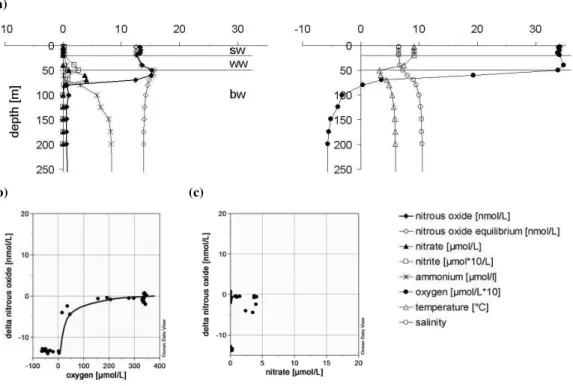
The western Gotland Basin with stations 284 (Fig. 7a), 245 and 240 revealed the “old” conditions, showing characteris-tics as yet unaffected by the latest intrusion of oxic North Sea Water. N2O in the surface layer (sw, 0–20/40 m) and Winter Water (ww, 20/40–60 m) was near equilibrium. Below 50 m, oxygen concentrations decreased rapidly and N2O concen-trations dropped sharply at the oxic/anoxic interface and
re-mained near zero in the anoxic deep waters. 1N2O values were negative and were not correlated with NO−3 (Fig. 7c). 1N2O was logarithmically correlated with oxygen (Fig. 7b).
4 Discussion
(a)
(b) (c)
Fig. 7.Western Gotland Basin;(a)station 284 (Landsort Deep): left plot with profiles of N2O, N2O equilibrium concentration, NO−3, NO−2, right plot with profiles of temperature, salinity and oxygen, abbreviations see Fig. 2;(b)1N2O plotted against oxygen (at all stations in the Western Gotland Basin; y=2.2467 Ln(x)−13.322,R2=0.86;n=29 (with exception of O2<0µmol L−1));(c)1N2O plotted against NO−3 (at all stations in the Western Gotland Basin); H2S is expressed by the negative oxygen equivalent (1µmol L−1H2S=−2.00µmol L−1O2).
almost permanently anoxic conditions (i.e. western Gotland Basin), with changes at non-regular intervals between anoxic and oxic conditions (i.e. Bornholm Basin, eastern Gotland Basin) (Feistel, 2003; Nausch, 2003a, b, c; Nagel, 2003; Wasmund, 2003).
The inflow event in January 2003 rapidly changed the en-vironmental conditions of the deep basins. With respect to the oxygen dependent production of N2O, our measured N2O concentrations reflect the continuum of unaffected and changing oxygen conditions quite well. In oxic and well mixed waters, vertical N2O profiles were homogenous, with concentrations near equilibrium (Fig. 3a). Anoxic deep wa-ter layers, unaffected by North Sea Wawa-ter (i.e. in the weswa-tern Gotland Basin), had N2O concentrations near zero (Fig. 7a). Therefore, in both cases no correlations between N2O and either oxygen or nitrate were found (Fig. 3b–c, Fig. 7c). In contrast, stratified and recently ventilated water bodies in the Bornholm and eastern Gotland Basin revealed N2O distri-butions that were clearly correlated with oxygen and nitrate (Fig. 5b–c, Fig. 6b–c).
These vertical N2O distributions are in general agreement with the few previously published N2O profiles from the cen-tral Baltic Sea (R¨onner, 1983; R¨onner and S¨orensson, 1985; Brettar and Rheinheimer, 1992). However, the past environ-mental settings of the deep central Baltic Sea basins were
different: N2O profiles from the central Baltic Sea reported by R¨onner (1983) were obtained when oxic conditions pre-vailed during August-September 1977 after a strong inflow event in 1976/1977 (Schinke and Matth¨aus, 1998). These N2O profiles are comparable to our profiles, measured from the well oxygenated Bornholm Basin during October 2003 (Fig. 5a). Anoxic conditions were re-established in July 1979 and May–June 1980. The shape of the N2O profiles from the then anoxic Gotland Deep, reported by R¨onner and S¨orensson (1985) is comparable to our N2O profiles from the western Gotland Basin (e.g., the Landsort Deep, Fig. 7a). The same applied to observations by Brettar and Rheinheimer (1991) in August 1986 and July 1987 during the 1983–1993 stagnation periods (Schinke and Matth¨aus, 1998).
In the following sections we discuss the processes that may determine the observed distributions of N2O in the different basins.
5 Hydrographic aspects
how-ever with higher absolute values than in the surface layer (see Fig. 5a–7a). Mainly hydrographic aspects were here respon-sible for the observed N2O distribution. This water mass is formed during winter convection, when N2O concentrations were in equilibrium with the atmosphere and this signal is conserved during stratification of the upper layer in summer. The lower temperature and hence higher N2O solubility dur-ing formation of the Winter Water are the reason for the en-hanced N2O concentrations in this layer.
N2O in the deep water of the Baltic Sea might be affected by the inflow of North Sea Water. Intrusion of N2O by North Sea Water should be detectable at stratified stations, where the inflow of North Sea Water was clearly identified. In the Arkona Basin (station 109 and 113) this inflow was de-tectable at the bottom by lower temperature and higher oxy-gen concentrations; however, N2O concentrations did not in-crease and remained close to equilibrium (Fig. 4a–b). These results point to small supply of N2O by North Sea Water, and are supported by measurements of Law and Owens (1990). They found N2O concentrations close to equilibrium up to approximately 10 nmol L−1in the North Sea. Thus, the en-hanced N2O values detected in layers affected by North Sea Water, for example in the Bornholm Basin (station 200 and 213), must originate from biological in situ production since the inflow, rather than advection.
5.1 Biological aspects
Previous studies demonstrated the existence of N2O produc-ing bacteria and investigated the biological pathways, namely nitrification and denitrification in the Baltic Sea (Bauer, 2003; Brettar and H¨ofle, 1993; Brettar et al., 2001). Both processes are commonly inferred by correlations between N2O and oxygen or nitrate (Yoshinari, 1976; Yoshida et al., 1989; Cohen and Gordon, 1978; Butler et al., 1989).
5.1.1 Anoxic waters
In general, in anoxic and H2S containing bottom waters N2O concentrations were constantly near zero, and therefore no correlation with either O2or NO−3 was found. The N2O pro-duction by nitrification and denitrification might probably be inhibited by the presence of H2S (Joye and Hollibaugh, 1995; Knowles, 1982, Sørensen et al., 1980), and while changing to anoxic conditions, N2O can be consumed during denitri-fication as an electron acceptor instead of oxygen (Elkins et al., 1978; Cohen and Gordon, 1978). However, in contrast to other authors (R¨onner et al., 1983; Brettar and Rheinheimer, 1992) we found low and uniformly distributed concentrations of N2O (up to 1.7 nmol L−1)in the anoxic water masses, which may have been residuals of a previous production pro-cess during oxic conditions.
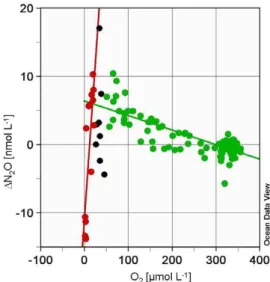
f08
Fig. 8. Correlation between1N2O and O2n the Baltic Sea. Cor-relations were calculated for oxic waters with O2 concentrations >50µmol L−1 (green coloured, y=−0.019 x+5.41, R2=−0.70; n=183) and <20µmol L−1 (red coloured, y=1.038 x−11.36, R2=0.81;n=12). These concentrations were empirically tested and gave the best fittings for both correlations.
5.1.2 Suboxic waters
In suboxic waters and at the boundary to anoxic water masses N2O is expected to be mainly produced by denitrification processes (Codispoti et al., 2001), usually indicated by de-creasing NO−3 concentrations and a secondary NO−2 peak (Wrage et al., 2001; Kristiansen and Schaanning, 2002). These indicators for denitrification were found only at the Far¨o Deep (station 286, 90 m). However, no accumulation of N2O was observed, rather a local minimum of N2O was found (Fig. 6a, indicated by arrows). Naqui and Noronha (1991) reported that minima of nitrate correlated to min-ima of N2O are typical for most suboxic zones. Hannig et al. (2005) investigated denitrification associated microorgan-isms in the Gotland Basin (station 271 and 286) in October 2003. They did not find denitrification activities in suboxic water masses, but a high denitrifying potential restricted to a narrow depth range at the oxic-anoxic interface and the sul-phidic zone. However, at these depths an accumulation of N2O was not found either. Thus, the observed N2O profiles might reflect previous redox transformations in the water col-umn.
f09
Fig. 9. Correlation between 1N2O and O2 in the Baltic Sea; Correlations were calculated for the Bornholm Basin (sta-tion 140, 200, 213, 222, green coloured, y=−6.83 Ln(x)+37.88, R2=0.86; n=40), the eastern Gotland Basin (station 259, 250, 260, 271, blue coloured, y=−0.02 x+5.88, R2=0.70; n=54) and the western Gotland Basin (station 284, 240, 245, red coloured, y=2.25 Ln(x)−13.32,R2=0.86;n=29). Anoxic data and station 286 were excluded. The correlations were empirically tested and gave the best fittings.
denitrification activity to a narrow depth range at anoxic-oxic boundaries was not only reported by Hannig et al. (2005) but also by Brettar et al. (2001). Therefore, the lack of denitri-fication signals seems to rule out denitridenitri-fication as a major process responsible for N2O production.
5.1.3 Correlation between N2O and O2
At O2 concentrations >50µmol L−11N2O is clearly neg-atively correlated with O2, indicating production by nitri-fication (see Fig. 8, green data points). At O2 concentra-tions<20µmol L−11N2O and O2 were significantly pos-itively correlated (see Fig. 8, red data points), data between 20µmol L−1and 50µmol L−1were extremely scattered (see Fig. 8, black data points). Our results suggest a production of N2O during nitrification until an oxygen threshold of around 20–50µmol L−1, although the exact threshold concentration cannot be established due to large scatter of the data. In the literature, threshold values of 2µmol L−1 for nitrifica-tion are reported (Carlucci and McNally, 1969; Gundersen et al., 1966). Below the threshold N2O seemed to be degraded; probably used as an electron acceptor instead of oxygen and thereby reduced to N2(Elkins et al., 1978; Cohen and Gor-don, 1978).
These findings suggest a change in N2O converting cesses either by different bacteria species or different pro-cesses. Bauer (2003) investigated NH+4 oxidizing
ria in the eastern Gotland Basin, and found similar bacte-rial communities at different depths; their nitrification activ-ities however depended on O2 concentrations. The oxygen sensitivity is species-specific and also enzyme-specific, with a broad range even between closely related species; there-fore the scatter of data might reflect the variety of involved species and enzymes (Geets et al, 2006, Jiang and Bakken, 2000; Goreau et al., 1980; Wetzel, 1983; Robertson et al., 1988; Richardson, 2000). Particularly in environments with rapidly changing conditions it is advantageous for microor-ganisms to be able to switch between different metabolic pathways. For several nitrifiers the ability to switch be-tween different processes such as “classical” nitrification, nitrifier-denitrification and aerobic denitrification has been shown (Wrage et al., 2001; Whittaker et al., 2000; Zart et al., 2000; Zehr and Ward, 2002). The change between aerobic and anaerobic metabolisms and thus the yield of N2O dur-ing these processes is probably controlled particularly by the O2oncentration, although little is known about the detailed mechanisms (Baumann et al., 1996; John, 1977; Sørensen, 1987).
Alternatively, it is also possible to interpret the data from the hydrographical or temporal point of view. Figure 9 shows the same data set as shown in Fig. 8. This time the data set is grouped not according to the oxygen concentrations but to the affiliation to different basins. Station 286 was excluded due to its transitional character. At this station anoxic condi-tions in the deep waters were found similar to other stacondi-tions in the western Gotland Basin, but H2S concentrations were decreasing towards the bottom. This indicates an early stage of ventilation, but still too weak to lead to oxic conditions.
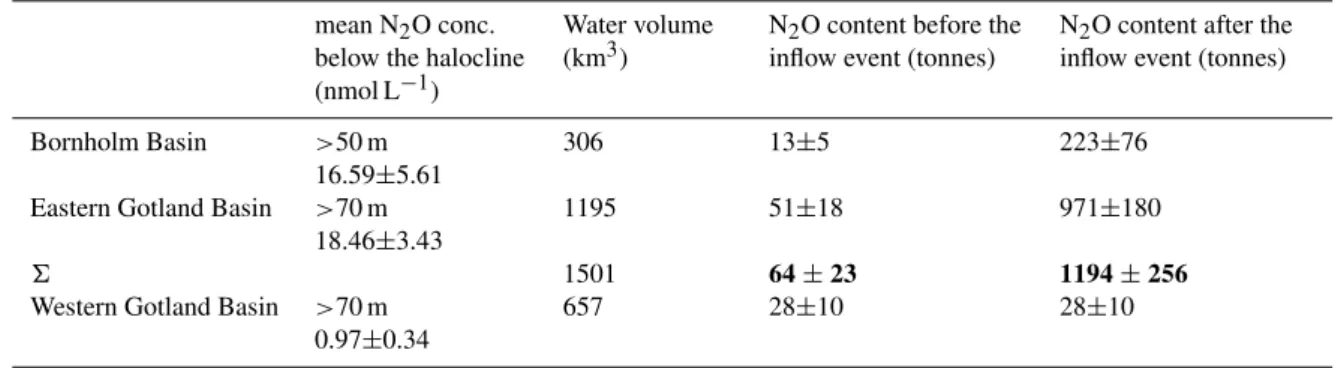
Table 1. Estimated N2O content of single basins in the Baltic Sea below the halocline, before and after the inflow of North Sea Water in January 2003.
mean N2O conc. below the halocline (nmol L−1)
Water volume (km3)
N2O content before the inflow event (tonnes)
N2O content after the inflow event (tonnes)
Bornholm Basin >50 m 16.59±5.61
306 13±5 223±76
Eastern Gotland Basin >70 m 18.46±3.43
1195 51±18 971±180
6 1501 64±23 1194±256
Western Gotland Basin >70 m 0.97±0.34
657 28±10 28±10
Table 2.Estimated nitrification rates in the Bornholm Basin and the eastern Gotland Basin, based on the assumption of 0.3% N2O release during nitrification (Seitzinger and Kroeze, 1998).
1mN2O (tonnes)
dbasin (day)
Water volume (km3)
N2O net production rate (nmol L−1d−1)
net nitrification rate (nmol L−1d−1)
Bornholm Basin 210±81 265 306 0.059±0.023 19.62±7.57 Eastern Gotland Basin 920±198 167 1195 0.105±0.023 34.92±7.52
by North Sea Water (Geets et al., 2006; Bodelier et al., 1996). In the western Gotland Basin (Figs. 7b–c, 9) no ventilation by North Sea Water had occurred by October 2003, therefore degradation of N2O at the oxic-anoxic interface was found. We suspect that the correlation between1N2O and O2in the Bornholm Basin and the eastern Gotland Basin will become similar to that of the western Gotland Basin with time, when the conditions change to anoxic.
5.2 Estimated N2O inventories before and after the North Sea Water inflow event
The North Sea Water inflow consisted of a water vol-ume of 200 km3 (Feistel and Nausch, 2003). With an assumed N2O concentration of 10±2 nmol L−1 (Law and Owens, 1990), the North Sea Water transported approxi-mately 88±18 tonnes N2O into the Baltic Sea.
Before the North Sea Water inflow, the deep waters below the halocline were anoxic, not only in the western but also in the eastern Gotland Basin and the Bornholm Basin (Schmidt, 2002). Thus, N2O concentrations near zero similar to mea-sured profiles in the western Gotland Basin in October 2003 (Fig. 7a) can be assumed. The mean N2O concentration in the western Gotland Basin was 0.97±0.34 nmol L−1.On the basis of these values the calculated N2O content of the Born-holm Basin and the eastern Gotland Basin was approximately 13±5 and 51±18 tonnes before the inflow (see Table 1).
After the inflow event the Bornholm Basin and the eastern Gotland Basin were clearly influenced by the North Sea
Wa-ter, whereas the western Gotland Basin was still unaffected (Nausch, 2003a; Nagel, 2003; Feistel, 2003; Nausch, 2003b; Wasmund, 2003; Nausch, 2003c). Based on these assump-tions, the N2O contents of the Bornholm Basin and the east-ern Gotland Basin, calculated with the mean of measured N2O concentrations below the halocline in these basins, were about 223±76 and 971±180 tonnes, respectively (Ta-ble 1). Thus, the North Sea Water led to a net production of 1130±233 tonnes N2O.
take into account the hydrographic aspects. The stratification of the water column probably leads to a reduced release of calculated amounts, and accordingly to an overestimation of N2O emissions.
Based on the calculated N2O content of the basins and the assumption of nitrification as the main production pathway net-nitrification rates were estimated (Table 2). These nitrifi-cation rates are in good agreement with previously published rates for the Baltic Sea (Enoksson, 1986; Bauer 2003). For the eastern Gotland Basin, Bauer (2003) calculated mean ni-trification rates of 21.6±11.1 nmol L−1 at 60 m depth, and 44.3±33.1 nmol L−1at 100 m depth.
These nitrification rates are low compared to rates pub-lished from other oceanic areas (e.g. Bianchi et al., 1999).
6 Summary
In January 2003 a major inflow of cold, highly saline and oxygen-rich North Sea Water was observed, terminating the ongoing stagnation period in parts of the central Baltic Sea.
– In agreement with previous studies, we found N2O pro-duction mainly in oxic water masses below the Winter Water layer.
– We found no indication for advection of N2O by North Sea Water; however, the environmental conditions for N2O production were clearly changed due to the North Sea Water inflow.
– The inflow leads to a stimulation of N2O production be-low the permanent halocline, but due to the halocline, the Baltic Sea is not a significant source of N2Oto the atmosphere.
– There was no indication for an accumulation of N2O during denitrification. In oxic and suboxic water masses nitrification seems to be the main production pathway. The occurrence of nitrifier-denitrification and aerobic denitrification is possible, but needs further investiga-tions.
Acknowledgements. We thank the officers and crew of R/V Gauss for their excellent support. We especially thank R. Hoffmann (MPI for Chemistry, Mainz) for the calibration of the standard gas mixtures, and the colleagues from the IOW for providing the CTD data and the nutrients. We thank Maren Voss, Wajih Naqvi, and G¨unther Uher for their comments which helped to improve the manuscript considerably. The study was financially supported by the Deutsche Forschungsgemeinschaft through grant WA1434/1. The German part of the HELCOM COMBINE program is conducted by the Leibniz Institut f¨ur Ostseeforschung Warnem¨unde on behalf of the Bundesamt f¨ur Seeschiffahrt und Hydrographie, Hamburg and is funded by the Bundesministerium f¨ur Verkehr, Bau und Stadtentwicklung, Berlin.
Edited by: S. W. A. Naqvi
References
Bange, H. W., Rapsomanikis, S., and Andreae, M. O.: Nitrous oxide in coastal waters, Global Biogeochem. Cycles, 10(1), 197–207, 1996.
Bange, H. W., Rapsomanikis, S., and Andreae, M. O.: Nitrous oxide cycling in the Arabian Sea, J. Geophys. Res.-Oceans, 106(C1), 1053–1065, 2001.
Bauer, S.: Structure and function of nitrifying bacterial communi-ties in the Eastern Gotland Basin (Central Baltic Sea), Rostock, Univ., Diss., 2003, H 2003 B 4373, 2003.
Baumann, B., Snozzi, M., Zehnder, A. J. B., and van der Meer, J. R.: Dynamics of denitrification activity ofParacoccus denitrifi-cansin continuous culture during aerobic-anaerobic changes, J. Bacteriol., 178(15), 4367–4374, 1996.
Bianchi, M., Fosset, C., and Conan, P.: Nitrification rates in the NW Mediterranean Sea, Aquat. Microb. Ecol., 17(3), 267–278, 1999. Bodelier, P. L. E., Libochant, J. A., Blom, C. W. P., and Laan-broek, H. J.: Dynamics of nitrification and denitrification in root-oxygenated sediments and adaptation of ammonia-oxidizing bac-teria to low-oxygen or anoxic habitats, Appl. Environ. Micro-biol., 62, 4100–4107, 1996.
Brettar, I. and H¨ofle, M. G.: Nitrous oxide producing heterotrophic bacteria from the water column of the central Baltic: abundance and molecular identification, Mar. Ecol. Prog. Ser., 94, 253–265, 1993.
Brettar, I., Moore, E. R. B., and H¨ofle, M. G.: Phylogeny and abun-dance of novel denitrifying bacteria isolated from the water col-umn of the central Baltic Sea, Microb. Ecol., 42(3), 295–305, 2001.
Brettar, I. and Rheinheimer, G.: Denitrification in the central Baltic: evidence for hydrogen sulfide oxidation as motor of denitrifica-tion at the oxic-anoxic interface, Mar. Ecol. Prog. Ser. 77(2–3), 157–169, 1991.
Brettar, I. and Rheinheimer, G.: Influence of carbon availability on denitrification in the Central Baltic Sea, Limnol. Oceanogr., 37(6), 1146–1163, 1992.
Butler, J. H., Elkins, J. W., Thompson, T. M., and Egan, K. B.: Tropospheric and dissolved N2O of the West Pacific and East Indian Oceans during the El-Nino Southern Oscillation event of 1987, J. Geophys. Res.-Atmos., 94(D12), 14 865–14 877, 1989. Carlucci, A. F. and McNally, P. M.: Nitrification by marine
bac-teria in low concentrations of substrate and oxygen, Limnol. Oceanogr., 14, 736–739, 1969.
Codispoti, L. A., Brandes, J. A., Christensen, J. P., Devol, A. H., Naqvi, S. W. A., Paerl, H. W., and Yoshinari, T.: The oceanic fixed nitrogen and nitrous oxide budgets: Moving targets as we enter the anthropocene?, Sci. Mar., 65, 85–105, 2001.
Codispoti, L. A., Yoshinari, T., and Devol, A. H.: Suboxic res-piration in the oceanic water column, in Resres-piration in aquatic ecosystems, edited by: Del Giorgio, P. A. and Williams, P. J. l. B., pp. 225–247, Oxford University Press, Oxford, 2005. Cohen, Y. and Gordon, L. I.: Nitrous oxide in the oxygen
mini-mum of the eastern tropical North Pacific: Evidence for its con-sumption during denitrification and possible mechanisms for its production, Deep-Sea Res., 25(6), 509–524, 1978.
and Resource Management, edited by: Flemming, B. W., Dela-fontaine, M. T., and Liebezeit, G., pp. 137–148, Elsevier Science, Amsterdam, 2000.
Elkins, J. W., Wofsy, S. C., McElroy, M. B., Kolb, C. E., and Ka-plan, W. A.: Aquatic sources and sinks for nitrous oxide, Nature, 275(5681), 602–606, 1978.
Enoksson, V.: Nitrification rates in the Baltic Sea: Comparison of three isotope techniques, Appl. Environ. Microbiol., 51(2), 244– 250, 1986.
Feistel, R.: IOW Cruise report 11/03/02, March 2003, http://www.io-warnemuende.de/projects/monitoring/documents/ cr110302.pdf, 2003.
Feistel, R., Nausch, G., Matth¨aus, W., and Hagen, E.: Temporal and spatial evolution of the Baltic deep water renewal in spring 2003, Oceanol., 45(2), 623–642, 2003.
Feistel, R. and Nausch, G.: Water exchange between the Baltic Sea and the North Sea and conditions in the deep basins, HEL-COM indicator fact sheets / Baltic Marine Environment Protec-tion Commission – Helsinki Commission, http://www.helcom.fi/ environment/indicators2003/inflow.html, 2003.
Geets, J., Boon, N., and Verstraete, W.: Strategies of aer-obic ammonia-oxidizing bacteria for coping with nutrient and oxygen fluctuations, FEMS Microbiol. Ecol., 58, 1–13, doi:10.1111/j.1574-6941.2006.00170.x, 2006.
Goreau, T. J., Kaplan, W. A., Wofsy, S. C., McElroy, M. B., Valois, F. W., and Watson, S. W.: Production of nitrite and nitrous oxide by nitrifying bacteria at reduced concentrations of oxygen, Appl. Environ. Microbiol., 40(3), 526–532, 1980.
Grasshoff, K., Ehrhardt, M., and Kremling, K. (Eds.): Methods of seawater analysis, Verlag Chemie, Weinheim, pp. 419, 1983. Gundersen, K., Carlucci, A. F., and Bostr¨om, K.: Growth of some
chemoautotrophic bacteria at different oxygen tensions, Experi-entia, 22, 229–230, 1966.
Hannig, M., Braker, G., Lavik, G., Kuypers, M., Dippner, J. W., and J¨urgens, K.: Structure and activity of denitrifying bacteria in the water column of the Gotland Basin (Baltic Sea), Abstract presented at the SPOT-ON conference 2005, Warnem¨unde, June 26–July 1, 2005.
HELCOM: Third periodic assessment of the state of the marine environment of the Baltic Sea 1989–1993, Balt. Sea Environ. Proc. no. 64b, p. 75, http://www.baltic.vtt.fi/balticinfo/index. html, 1996.
Jiang, Q. Q. and Bakken, L. R.: Nitrous oxide production and methane oxidation by different ammonia-oxidizing bacteria, Appl. Environ. Microbiol., 65, 2679–2684, 2000.
Jørgensen, B. B and Sørensen, J.: Seasonal cycles of O2, NO−3 and
SO2−4 reduction in estuarine sediments: The significance of a NO−3 reduction maximum in spring, Mar. Ecol. Prog. Ser., 24, 65–74, 1985.
John, P.: Aerobic and anaerobic bacterial respiration monitored by electrodes, J. Gen. Microbiol., 98, 231–238, 1977.
Joye, S. B. and Hollibaugh, J. T.: Influence of sulfide inhibition of nitrification on nitrogen regeneration in sediments, Science, 270, 623–625, 1995.
Knowles, R.: Denitrification, Microbiol. Rev., 46, 43–70, 1982. Kristiansen, S. and Schaanning, M. T.: Denitrification in the water
column of an intermittently anoxic fjord, Hydrobiologia, 469, 77–86, 2002.
Law, C.S., and Owens, N.J.P.: Denitrification and nitrous oxide in
the North Sea, Neth. J. Sea Res., 25(1-2), 65-74, 1990.
Meier, M. H. E.: Modelling the age of Baltic seawater masses: Quantification and steady state sensitivity experiments, J. Geo-phys. Res., 110, C02006, doi:10.1029/2004JC002607, 2005. Nagel, K.: IOW Cruise report 11/03/01, February 2003
http://www.io-warnemuende.de/projects/monitoring/documents/ cr110301.pdf, 2003.
Naqvi, S. W. A. and Noronha, R. J.: Nitrous oxide in the Arabian Sea, Deep-Sea Res., 38, 871–890, 1991.
Naqvi, S. W. A., Jayakumar, D. A., Narvekar, P. V., Naik, H., Sarma, V., D’Souza, W., Joseph, S., and George, M. D.: Increased ma-rine production of N2O due to intensifying anoxia on the Indian continental shelf, Nature, 408(6810), 346–349, 2000.
Nausch G.: IOW Cruise Report 40/03/22, January 2003, http://www.io-warnemuende.de/projects/monitoring/documents/ cr400322.pdf, 2003a.
Nausch G.: IOW Cruise Report 44/03/03, May 2003, http://www.io-warnemuende.de/projects/monitoring/documents/ cr440303.pdf, 2003b.
Nausch, G.: Cruise report 11/03/04, October 2003, http://www.io-warnemuende.de/projects/monitoring/documents/ cr110304.pdf, 2003c.
Nausch, G., Feistel, R., Lass, H.-U., Nagel, K., and Siegel, H.: Hydrographisch-chemische Zustandseinsch¨atzung der Ost-see 2003, Meereswissenschaftliche Berichte, 59(1), 1–80, 2004. Nausch, G., Matth¨aus, W., and Feistel, R.: Hydrographic and hy-drochemical conditions in the Gotland Deep area between 1992 and 2003, Oceanologia, 45(2), 557–569, 2003.
Ostrom, N. E., Russ, M. E., Popp, B., Rust, T. M., and Karl, D. M.: Mechanisms of nitrous oxide production in the subtropical North Pacific based on determinations of the isotopic abundances of nitrous oxide and di-nitrogen, Chemosphere: Global Change Science, 2(3–4), 281–290, 2000.
Popp, B. N., Westley, M. B., Toyoda, S., Miwa, T., Dore, J. E., Yoshida, N., Rust, T. M., Sansone, F. J., Russ, M. E., Ostrom, N. E., and Ostrom, P. H.: Nitrogen and oxygen isotopomeric constraints on the origins and sea-to-air flux of N2O in the olig-otrophic subtropical North Pacific gyre, Global Biogeochem. Cy-cles, 16(2), doi:10.1029/2001GB001806, 2002.
Prather, M., Ehhalt, D., Dentener, F., Derwent, R., Dlugokencky, E., Holland, E., Isaksen, I., Katima, J., Kirchhoff, V., Matson, P., Midgley, P., and Wang, M.: Atmospheric chemistry and green-house gases, in Climate Change 2001: The Scientific Basis. Con-tribution of Working Group I to the Third Assessment Report of the Intergovernmental Panel on Climate Change, edited by: Houghton, J. T., Ding, Y., Griggs, D. J., Noguer, M., Van der Linden, P. J., Dai, X., Maskell, K., and Johnson, C. A., pp. 239– 287, Cambridge University Press, Cambridge, UK, 2001. Richardson, D. J.: Bacterial respiration: A flexible process for a
changing environment, Microbiology, 146, 551–571, 2000. Robertson, L. A. and Kuenen, J. G.: Aerobic denitrification - Old
wine in new bottles, Anton Leeuwenhoek J. Microbiol., 50(5–6), 525–544, 1984.
Robertson, L. A., Vanniel, E. W. J., Torremans, R. A. M., and Kue-nen, J. G.: Simultaneous nitrification and denitrification in aero-bic chemostat cultures ofThiosphaera pantotropha, Appl. Envi-ron. Microbiol., 54(11), 2812–2818, 1988.
2188, 1983.
R¨onner, U., S¨orensson, F., and Holmhansen, O.: Nitrogen assimila-tion by phytoplankton in the Scotia Sea, Polar Biol., 2(3), 137– 147, 1983.
R¨onner, U. and S¨orensson, F.: Denitrification rates in the low-oxygen waters of the stratified Baltic Proper, Appl. Environ. Mi-crobiol., 50, 801–806, 1985.
Schinke, H. and Matth¨aus, W.: On the causes of major Baltic in-flows – an analysis of long time series, Continental Shelf Res., 18, 67–97, 1998.
Schmidt, M.: IOW Cruise Report 11/02/03, October 2002, http://www.io-warnemuende.de/projects/monitoring/documents/ cr110203.pdf, 2002.
Seitzinger, S. P. and Kroeze, C.: Global distribution of nitrous oxide production and N inputs in freshwater and coastal marine ecosys-tems, Global Biogeochem. Cycles, 12(1), 93–113, 1998. Seitzinger, S. P., Kroeze, C., and Styles, R. V.: Global distribution
of N2O emissions from aquatic systems: Natural emissions and anthropogenic effects, Chemosphere: Global Science Change, 2, 267–279, 2000.
Sørensen, J.: Nitrate reduction in marine sediment: Pathways and interactions with iron and sulfur cycling, Geomicrobiology J., 5(3–4), 401–422, 1987.
Sørensen, J., Tiedje, J. M., and Firestone, R. B.: Inhibition by sul-fide of nitric and nitrous oxide reduction by denitrifying Pseu-domonas fluorescens, Appl. Environ. Microbiol., 39(1), 105– 108, 1980.
Vollack, K. U. and Zumft, W. G.: Nitric oxide signaling and transcriptional control of denitrification genes inPseudomonas stutzeri, J. Bacteriol., 183(8), 2516–2526, 2001.
Wasmund, N.: IOW Cruise Report 44/03/07, July-August 2003, http://www.io-warnemuende.de/projects/monitoring/documents/ cr440307.pdf, 2003.
Weiss, R. F.: The solubility of nitrogen, oxygen and argon in water and seawater, Deep-Sea Res., 17, 721–735, 1970.
Weiss, R. F. and Price, B. A.: Nitrous oxide solubility in water and seawater, Mar. Chem., 8, 347–359, 1980.
Wetzel, R. G.: Limnology, Saunders College Publishing, Philadel-phia, Pa., 1983.
Whittaker, M., Bergnamm, D., Arciero, D. and Hooper, A. B.: Electron transfer during the oxidation of ammonia by the chemolithotrophic bacteriumNitrosomonas europaea, Biochim. Biophys. Acta, 1459, 346–355, 2000.
WMO: Scientific assessment of ozone depletion: 2002, pp. 498, WMO (World Meteorological Organization), Geneva, 2003. Wrage, N., Velthof, G. L., van Beusichem, M. L., and Oenema, O.:
Role of nitrifier denitrification in the production of nitrous oxide, Soil Biol. Biochem., 33(12–13), 1723–1732, 2001.
Yamagishi, H., Yoshida, N., Toyoda, S., Popp, B. N., Westley, M. B., and Watanabe, S.: Contributions of denitrification and mixing on the distribution of nitrous oxide in the North Pacific, Geophys. Res. Lett., 32(2), LO4603, doi:10.1029/2004GLO21458, 2005. Yoshida, N., Morimoto, H., Hirano, M., Koike, I., Matsuo, S.,
Wada, E., Saino, T., and Hattori, A.: Nitrification rates and15N abundances of N2O and NO−3 in the western North Pacific, Na-ture, 342, 895–897, 1989.
Yoshinari, T.: Nitrous oxide in the sea, Mar. Chem., 4, 189–202, 1976.
Yoshinari, T., Altabet, M. A., Naqvi, S. W. A., Codispoti, L., Jayakumar, A., Kuhland, M., and Devol, A.: Nitrogen and oxy-gen isotopic composition of N2O from suboxic waters of the eastern tropical North Pacific and the Arabian Sea – Measure-ment by continuous-flow isotope-ratio monitoring, Mar. Chem., 56(3–4), 253–264, 1997.
Zart, D., Schmidt, I., and Bock, E.: Significance of gaseous NO for ammonia oxidation byNitrosomonas eutropha, Antonie van Leeuwenhoek, 77, 49–55, 2000.