www.ocean-sci.net/8/287/2012/ doi:10.5194/os-8-287-2012
© Author(s) 2012. CC Attribution 3.0 License.
Ocean Science
Wave climate in the Arkona Basin, the Baltic Sea
T. Soomere1,2, R. Weisse3, and A. Behrens3
1Institute of Cybernetics at Tallinn University of Technology, Akadeemia tee 21, 12618 Tallinn, Estonia 2Estonian Academy of Sciences, Kohtu 6, 10130 Tallinn, Estonia
3Institute of Coastal Research, Helmholtz-Zentrum Geesthacht, Max-Planck-Strasse 1, Geesthacht, Germany Correspondence to:T. Soomere ([email protected])
Received: 22 October 2011 – Published in Ocean Sci. Discuss.: 21 November 2011 Revised: 5 April 2012 – Accepted: 5 April 2012 – Published: 17 April 2012
Abstract. The basic features of the wave climate in the Southwestern Baltic Sea (such as the average and typi-cal wave conditions, frequency of occurrence of different wave parameters, variations in wave heights from weekly to decadal scales) are established based on waverider measure-ments at the Darss Sill in 1991–2010. The measured cli-mate is compared with two numerical simulations with the WAM wave model driven by downscaled reanalysis of wind fields for 1958–2002 and by adjusted geostrophic winds for 1970–2007. The wave climate in this region is typical for semi-enclosed basins of the Baltic Sea. The maximum wave heights are about half of those in the Baltic Proper. The maxi-mum recorded significant wave heightHS=4.46 m occurred on 3 November 1995. The wave height exhibits no long-term trend but reveals modest interannual (about 12 % of the long-term mean of 0.76 m) and substantial seasonal variation. The wave periods are mostly concentrated in a narrow range of 2.6–4 s. Their distribution is almost constant over decades. The role of remote swell is very small.
1 Introduction
Observations, measurements and modelling of wave fields in the Baltic Sea basin go back for many decades (Schmager et al., 2008; Weisse and von Storch, 2010). Wave ob-servations from ships and simple fetch-based models have been extensively used for the compilation of older wave at-lases (Rzheplinsky, 1965). Visual observations from several coastal hydrometeorological stations of the former USSR have been performed since the 1950s (Soomere and R¨a¨amet, 2011b). Instrumental wave measurements were probably first launched at the end of the 1970s in Swedish coastal
waters (Broman et al., 2006). They have been performed sys-tematically from the 1980s in the northern Baltic Proper and in sea areas surrounding Finland (Kahma et al., 2003), and from the 1990s in the southern and Southwestern (SW) Baltic Sea (Pettersson et al., 2010). These studies have been com-plemented by several numerical reconstructions of the wave climate (J¨onsson et al., 2003; Augustin, 2005; Schmager et al., 2008; R¨a¨amet et al., 2010; R¨a¨amet and Soomere, 2010; Tuomi et al., 2011).
The input of wave studies into the climatology of the northern Baltic Proper is extensively documented (Kahma et al., 2003; Broman et al., 2006; Soomere, 2008; Soomere and R¨a¨amet, 2011b). A comparison of the instrumentally measured and visually observed wave parameters with the results of numerical simulations has revealed interesting spa-tial patterns of the Baltic Sea wave heights and approach di-rections and their remarkable changes at various time scales (Soomere et al., 2011). For example, open sea areas sepa-rated by only about 100 km may host completely different trends (Soomere and R¨a¨amet, 2011a). Moreover, the trends for average and extreme wave heights do not necessarily co-incide (Soomere and R¨a¨amet, 2011b). Part of these changes apparently are related to the systematic increase in South-Westerly winds over the last 40 yr in the Northeastern (NE) part of the Baltic Sea (Jaagus and Kull, 2011). Such changes are a probable reason for a considerable intensification of coastal processes in the vicinity of Neva Bay, which was sheltered from predominant waves in the past (Ryabchuk et al., 2011).
region hosts extremely dense ship traffic that is confined to narrow fairways, and is thus particularly vulnerable with re-spect to severe weather conditions. Also, most of the SW Baltic Sea coasts are easily erodible. Thus, any change in the local wave regime may substantially impact their evolution.
The seminal collection addressing the climate in the Baltic Sea basin (BACC, 2008) only presents the very basic aspects of the wave climate. The resolution of the existing reference books (Lopatukhin et al., 2006; Schmager et al., 2008) and global wave data sets such as KNMI/ERA-40 Wave Atlas (09.1957–08.2002, 1.5◦×1.5◦) (Sterl and Caires, 2005) is
far too sparse for an adequate representation of the typi-cal and extreme wave conditions in the southern part of the Baltic Sea. Information about the wave climate in this region is available mostly from numerical simulations (Gayer et al., 1995; Mietus and von Storch, 1997; Papli˜nska, 1999, 2001; Blomgren et al., 2001; Cie´slikiewicz and Herman, 2002; Au-gustin, 2005; Cie´slikiewicz and Papli˜nska-Swerpel, 2008; Schmager et al., 2008) and from relatively short-term mea-surement campaigns (M˚artensson and Bergdahl, 1987). Only very basic information about wave measurements carried out since 1991 at the Darss Sill and since 2002 in the Arkona Basin is available in the Helsinki Commission (HELCOM) documentation (e.g. Pettersson et al., 2010). Finally, long-term time series (since 1954) of visually observed wave pa-rameters from the Lithuanian coast have been used in com-parisons of the wave climate in the northern and southern Baltic (Kelpˇsait˙e et al., 2008, 2011; Zaitseva-P¨arnaste et al., 2011).
Information about climatological changes in wave param-eters in this area is controversial. A popular opinion in the 1980s–1990s was that the wave climate was becoming grad-ually more severe following the seemingly increasing stormi-ness (Alexandersson et al., 1998). This view was qualita-tively supported by the National Centres for Environmen-tal Prediction and for Atmospheric Research (NCEP/NCAR) reanalysis that revealed a significant increase in the annual mean wind speed at 850 hPa over the Baltic in 1953–1999 (Pryor and Barthelmie, 2003). The increase was most pro-nounced in the upper quartile of wind speeds and in the SW of the region. A clear increase was also noticed in the higher percentiles of wind speeds at the 10 m level (Pryor et al., 2005). Such an increase generally leads to a larger propor-tion of high waves. Somewhat surprisingly, it did not be-come evident in the wave fields in the Baltic Sea and was also not recognized in the adjacent North Sea (WASA Group, 1995, 1998). At some places even a long-term decrease in the frequency of severe wave conditions was found (Weisse and G¨unther, 2007).
Consistently with the above-described changes in wind speeds, wave reconstructions based on geostrophic winds indicated an increase in wave heights in the Arkona Basin since about 1970 (R¨a¨amet et al., 2010). The most promi-nent increase in the geostrophic wind speed (GWSP) oc-curred in wintertime (December–February) for the southern
and central parts of the Baltic Sea: the GWSP increased by ∼1.5 m s−1 in 1989–2007 compared to that in 1970–1988 (Lehmann et al., 2011). The spring season (March–May) hosts an increase in the GWSP by 0.5–1 m s−1in the Baltic together with a change in the wind direction from SW to west. During autumn, however, the GWSP decreased by 1.5– 2 m s−1for the western and central parts of the Baltic Sea. Although there seems to be no overall increase in the GWSP in the entire Baltic region, the above turn in the wind direc-tion apparently favours the increase in wave heights in the SW Baltic Sea. The wave height and period are often fetch-limited in this area and therefore frequently depend as much on the wind direction as on the wind strength.
We make an attempt to establish the basic features of the wave climate and its changes for the SW Baltic Sea. Long-term wave measurements are carried out at two locations of this region. A waverider has been operated by the Helmholtz-Zentrum Geesthacht (until 2010 the GKSS Research Centre) at the Darss Sill since 1991. Another wave recorder is oper-ated by the Federal Maritime and Hydrographic Agency of Germany (BSH) at a station northwest of Cape Arkona since 2002. A short analysis of both the data sets is available in the HELCOM information sheets (e.g. Pettersson et al., 2010). The data set from the device at Cape Arkona only covered 9 years till now and is not considered in this paper.
The wave parameters at the Darss Sill in 1991–2010 are compared with two long-term hindcasts, performed for 1958–2002 (Augustin, 2005; Schmager et al., 2008) and 1970–2007 (R¨a¨amet and Soomere, 2010), respectively. We start with the description of the instrumentally recorded and numerically simulated data sets. The wave climate is dis-cussed based on the distributions of the frequency of occur-rence of different wave heights and periods. The temporal changes to the wave heights are analysed on daily, weekly, annual and decadal scales. The comparison focuses on a sub-set hourly wave recordings for the interval 1991–2002.
2 Recorded and modelled data
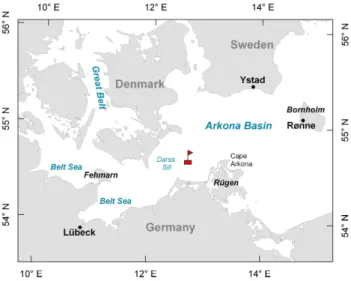
The 20 yr long time series (1991–2010) from the Darss Sill is the most valuable source of the wave information in the SW Baltic. The waves have been measured with a surface following buoy (Seawatch Directional Waverider, Barstow et al., 1994) since 29 January 1991. The water depth at the site (54◦41.9′N, 12◦42.0′E, Fig. 1) is 20 m. The buoy is moored
Fig. 1.Wave measurement sites at the Darss Sill and to the north of Cape Arkona.
Fig. 2.Number of records per day at the Darss Sill in 1991–2010. The red lines at the top of the panel indicate days with no measure-ments.
A few records represent unrealistic situations (such as sin-gle peaks of wave height >10 m or obviously incompati-ble height and period) and were excluded from the analysis. The pool of 190 300 consistent wave records covers 7305 calendar days in 1991–2010. At least one record per day exists for 6198 days (∼85 % of days). The data contains several longer gaps: 30 July–11 August, 16–18 August, 14 October–27 November 1991, 17 December 1991–23 April 1992, 1 February–1 May 1996 (caused by ice formation), 10 January–13 February 1997, May 2000, February 2006, Oc-tober 2009, March–May and December 2010 (Fig. 2). The gaps are distributed unevenly over the calendar year (Fig. 3). There are very few gaps in June and July. The autumn sea-son (September–beginning of December) is equally well rep-resented. Typically, about 90–95 % of days in these months are covered by at least one wave record. The lowest percent-age (about 70 %) of days covered by measurements is at the end of December and in January–February and April.
Fig. 3. Monthly average percentage of successful measurements. The expected number of measurements per day is 8 until May 1998 and 48 since then. The coverage>99 % is indicated in green.
Fig. 4. Percentage of calendar days with at least one successful measurement in 1991–2010.
The number of records per day varies over time (Fig. 4). During the first years of measurements (1991–1997) the wave parameters were usually recorded 8 times a day at the main and intermediate synop-tic times (00:00 UTC, 03:00 UTC, 06:00 UTC, 09:00 UTC, 12:00 UTC, 15:00 UTC, 18:00 UTC and 21:00 UTC). Start-ing from 19 May 1998 about 48 records a day (twice an hour) are available. The number of records fluctuates between al-most zero and 50 a day in 2001–2003. Figure 3 characterizes the number of records in single months compared with the usual amount of records per day (8 or 48) for the particular month. The success rate is about 80 % in 1991–1997 and about 77 % in 1999–2010. In 1993 and 2007 this rate was
>95 % whereas it was 53 % in 1992 and as low as 28 % in 2002.
mention height or period, having in mind the integrated pa-rameters.
The simulations differ by the time span, wind data, fre-quency range, treatment of wave field at open boundaries and ice cover. The first hindcast (called the AW simula-tions below) reflects the period of 1958–2002 (Augustin, 2005; Weisse et al., 2009). The forcing wind fields were derived from an atmospheric reconstruction using a re-gional atmosphere model (Feser et al., 2001) driven by the hourly winds from the NCEP/NCAR reanalyses (Kalnay et al., 1996; Kistler et al., 2001). At the lateral boundaries wave information from a corresponding North Sea hindcast (Weisse and G¨unther, 2007) was used. The model uses 28 frequency bins ranging from about 0.05 to 0.66 Hz. The im-pact of ice was accounted for using monthly ice coverage from the BSH observations.
Another hindcast (called the RS simulations below) was performed for 1970–2007 (R¨a¨amet and Soomere, 2010). Dif-ferently from the above simulations, the WAM model was driven by adjusted geostrophic winds from the Swedish Me-teorological and Hydrological Institute with a spatial reso-lution of 1◦ and temporal resolution of 3 or 6 hours. The
geostrophic wind speed was multiplied by 0.6 and the di-rection turned 15◦anti-clockwise to yield an estimate of the
wind at the 10 m level. This approximation, equivalent to one of the options analysed in (Bumke and Hasse, 1989), is frequently used in the Baltic Sea region. Although stabil-ity questions of the air flow are completely ignored in this approximation, it leads to an acceptable reproduction of both circulation and wave patterns (Myrberg et al., 2010; Soomere and R¨a¨amet, 2011a, b). Wave propagation from the North Sea and the presence of ice were ignored. An extended fre-quency range up to about 2 Hz (wave periods down to 0.5 s, 42 frequency bins) was used to ensure realistic wave growth rates in low wind conditions after calm situations (Soomere, 2005).
Each of these hindcasts reflects somewhat different fea-tures of waves. The AW simulations use relatively high-resolution wind information. As they cover a comparatively narrow range of frequencies, they may fail to resolve high-frequency wave components. The RS simulations use low-resolution wind information but are specifically tuned to rep-resent low and short waves that are frequent in sheltered and/or nearshore domains of the Baltic Sea.
3 Wave climate
A comparison of the measured data with the simulated sets is not straightforward because different data sets represent different time intervals. The simulated data sets are homo-geneous but the recorded data set contains extensive gaps. Moreover, measurement instants vary and the number of records largely varies for different days. For this reason the analysis below primarily relies on a pool of 47 078 hourly
records in 1991–2002 and on the corresponding simulated data for the same time instants. These sets are called over-lapping data in what follows. Alternatively, we use its sub-set of 26 127 records at the main and intermediate synop-tic times (called ST data below). This subset is consid-erably more homogeneous and less serially correlated than the hourly data. The entire pool of recorded data in 1991– 2010 is only used to demonstrate that the results obtained from the above subsets well represent the long-term param-eters of the wave climate and for the analysis of possible changes in the wave heights and periods. Occasionally we also compare measured and simulated data for different in-tervals to demonstrate that many features of the wave climate are very stable over decades.
3.1 Average and extreme wave heights
The average measured wave height (0.76 m) is almost the same for different subsets of records in 1991–2002 (Table 1). Therefore, the listed sources of inhomogeneities have a lim-ited impact (<0.2 %) on the estimates of this quantity. More-over, small variations (∼1 %) in the average wave height for largely different time intervals (1991–2002 and 1991–2010, Table 1) suggest that no long-term trend in wave heights ex-ists at the study site.
The average hindcast wave height for the overlapping data is slightly larger, 0.846 m in the AW simulations and 0.798 m in the RS simulations. While the average for the RS simula-tions for 1970–2007 is almost the same, the long-term aver-age for the AW simulations for 1958–2002 (0.836 m) indi-cates a slight increase in the wave intensity since the mid-1990s.
The differences between the measured and hindcast aver-age wave height primarily reflect the quality of the driving winds. The AW simulations with downscaled NCEP/NCAR reanalysed winds overestimate the wave heights by ∼8 %. The bias (0.085 m) and root-mean-square (rms) difference (0.41 m) of the recorded and AW-hindcast wave heights are about the same as reported by Cie´slikiewicz and Papli˜nska-Swerpel (2008) for a few months in 1997–1998 at Niechorze near the Polish coast (0.09 m and 0.36 m, respectively).
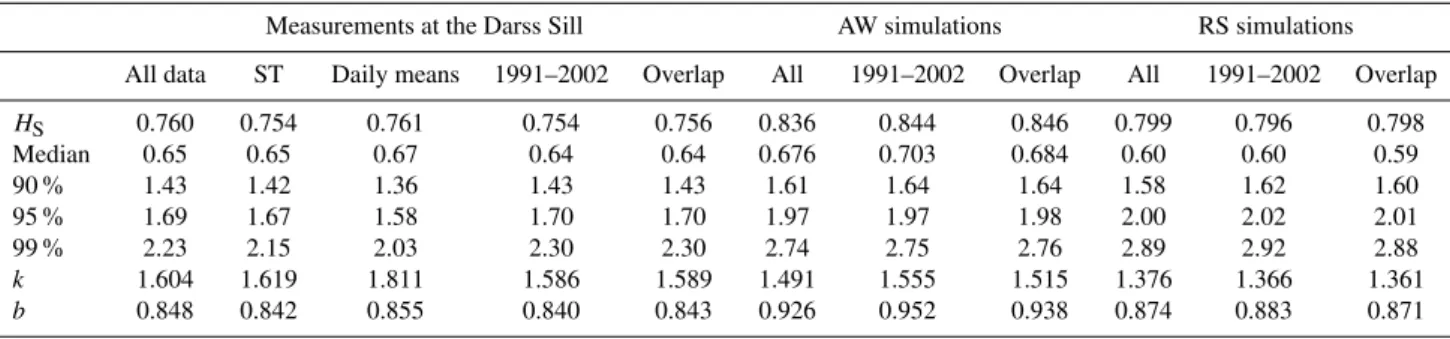
Table 1. Basic parameters of the wave climate at the Darss Sill: long-term significant wave heightHS, median wave height, 90 %-ile, 95 %-ile, 99 %-ile, and the shape (k)and scale (b)parameters of the corresponding Weibull distributions. The parameters are calculated for all existing data (All data), main and intermediate synoptic times (ST), daily means, all data in 1991–2002, and for the overlapping data set (Overlap).
Measurements at the Darss Sill AW simulations RS simulations
All data ST Daily means 1991–2002 Overlap All 1991–2002 Overlap All 1991–2002 Overlap
HS 0.760 0.754 0.761 0.754 0.756 0.836 0.844 0.846 0.799 0.796 0.798
Median 0.65 0.65 0.67 0.64 0.64 0.676 0.703 0.684 0.60 0.60 0.59
90 % 1.43 1.42 1.36 1.43 1.43 1.61 1.64 1.64 1.58 1.62 1.60
95 % 1.69 1.67 1.58 1.70 1.70 1.97 1.97 1.98 2.00 2.02 2.01
99 % 2.23 2.15 2.03 2.30 2.30 2.74 2.75 2.76 2.89 2.92 2.88
k 1.604 1.619 1.811 1.586 1.589 1.491 1.555 1.515 1.376 1.366 1.361
b 0.848 0.842 0.855 0.840 0.843 0.926 0.952 0.938 0.874 0.883 0.871
The median wave height for the overlapping data is 0.64 m. The thresholds for 10 %, 5 % and 1 % of the high-est wave heights (called 90 %-ile, 95 %-ile and 99 %-ile in what follows) are 1.43 m, 1.68 m and 2.22 m, respectively. The insignificant variation of similar values for other subsets of measured data (Table 1) indicates that the frequency of oc-currence of different wave heights is represented well by any of these subsets.
An analysis of extreme wave conditions at the Darss Sill is presented in (Soomere and Kurkina, 2011) and we bring here only a few key facts. The seas withHS>2 m are already very severe in this area and occur during about 1 % of the time, or during∼100 hours yr−1. A similar threshold for the open Baltic Proper is 4 m (Kahma et al. 2003). Waves higher than 3 m occur with a frequency of about 0.15 %, that is, dur-ing∼13 hours yr−1. Waves higher than 4 m were measured in three storms during the 20 yr under study. In a long wave storm on 10–11 January 2010, the wave height was close to 4 m during about 30 h. The largest reliably recorded wave height (4.46 m) occurred on 3 November 1995 in a strong NE storm when the AW-hindcast wave height was 3.92 m. The maximum numerically simulated wave height (6.23 m in the AW simulations) occurred on 26 January 1990.
3.2 Diurnal variations and daily mean wave heights
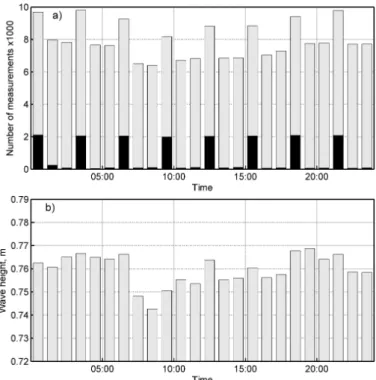
The large number of available measurements makes it pos-sible to evaluate the magnitude of diurnal variations in the wave height. Such variations play a role in areas affected by strong breezes where they may lead to an increased level of cross-seas and pose a certain danger to smaller vessels (Vethamony et al., 2011). The measurements at the Darss Sill are distributed almost evenly over the day (Fig. 5a). Only the main and intermediate synoptic times contain more measure-ments because the recordings mostly exist for these times in 1991–1998. This difference does not become evident in the diurnal course in the wave height (Fig. 5b). On average, wave heights are largest over night (02:00–07:00 UTC) and late evening between 18:00 and 22:00 UTC. The extension
of the diurnal variation is 0.026 m (about±1.7 % from the average of 0.76 m) and standard deviation of hourly values is σ=0.0067 m. In single months (February, April–May, September, October) the relative daily course is much larger, up to±7.6 % (σ=0.021 cm, mean wave height 0.57 m) in May. There is, however, no statistically significant pattern in these variations in single months or over selected seasons.
A combination of the changing number of records per day with a pronounced diurnal variation may affect the estimates of the climatological parameters of wave fields. The above analysis suggests that these issues insignificantly impact such estimates based on the Darss Sill data set. The associated inhomogeneity can be removed by using the daily average wave height. Doing so is important if the number of records a day varies seasonally (Zaitseva-P¨arnaste et al., 2009; 2011). This procedure usually leads to adequate estimates of the av-erage wave parameters but may significantly alter their dis-tributions. The average and median daily mean wave height (0.76 m and 0.67 m, respectively) almost coincide with simi-lar values for the different subsets of recordings. The higher percentiles for the daily mean wave heights (Table 1), how-ever, differ substantially from similar values calculated for single records. This is not unexpected: the use of daily means naturally leads to an increase in the proportion of medium values at the expense of very low and very high waves. This difference is further discussed below.
3.3 Distributions of wave heights
Fig. 5. (a)Number of measurements each hour (filled bars indicate the number of measurements before 19 May 1998);(b)diurnal variation in the average wave height.
cent, respectively. This match strengthens the conjecture that the largely varying number of measurements a day insignif-icantly affects the estimates of the parameters of the wave climate from the particular data set.
The hindcasts adequately reproduce the frequency of seas with 0.5≤HS<1.5 m but tend to overestimate the propor-tion of rougher wave fields with HS>1.5 m. The frac-tion of low waves (HS<0.125 m) is very small (Fig. 7). The largest discrepancy between the recorded and hindcast waves occurs for the range of wave heights of 0.125–0.5 m. Both simulations underestimate the frequency of low waves (0.125–0.375 m) and overestimate the frequency of seas with 0.375≤HS<0.5 m. As a result, the overall maximum of the modelled distributions is at 0.375≤HS<0.5 m like in the similar distribution for daily mean wave heights. Still, both the models adequately reproduce the overall proportion of wave fields withHS<0.5 m: the measured data contain 37 % of such fields, the AW and RS hindcasts 33 % and 41 %, respectively.
The difference between the empirical and simulated distri-butions can be additionally quantified using the correspond-ing Weibull distributions. This comparison once more indi-cates that the AW simulations (shape parameterk=1.515)
reasonably reproduce the basic features of the wave climate at the Darss Sill. A clearly smaller value ofk=1.36 (Ta-ble 1) suggests that the RS-hindcast distribution of wave heights is considerably wider than the measured one.
As expected, the daily mean wave height has a clearly smaller frequency for the lowest and the largest values. The central part of its distribution (Fig. 6) is almost flat and daily mean heights of 0.25–0.625 m occur with an almost equal frequency. This is balanced by a somewhat larger frequency of seas with 0.375≤HS<1.25 m than in the distribution for single records. The discussed differences are vividly re-flected in the relevant Weibull distributions. The distribu-tion for daily mean wave heights has a clearly larger shape parameter (k=1.8112)than similar distributions for single measurements. This dissimilarity would lead to obvious dif-ferences in the estimates for the probabilities of occurrence of severe seas.
Interestingly, the distributions of hindcast wave heights calculated for the overlapping data and for the entire hindcast period (1958–2002 and 1970–2007, respectively) almost co-incide. For the AW simulations the difference is the largest (about 1 per cent) for very low waves (HS<0.125 m) and is below 0.5 per cent for all other bins. The RS simulations reveal the largest difference (0.77 per cent) for the range of 0.25–0.375 m. This feature suggests that the shape of this distribution exhibits very limited changes over decades. 3.4 Distributions of periods
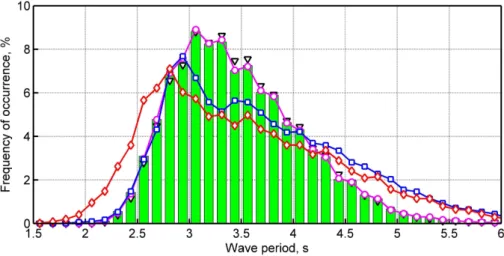
The distribution of the occurrence of mean wave periods (T−1, Fig. 8) has a general bell shape, slightly skewed
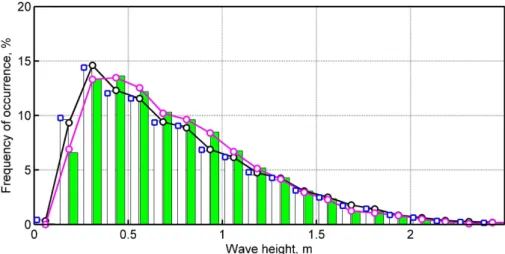
Fig. 6. Frequency of occurrence of different measured wave heights in the overlapping data set (white bars, 1991–2002), at main and intermediate synoptic times (blue squares, 1991–2010), in all measurements (black circles, 1991–2002) and in daily average wave heights in 1991–2002 (magenta circles) and in 1991–2010 (green bars).
Fig. 7. Frequency of occurrence of different wave heights in the overlapping data set in 1991–2002 based on measurements (white bars representing the same set as in Fig. 6), AW simulations (cyan bars) and RS simulations (yellow bars). Blue and red circles correspond to the entire set of AW (1958–2002) and RS (1970–2007) simulations, respectively.
of the Baltic Sea (Soomere, 2008; Soomere and R¨a¨amet, 2011b). Interestingly, wave periods are concentrated in quite a narrow range. Waves with periods of about 3 s are the most frequent. About 50 % of all seas are within the period range of 2.7–3.6 s and about 70 % in the range of 2.6–4 s. The frac-tion of seas with periods exceeding 4, 5, 6, and 7 s is also relatively low: 10.85 %, 0.55 %, 0.075 % and 0.007 %, spectively. This is not unexpected as a small fraction of re-mote swell is typical for the Baltic Sea (Broman et al., 2006; Soomere, 2008).
The almost total absence of seas with mean periods be-low 2 s (∼0.02 %) in wave records is not realistic for smaller sub-basins of the Baltic Sea. It evidently stems from the lim-itation of the waverider. According to the manufacturer, the device captures wave periods 1.6–30 s. The fraction of seas
Fig. 8. Frequency of occurrence of different mean wave periods (T−1)in the overlapping data set of measurements (bars) and AW (blue squares) and RS (red diamonds) simulations in 1991–2002. Triangles show the distribution of all recorded wave data in 1991–2010.
with slightly longer periods and may artificially enhance the peak for periods around 3 s in Fig. 8.
The hindcast distributions of wave periods also have a steep slope for mean periods below 3 s. A very small frac-tion of waves withT−1<2.2 s in the AW hindcast is also not realistic and apparently reflects the limited frequency range (periods >1.5 s) of the model. The RS simulations cover frequencies periods down to 0.5 s and advocate a consider-able fraction of waves with periods of 2–2.5 s.
All distributions in question have a two-peak appearance. The above suggests that the main peak at 3 s may be to some extent enhanced at the expense of seas with smaller periods for the measured data and for the AW simulations. The pres-ence of a secondary peak at periods of∼3.5 s (which is more clearly evident in the hindcast distributions) may be associ-ated with a superposition of two wave regimes in the Darss Sill region: locally excited waves with typical mean periods of∼3 s and wave systems with periods of>3.5 s approaching from the Arkona Basin and Baltic Proper.
The modelled distributions considerably (by∼30 %) un-derestimate the fraction of seas with periods of 3–4 s and substantially (up to three times for selected frequency bins) overestimate the fraction of periods>4 s. Both simulations suggest that even periods>6 s may occur with an apprecia-ble frequency. Waves with such periods cannot be generated locally by predominant westerly winds because of limited fetch. Therefore, a large proportion of long waves accord-ing to hindcasts probably reflects an overestimation of the chances for remote swells formed in the Baltic Proper to pen-etrate to the Darss Sill area.
Similarly to the distributions of wave heights, the distribu-tions of periods for different subsets of measured data almost coincide (Fig. 8). The same conclusion is true for the simu-lated distributions. Moreover, the distributions for the entire AW and RS hindcasts (not shown) practically coincide with the ones presented in Fig. 8: the differences are<0.5 per
cent for single frequency bins. Consequently, the distribu-tion of wave periods, either measured or calculated, is stable on a decadal scale at this site. This conjecture matches a con-clusion of (Soomere and R¨a¨amet, 2011b) about very limited changes in the modelled wave periods in the Baltic Sea.
3.5 Joint distributions of heights and periods
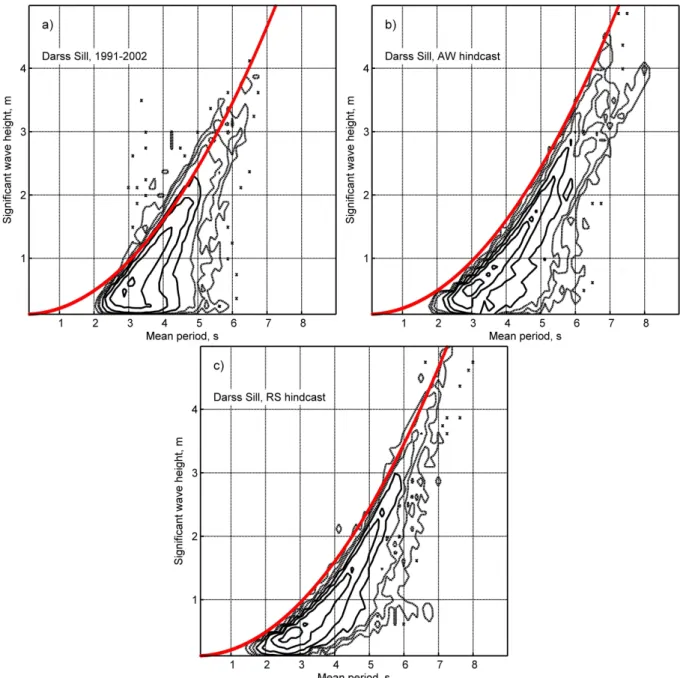
The distribution of the occurrence of measured combinations of wave heights and periods (Fig. 9; sometimes called scatter diagrams) has a shape generally characteristic of the Baltic Sea conditions (Soomere, 2008). These combinations are typically concentrated along the line corresponding to sat-urated wave fields with a Pierson-Moskovitz (PM) spectrum. This feature is particularly apparent for relatively severe seas, withHS>2 m. It evidently stems from the small size of the Belt Sea and the Arkona Basin where most of the wave fields develop in fetch-limited conditions. Therefore, their parame-ters should generally follow a JONSWAP spectrum (Komen et al., 1994), for which also the wave height increases pro-portionally to squared period.
The branch of low and long waves, usually the predom-inant one in the open ocean, is almost missing in Fig. 9. Consequently, swell excited in the Baltic Proper infrequently reaches the study area. Remotely excited waves are only represented in a few occasions withHS<1.2 m and periods of 5–6 s. The relevant storms are evidently localised in the southern Baltic because storms covering the entire Baltic Sea usually excite even longer swells (Soomere, 2008; Soomere and R¨a¨amet, 2011b).
Fig. 9.The number of different combinations of wave heights and periods in the overlapping data set of measurements at the Darss Sill(a) and AW(b)and RS(c)simulations. The red line indicates the parameters of wave fields with a Pierson-Moskowitz (PM) spectrum. The peak
periodTp, mean periodT−1and significant wave height of such seas satisfy the relationshipsTp=8.5π q
HS
(4g)andTp≈1.2965T−1, wheregis the gravity acceleration. The contour lines are drawn for 1, 3, and 10 cases (dashed) and 33, 100, 330, and 1000 cases (solid). The resolution for both wave heights and periods is 0.125.
fraction of low waves (HS<0.5 m) with periods of 3–4 s in Fig. 9. The AW simulations (Fig. 9b) indicate a slightly larger proportion of seas with periods<2 s but apparently fail to correctly capture some of such seas because only periods
>1.5 s are accounted for. The wave periods in the RS sim-ulations extend down to about 0.5 s and the results advocate the presence of a considerably larger fraction of short-wave-dominated seas (Fig. 9c).
are similar in the region of severe seas withHS>2 m and suggest that one should expect steep severe seas with a min-imum amount of longer wave components at this site during strong storms. Consistently with Fig. 8, the hindcasts overes-timate the fraction of seas with periods 5–6 s andHS≈1 m.
Lopatukhin et al. (2006) suggest that such scatter diagrams are a useful tool for roughly estimating the combinations of wave heights and periods in the strongest storms over many decades and for verifying whether the hindcast extreme wave parameters are realistic. The diagrams in Fig. 9 suggest that, according to the measurements, the roughest seas at the Darss Sill site, which occurred once in 20 yr, may have wave heights slightly exceeding 4 m and the mean period of about 7 s. The RS simulations suggest the roughest seas have the same mean period but wave heights close to 5 m. The AW simulations suggest that in one “population” of strongest storms, the wave height and may reach about 4.5 m and pe-riod is also 7 s. The most severe representative of another “population” of storms would apparently have slightly lower wave heights (∼4.3 m) but the mean period would be∼8 s. These estimates roughly match the parameters of the mea-sured extreme seas: the mean wave period was 6.6 s in the strongest wave storm in November 1995 (HS=4.46 m) and 6.1 s in two occasions in February 2005 and January 2010 when the wave height was 4.01 m.
4 Seasonal and long-term variations in wave heights
An extensive seasonal course of (monthly mean) wave heights (Fig. 10) is a well-known feature of the Baltic Sea wave fields (BACC, 2008; Schmager et al., 2008). The po-tential impact of a different number of records a day on this course was minimized by calculating first the daily mean wave heights. This seasonal cycle follows a similar course of wind speed in the area in question, with a calm period in April–August and November–February as windy months (Mietus, 1998).
Recent research has revealed a major shift of stormy winds from late autumn to winter months (Lehmann et al., 2011). This is accompanied by a certain change to the wind direc-tion. In order to establish whether and how these changes be-come evident at the Darss Sill, we calculated monthly mean wave heights for five 4 yr intervals. The resulting courses follow the monthly course of the percentage of high winds at Lighthouse Kiel (Lehmann et al., 2011). In average, the highest waves are present in January and February and even a minor local maximum is clearly evident in June. While there are certain fluctuations in the wave heights for differ-ent 4 yr periods, wave activity has been continuously high in February. Interestingly, two courses in question (for 1991– 1994 and 2007–2011) closely follow the seasonal course of high winds of (Lehmann et al., 2011), while for several other intervals the average wave heights in November and Decem-ber exceed those in January.
Fig. 10. Recorded (green bars) and AW-hindcast (white bars) monthly mean wave heights at Darss Sill for the overlapping data set in 1991–2002 and for recorded monthly mean wave heights for four-year intervals. Note that green bars only represent the average of three 4 yr intervals covering the years 1991–2002.
A recent analysis of historical visual observations has re-vealed substantial variations on weekly scales in the mean wave height for each calendar day in the northern part of the Baltic Sea, some of which were similar at sites separated by 100s of km (Soomere et al., 2011). The annual course of this quantity for the Darss Sill (not shown) also contains substantial weekly-scale fluctuations with a magnitude (up to 0.4 m) comparable with that of the usual seasonal course. Selected weeks of the calmest months (May–July) may host seas that are, on average, as severe as typical wave fields in windy months. Moreover, there apparently exist system-atic variations in the wave activity within the transitional months (March–April and September–October). The pattern of weekly-scale variations apparently is mostly random at the Darss Sill and does not persist over longer time intervals.
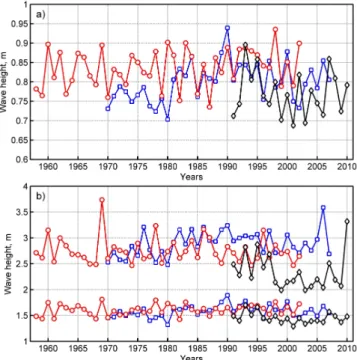
The measured annual mean wave heights vary from 0.68 m up to 0.89 m (from−12 % to +16 % of the average) at the Darss Sill in 1991–2010 (Fig. 11a). The standard deviation (std) of the annual values isσ=0.057 m. The hindcast an-nual mean wave heights vary within a comparable range, from 0.74 m to 0.94 m (about ±12 %; σ=0.066 m) in the AW simulations and from 0.70 to 0.94 m (σ =0.051 m) in the RS simulations. This range of variations apparently char-acterises the particular site. The above analysis has shown that it is sheltered from many storms that occur in the Baltic Proper. Wave parameters here are mostly determined by the local wind speed and fetch length; and these do not vary substantially.
Fig. 11.Long-term course of annual characteristics of wave fields at the Darss Sill:(a)annual mean wave height;(b)annual 90 %-iles (lower set of markers) and 99 %-iles (upper set of markers). Dia-monds show measured waves, circles represent the AW simulations and squares show the RS simulations.
matches the course of visually observed data at the Lithua-nian coast (Zaitseva-P¨arnaste et al., 2011). The variance of the annual mean wave heights is, however, so large that no firm conclusions can be drawn.
The measured data exhibit a weak decrease (about 9 mm/decade) in the annual mean wave height. The over-all linear decrease (0.018 m in 20 yr) is much smover-aller than the std of the annual wave height and the associated trend is far from being statistically significant. The sim-ulated data sets match this decrease for the overlapping time interval (33 mm/decade in the measurements in 1991– 2002), for which the AW simulations show a weak de-crease (12 mm/decade) and the RS simulations reveal a much steeper decrease (54 mm/decade). Given the relatively large variance of annual mean wave heights it is not surprising that none of these trends is statistically significant.
The full sets of simulated data show, however, a weak increase: the AW hindcast by 9 mm/decade for 1958–2002 and the RS hindcast by 17 mm/decade for 1970–2007. The strongest decadal-scale trend (61 mm/decade) is evident in the RS simulations for 1970–1990 but is still far from being statistically significant.
The behaviour of the annual values of the 90 %-iles and 99 %-iles of recorded wave parameters (Fig. 11b) is qualitatively similar to that of the annual average wave height. The percentiles exhibit a larger interannual variability
(σ=0.10 m andσ=0.35 m for the 90 %-iles and 99 %-iles, respectively) and relatively high peaks (up to 40% higher than the average values for the 99 %-iles). The 90 %-ile de-creased at a rate of 56 mm/decade and the 99 %-ile at a rate of 67 mm/decade, respectively. Notice that the latter rate would have been considerably larger without the evident peak in 2010 (Fig. 11b). These changes are also not significant.
The match between the measured and hindcast higher per-centiles is not as good as the match between the annual mean wave heights. The models reasonably reproduce the typical values of the 90 %-ile but tend to considerably overestimate the 99 %-ile (by up to 40 % for some years). This is consis-tent with a tendency of the WAM model to overestimate wave heights in severe seas in the southern Baltic (Cie´slikiewicz and Papli˜nska-Swerpel, 2008).
The RS simulations suggest that both 90 % and 99 % per-centiles have slightly increased (by 30 and 74 mm/decade, respectively) since the 1970s. The AW simulations reveal al-most no trend since the 1950s (an increase by 14 mm/decade in the 90 ile and a decrease by 18 mm/decade in the 99 %-ile). Again, none of the discussed trends are statistically sig-nificant.
5 Conclusions and discussion
The wave climate in the Darss Sill area resembles the wave climate in other sub-basins of the Baltic Sea. It exhibits a persistent and substantial seasonal variation in wave heights in a combination of transient fluctuations of the same level on weekly scales over all months. On the one hand, a considerable diurnal variation in the wave height suggests that the seas here are noticeably influenced by coastal ef-fects. A combination of the relatively modest long-term av-erage wave height (0.76 m) and the heights of most typical seas (0.25–0.5 m) with the predominance of relatively short waves is characteristic to the nearshore areas of the Baltic Sea (Soomere, 2008). A specific feature here is the narrow range for typical wave periods (2.6–4 s): much longer waves may frequently occur in other large sub-basins of the Baltic Sea such as the Gulf of Finland, Gulf of Riga or Bothnian Sea. Finally, extreme wave heights of the order ofHS≈4 m once a decade are similar to those that occur in the listed sub-basins. On the other hand, a small fraction of low waves (HS<0.25 m) indicates that the site cannot be considered as a coastal one (in which calm conditions are frequent even at the coasts of the Baltic Proper). The distributions of the oc-currence of different wave heights are also characteristic for the parameters of waves in the open Baltic Sea.
Therefore, it is safe to say that the recorded wave data ex-hibit no indication about any changes in the local wave height over two decades. Analysis of the hindcast data additionally suggests that the wave height has undergone no substantial changes in this area since the 1950s.
The appearance of the measured distribution of wave periods suggests that the measurement site is effectively sheltered from storm waves excited in the Baltic Proper. In particular, the joint distribution of wave heights and periods signifies that the role of remote long-period swell is negligi-ble in this area. This peculiarity may simply reflect the low frequency of strong easterly winds in the Baltic Sea basin (Mietus, 1998). Together with the small size of the sea area it allows for a considerable simplification of the reproduction of wave parameters for engineering applications: in a great many cases the wave height, period and direction are deter-mined by the local wind and fetch length.
Although the discussed wave hindcasts ultimately repre-sent all the main features of the wave climate at the Darss Sill, there is still an urgent need for the improvement of the quality of wave models for this area. The presented data vividly express some of the bottlenecks and bring evidence about others. The differences between the simulated and recorded wave climates are not very striking but still impor-tant. There are significant differences in the average values, in the frequency distributions, in the extreme values and in the long-term trends of several wave parameters. Most no-tably, the long-term significant wave height is systematically over-predicted by both hindcasts. On the one hand, this is to some extent unfortunate because the information inferred about the climatic trends obtained with the discussed hind-casts needs additional verification. On the other hand, the systematic quantification of the discrepancies, a by-product of this study of the wave climate, provides important infor-mation in order to correctly deal with similar wave climate studies.
Some shortcomings of the modelling efforts may have a straightforward solution. While it is not clear how to cor-rectly handle the systematic over-prediction of the longer wave fields, a proper treatment of shorter components is fea-sible. The performed analysis reveals that both wave record-ings and numerical simulations using a standard range of wave frequencies may substantially deform the distribution of shorter periods, especially in the range<3 s. In reality, it is natural to expect a considerable fraction of waves with periods of 2–2.5 s in this and similar sea areas (Zaitseva-P¨arnaste et al., 2009, 2011). This shortage apparently can be removed by increasing the range of frequencies up to∼1 Hz in order to properly resolve short-wave situations. Such an increase would also make it easier to adequately represent the wave growth curves under low winds and after long-term calm situations (Soomere, 2005; Tuomi et al., 2011). The limitations of the waverider are apparently deeper and some other means such as, acoustical sensors (Didenkulova, 2011)
or laser-based devices fixed to offshore platforms, should be used in order to properly resolve the short-wave domain.
In the light of a number of studies that show an increase in the wind speed in the SW Baltic Sea (e.g. Pryor and Barthelmie, 2003) it is remarkable that the analysed data, both measured and hindcast, reveal essentially no changes in the wave heights over the last half-century. This fea-ture demonstrates that wave parameters in semi-sheltered sea areas such as the Baltic Sea depend on the wind parame-ters in a complicated manner and that they frequently are more strongly affected by (changes in) the wind direction (Soomere and R¨a¨amet, 2011b). The reported results sup-port the conjecture that the temporal course in the mean wave height is often decoupled from the course of the mean wind speed (Broman et al., 2006; R¨a¨amet and Soomere, 2011b). Finally, it is interesting to mention that the shift in high wind speeds from November–December to January–March (Lehmann et al., 2011) apparently has largely occurred at the turn of the century or even during the latter decade.
Acknowledgements. This study was supported by the Estonian Science Foundation (grant No. 9125), targeted financing by the Es-tonian Ministry of Education and Research (grant SF0140007s11) and the RADOST project (http://www.klimzug-radost.de/en). The research was partially performed within the framework of the BalticWay project, which is supported by funding from the European Community’s Seventh Framework Programme (FP/2007–2013) under grant agreement No. 217246 made with the joint Baltic Sea research and development programme BONUS. TS is deeply grateful to Alexander von Humboldt Foundation for granting the research stay in the HZG in June–September 2011.
Edited by: A. Sterl
References
Alexandersson, H., Schmith, T., Iden, K., and Tuomenvirta, H.: Long-term variations of the storm climate over NW Europe, Global Atm. Ocean System, 6, 97–120, 1998.
Augustin, J.: Das Seegangsklima der Ostsee zwischen 1958–2002 auf Grundlage numerischer Daten (Sea state climate of the Baltic Sea 1958–2002 based on numerical data), Diploma Thesis, Insti-tute for Coastal Research, GKSS Research Center Geesthacht, Germany, 2005 (in German).
[BACC] The BACC Author Team: Assessment of climate change for the Baltic Sea basin, Reg. Clim. Stud., Springer, Berlin Hei-delberg, 474 pp., 2008.
Barstow, F. B., Haug, O., and van der Vlugt, T.: A field validation of a Directional Waveriders in a SEAWATCH buoy, in: Oceans Engineering for Today’s Technology and Tomorrow’s Preserva-tion (OCEANS 1994), 13–16 Sept. 1994, Brest, France, IEEE, 2, II/32–II/37, doi:10.1109/OCEANS.1994.364011, 1994. Blomgren, S., Larson, M., and Hanson, H.: Numerical modeling of
Broman, B., Hammarklint, T., Rannat, K., Soomere, T., and Vald-mann, A.: Trends and extremes of wave fields in the northeastern part of the Baltic Proper, Oceanologia, 48, 165–184, 2006. Bumke, K. and Hasse, L.: An analysis scheme for determination of
true surface winds at sea from ship synoptic wind and pressure observations, Bound.-Lay. Meteorol., 47, 295–308, 1989. Cie´slikiewicz, W. and Herman, A.: Wave forecasting over the Baltic
Sea and the Gulf of Gda˜nsk using WAM and SWAN models with wind forcing data modelled by ICM, in: Research works based on the ICM’s UMPL Numerical Weather Prediction Sys-tem results, Wydawnictwa Uniwersytetu Warszawskiego, 97– 108, 2002.
Cie´slikiewicz, W. and Papli˜nska-Swerpel, B.: A 44-year hindcast of wind wave fields over the Baltic Sea, Coast. Eng., 55, 894–905, 2008.
Didenkulova, I.: Shapes of freak waves in the coastal zone of the Baltic Sea (Tallinn Bay), Boreal Environ. Res., 16, 138–148, 2011.
Feser, F., Weisse, R., and von Storch., H.: Multi-decadal atmo-spheric modeling for Europe yields multi-purpose data, Eos Transactions, 82, 305–310, 2001.
Gayer, G., G¨unther, H., and Winkel, N.: Wave climatology and ex-treme value analysis for the Baltic Sea area off the Warnem¨unde harbour entrance, Deutsche Hydrogr. Zeitschr., 47, 109–130, 1995.
Jaagus, J. and Kull, A.: Changes in surface wind directions in Esto-nia during 1966-2008 and their relationships with large-scale at-mospheric circulation, Estonian J. Earth Sci., 60, 220–231, 2011. J¨onsson, A., Broman, B., and Rahm, L.: Variations in the Baltic Sea
wave fields, Ocean Eng., 30, 107–126, 2003.
Kahma, K., Pettersson, H., and Tuomi, L.: Scatter diagram wave statistics from the northern Baltic Sea, MERI – Report Series of the Finnish Institute of Marine Research, 49, 15–32, 2003. Kalnay, E., Kanamitsu, M., Kistler, R., Collins, W., Deaven, D.,
Gandin, L., Iredell, M., Saha, S., White, G., Woollen, J., Zhu, Y., Chelliah, M., Ebisuzaki, W., Higgins, W., Janowiak, J., Mo, K., Ropelewski, C., Wang, J., Leetmaa, A., Reynolds, R., Jenne, R., and Joseph, D.: The NCEP/NCAR reanalysis project, Bull. Am. Meteorol. Soc., 77, 437–471, 1996.
Kelpˇsait˙e, L., Herrmann, H., and Soomere, T.: Wave regime differ-ences along the eastern coast of the Baltic Proper, Proc. Estonian Acad. Sci., 57, 225–231, 2008.
Kelpˇsait˙e, L., Dailidien˙e, I., and Soomere, T.: Changes in wave dynamics at the southeastern coast of the Baltic Proper during 1993–2008, Boreal Environ. Res., 16, 220–232, 2011.
Kistler, R., Kalnay, E., Collins, W., Saha, S., White, G., Wollen, J., Chelliah, M., Ebisuzaki, W., Kanamitsu, M., Kousky, V., van den Dool, H., Jenne, R., and Fioriono, M.: The NCEP/NCAR 50-year reanalysis: monthly means CD-ROM and documentation, Bull. Am. Meteorol. Soc., 82, 247–267, 2001.
Komen, G. J., Cavaleri, L., Donelan, M., Hasselmann, K., Hassel-mann, S., and Janssen, P. A. E. M.: Dynamics and modelling of ocean waves, Cambridge University Press, 532 pp., 1994. Lehmann, A., Getzlaff, K., and Harlass, J.: Detailed assessment of
climate variability in the Baltic Sea area for the period 1958 to 2009, Clim. Res., 46, 185–196, 2011.
Lopatukhin, L. I., Bukhanovsky, A. V., Ivanov, S. V., and Tshernyshova, E. S.: Handbook of wind and wave regimes in the Baltic Sea, North Sea, Black Sea, Azov Sea and the
Mediter-ranean, Russian Shipping Registry, St. Petersburg, 450 pp., 2006 (in Russian).
M˚artensson, N. and Bergdahl, L.: On the wave climate of the southern Baltic, Report Series A:15, Department of Hydraulics, Chalmers University of Technology, G¨oteborg, 1987.
Mietus, M.: The climate of the Baltic Sea Basin, Marine meteorol-ogy and related oceanographic activities, Report No. 41, World Meteorological Organisation, Geneva, 64 pp., 1998.
Mietus, M. and von Storch, H.: Reconstruction of the wave climate in the Proper Baltic Basin, April 1947–March 1988, GKSS Re-port 97/E/28, Geesthacht, 1997.
Myrberg, K., Ryabchenko, V., Isaev, A., Vankevich, R., Andrejev, O., Bendtsen, J., Erichsen, A., Funkquist, L., Inkala, A., Neelov, I., Rasmus, K., Rodriguez Medina, M., Raudsepp, U., Passenko, J., S¨oderkvist, J., Sokolov, A., Kuosa, H., Anderson, T. R., Lehmann, A., and Skogen, M. D.: Validation of threedimen-sional hydrodynamic models in the Gulf of Finland based on a statistical analysis of a six-model ensemble, Boreal Environ. Res., 15, 453–479, 2010.
Papli˜nska, B.: Wave analysis at Lubiatowo and in the Pomeranian Bay based on measurements from 1997/1998 – comparison with modelled data (WAM4 model), Oceanologia, 41, 241–254, 1999. Papli˜nska, B.: Specific features of sea waves in the Pomeranian Bay,
Arch. Hydro-Eng. Envir. Mech., 48, 55–72, 2001.
Pettersson, H., Lindow, H., and Schrader, D.: Wave climate in the Baltic Sea 2009. HELCOM Indicator Fact Sheets, 2010, http:// www.helcom.fi/environment2/ifs/en GB/cover/, last accessed: 6 February 2012, 2010.
Pryor, S. C. and Barthelmie, R. J.: Long-term trends in near-surface flow over the Baltic, Int. J. Climatol., 23, 271–289, 2003. Pryor, S. C., Barthelmie, R. J., and Schoof, J. T.: The impact of
non-stationarities in the climate system on the definition of ’a normal wind year’: a case study from the Baltic, Int. J. Climatol., 25, 735–752, 2005.
R¨a¨amet, A. and Soomere, T.: The wave climate and its seasonal variability in the northeastern Baltic Sea, Estonian J. Earth Sci., 59, 100–113, 2010.
R¨a¨amet, A., Suursaar, ¨U., Kullas, T., and Soomere, T.: Reconsid-ering uncertainties of wave conditions in the coastal areas of the northern Baltic Sea, J. Coast. Res., Special Issue 56, 257–261, 2009.
R¨a¨amet, A., Soomere, T., and Zaitseva-P¨arnaste, I.: Variations in extreme wave heights and wave directions in the northeastern Baltic Sea, Proc. Estonian Acad. Sci., 59, 182–192, 2010. Ryabchuk, D., Leont’yev, I., Sergeev, A., Nesterova, E.,
Sukhacheva, L., and Zhamoida, V.: Morphology of sand spits and the genesis of longshore sand waves on the coast of the east-ern Gulf of Finland, Baltica, 24, 13–24, 2011.
Rzheplinsky, G. V.: Wave and wind atlas for the Baltic Sea. Head Office of the Hydrometeorological Services at the Council of Ministers of the USSR, Tallinn, 1965 (in Russian).
Schmager, G., Fr¨ohle, P., Schrader, D., Weisse, R., and M¨uller-Navarra, S.: Sea state, tides, in: State and Evolution of the Baltic Sea 1952–2005, edited by: Feistel, R., Nausch, G., and Was-mund, N., Wiley, Hoboken, New Jersey, 143–198, 2008. Soomere, T.: Wind wave statistics in Tallinn Bay, Boreal Environ.
Res., 10, 103–118, 2005.
Peli-novsky, E. and Kharif, Ch., Springer, 139–157, 2008.
Soomere, T. and Kurkina O.: Statistics of extreme wave conditions in the southwestern Baltic Sea, Fund. Appl. Hydrophys., 4(4), 43–57, 2001 (in Russian).
Soomere, T. and R¨a¨amet, A.: Long-term spatial variations in the Baltic Sea wave fields, Ocean Sci., 7, 141–150, doi:10.5194/os-7-141-2011, 2011a.
Soomere, T. and R¨a¨amet, A.: Spatial patterns of the wave climate in the Baltic Proper and the Gulf of Finland, Oceanologia, 53, 335–371, 2011b.
Soomere, T., Behrens, A., Tuomi, L., and Nielsen, J. W.: Wave conditions in the Baltic Proper and in the Gulf of Finland dur-ing windstorm Gudrun, Nat. Hazards Earth Syst. Sci., 8, 37–46, doi:10.5194/nhess-8-37-2008, 2008.
Soomere, T., Zaitseva-P¨arnaste, I., and R¨a¨amet, A.: Variations in wave conditions in Estonian coastal waters from weekly to decadal scales, Boreal Environ. Res., 16, 175–190, 2011. Sterl, A. and Caires, S.: Climatology, variability and extrema of
ocean waves – the web-based KNMI/ERA-40 wave atlas, Int. J. Climatol., 25, 963–977, 2005.
Tuomi, L., Kahma, K. K., and Pettersson, H.: Wave hindcast statis-tics in the seasonally ice-covered Baltic Sea, Boreal Environ. Res. 16, 451–472, 2011.
Vethamony, P., Aboobacker, V. M., Menon, H. B., Kumar, K. A., and Cavaleri, L.: Superimposition of wind seas on pre-existing swells off Goa coast, J. Mar. Syst., 87, 47–54, 2011.
WASA Group: The WASA project: changing storm and wave cli-mate in the northeast Atlantic and adjacent seas? in: Proc. Fourth International Workshop on Wave Hindcasting and Fore-casting, Banff, Canada, October 16–20, 31–44; also: GKSS Re-port 96/E/61, 1995.
WASA Group: Changing waves and storms in the northeast At-lantic, Bull. Am. Meteorol. Soc., 79, 741–760, 1998.
Weisse, R. and G¨unther, H.: Wave climate and long-term changes for the southern North Sea obtained from a high-resolution hind-cast 1958–2002, Ocean Dyn., 57, 161–172, 2007.
Weisse, R. and von Storch H.: Marine climate and climate change. Storms, wind waves and storm surges, Springer, Berlin, Heidel-berg, 220 pp., 2010.
Weisse, R., von Storch, H., Callies, U., Chrastansky, A., Feser, F., Grabemann, I., G¨unther, H., Pluess, A., Stoye, T., Tellkamp, J., Winterfeldt, J., and Woth, K.: Regional meteorological marine reanalyses and climate change projections: results for Northern Europe and potential for coastal and offshore applications, Bull. Am. Meteorol. Soc., 90, 849–860, 2009.
Zaitseva-P¨arnaste, I., Suursaar, ¨U., Kullas, T., Lapimaa, S., and Soomere, T.: Seasonal and long-term variations of wave con-ditions in the northern Baltic Sea, J. Coast. Res., Special Issue 56, 277–281, 2009.