Differential Response to Stereotactic Radiosurgery in C6
Rat Gliomas
Timothy Pok Chi Yeung1,2,9*, Maher Kurdi3,4
, Yong Wang2, Baraa Al-Khazraji1, Laura Morrison6, Lisa Hoffman1,5,6, Dwayne Jackson1, Cathie Crukley2, Ting-Yim Lee1,2,6,7,8, Glenn Bauman1,8,9, Slav Yartsev1,8,9
1Department of Medical Biophysics, Western University, London, Ontario, Canada, 2Robarts Research Institute, Western University, London, Ontario, Canada, 3Department of Pathology, Western University, London, Ontario, Canada,4Department of Pathology, King Abdulaziz University, Jeddah, Makkah, Saudi Arabia, 5Department of Anatomy and Cell Biology, Western University, London, Ontario, Canada,6Lawson Imaging, Lawson Health Research Institute, London, Ontario, Canada, 7Department of Medical Imaging, Western University, London, Ontario, Canada,8Department of Oncology, Western University, London, Ontario, Canada,9London Regional Cancer Program, London, Ontario, Canada
Abstract
Background:The therapeutic efficacy of stereotactic radiosurgery for glioblastoma is not well understood, and there needs
to be an effective biomarker to identify patients who might benefit from this treatment. This study investigated the efficacy of computed tomography (CT) perfusion imaging as an early imaging biomarker of response to stereotactic radiosurgery in a malignant rat glioma model.
Methods: Rats with orthotopic C6 glioma tumors received either mock irradiation (controls, N= 8) or stereotactic
radiosurgery (N= 25, 12 Gy in one fraction) delivered by Helical Tomotherapy. Twelve irradiated animals were sacrificed four
days after stereotactic radiosurgery to assess acute CT perfusion and histological changes, and 13 irradiated animals were used to study survival. Irradiated animals with survival.15 days were designated as responders while those with survival# 15 days were non-responders. Longitudinal CT perfusion imaging was performed at baseline and regularly for eight weeks post-baseline.
Results:Early signs of radiation-induced injury were observed on histology. There was an overall survival benefit following
stereotactic radiosurgery when compared to the controls (log-rank P,0.04). Responders to stereotactic radiosurgery
showed lower relative blood volume (rBV), and permeability-surface area (PS) product on day 7 post-stereotactic radiosurgery when compared to controls and non-responders (P,0.05). rBV and PS on day 7 showed correlations with
overall survival (P,0.05), and were predictive of survival with 92% accuracy.
Conclusions: Response to stereotactic radiosurgery was heterogeneous, and early selection of responders and
non-responders was possible using CT perfusion imaging. Validation of CT perfusion indices for response assessment is necessary before clinical implementation.
Citation:Yeung TPC, Kurdi M, Wang Y, Al-Khazraji B, Morrison L, et al. (2014) CT Perfusion Imaging as an Early Biomarker of Differential Response to Stereotactic Radiosurgery in C6 Rat Gliomas. PLoS ONE 9(10): e109781. doi:10.1371/journal.pone.0109781
Editor:Qinghui Zhang, University of Nebraska Medical Center, United States of America
ReceivedJuly 7, 2014;AcceptedSeptember 2, 2014;PublishedOctober 17, 2014
Copyright:ß2014 Yeung et al. This is an open-access article distributed under the terms of the Creative Commons Attribution License, which permits unrestricted use, distribution, and reproduction in any medium, provided the original author and source are credited.
Data Availability:The authors confirm that all data underlying the findings are fully available without restriction. All relevant data are within the paper and its Supporting Information files.
Funding:This project was funded by the Brain Tumour Foundation of Canada, the Canadian Institutes of Health Research (T.P.C.Y.), and the Canadian Institutes of Health Research Strategic Training Program in Cancer Research and Technology Transfer. The funders had no role in study design, data collection and analysis, decision to publish, or preparation of the manuscript.
Competing Interests:The author Dr. Ting-Yim Lee licences CT Perfusion software to and receives funding from GE Healthcare. This does not alter the authors’ adherence to PLOS ONE policies on sharing data and materials.
* Email: [email protected]
Introduction
Patients with glioblastoma multiforme, the most common form of adult brain tumors, have a median survival of approximately 12–15 months [1]. Radiotherapy has played an important role in prolonging the survival of these patients since the 1970s [2]. Magnetic resonance (MR) and computed tomography (CT) are currently the standard imaging modalities for assessing treatment
occur in pathophysiological processes that disrupt the blood-brain barrier. For instance, induced injury (e.g. radiation-induced necrosis and pseudoprogression) can mimic the appear-ance of tumor progression on post-gadolinium T1-weighted MR [3].
Due to the poor survival rates, timely and accurate assessment of response to radiation is important as treatment can be altered if a non-responder to radiation can be identified early enough. In preclinical studies, radiotherapy is usually delivered using a technique called stereotactic radiosurgery (SRS). It is delivered in one or a few large dose fractions of 8–30 Gy and results in tumor growth delay and survival benefit [4–7]. Radiotherapy, particularly SRS, can result in vascular damage in the irradiated area [4,8–10], and radiosensitivity of tumor vasculature can augment response to SRS [11].
Hypofractionation radiotherapy that also use a large dose per fraction to treat patients with malignant gliomas is also an attractive treatment strategy. Recently, clinical studies have investigated the use of hypofractionated intensity-modulated radiotherapy to treat these patients [12–14]. Hypofractionation has some advantages over conventional fractionation. Hypofrac-tionation is expected to increase the biological effect of radiation due to increased cell damage resulting from a higher dose per fraction [15]. It also reduces the effect of tumor repopulation by reducing treatment time [16].
Since high-dose per fraction radiotherapy (e.g. SRS and hypofractionated radiotherapy) can result in vascular damage, imaging of tumor perfusion could be a promising biomarker of response to this type of radiation treatment. The C6 rat glioma is a widely used experimental model for the study of malignant glioma [17], including the effects of SRS [6,7,9,10]. Tumor microcircu-lation can be noninvasively evaluated by CT or MR perfusion imaging techniques. Both perfusion techniques acquire repeated CT or MR images in succession after contrast injection; thus, the wash-in and wash-out of the contrast in tissue can be modeled with tracer kinetic analysis. CT perfusion imaging is a method that allows quantitative mapping of blood flow (BF), blood volume (BV), and permeability-surface area product (PS) [18,19]. CT scanners and iodinated contrast agents are also widely available, and they are ubiquitous in radiation oncology departments. The purpose of this study was to evaluate vascular changes following SRS using CT perfusion, and determine whether acute vascular changes within one week of SRS is predictive of survival. In addition, early (four days SRS) and late (eight weeks post-SRS) histopathologic findings were examined.
Materials and Methods
This project was approved by the University Council on Animal
Care (Project#2010-009) at Western University.
C6 Glioma Model
Male Wistar rats weighing 300–400 g (N= 33) were used in this
study (Charles River Canada, age 8 to 10 weeks at surgery). The animals were anaesthetized with 2% isoflurane during all procedures. C6 glioma cells (CCL-107, American Type Culture Collection, Manassas, VA) were cultured in F12k 15% horse serum, 2.5% bovine serum, and 1% penicillin-streptomycin. For the implantation of C6 glioma cells, each animal was secured into a stereotactic surgical frame. After scalp incision at midline and exposing the bregma, a 1 mm diameter burr hole was drilled at
1 mm anterior and 3 mm right of the bregma. A total of 106C6
glioma cells were slowly injected for 5 minutes at a depth of 3– 4 mm from the skull surface, which corresponded to the location
of the caudate putamen [20]. The burr hole was sealed with bone wax, and the scalp was closed with sutures.
Baseline CT Perfusion Imaging
All rats underwent the first CT perfusion scan on an average of 11 days (range, 7–16 days) after implantation of C6 glioma cells to monitor tumor growth and prepare for SRS. The rats were scanned using a clinical CT scanner (Discovery 750 HD, GE Healthcare, Waukesha, WI). A two-phase CT perfusion scan, guided by a prior non-contrast CT scan that identified
1661.25 mm thick sections to cover the entire brain, was
performed for each animal. The brain was scanned with high resolution mode for 32 s at 1.4 s intervals during the first phase and for a period of 165 s at 15 s intervals during the second phase. A bolus of contrast (Isovue, Bracco Diagnostics Inc, Vaughan, Canada, 300 mg iodine/ml, 2.5 mL/kg body weight) was injected into the lateral tail vein at a rate of 0.13 mL/s at 3–4 s after the start of the first phase. The scanning parameters were 80 kVp, 120 mAs, 10 cm field of view, and high-definition bone filter. The visibly distinguishable spatial resolution was 1 line pair per
500mm measured on a rat-size phantom [21].
CT perfusion images of the same slice were averaged over the whole scan duration using the prototype version of CT perfusion 4D (GE Healthcare) to produce a set of contrast-enhanced images called averaged CT images. The tumor diameter on the averaged CT images was measured immediately after the scan. The rats
were assigned randomly to either the control group (N= 8) or the
SRS group (N= 25) once a tumor diameter of 4 mm was reached.
Stereotactic Radiosurgery
A custom-made plastic stereotactic frame was used to secure the animals for treatment planning. A non-contrast helical CT scan was performed (25 cm field-of-view, 80 kV, 110 mAs, 1.25 mm slice thickness) for treatment planning. CT images were trans-ferred to the Helical Tomotherapy Treatment Planning System (Accuray Inc, Madison, WI, USA). Using the averaged CT images for anatomical guidance, a dose of 12 Gy was prescribed to at least 80% of the contrast-enhanced tumor volume with the brainstem receiving no more than 4 Gy and less than 10% of the normal brain receiving more than 8 Gy. Figure S1 shows an example of a treatment plan.
SRS was delivered using version 4.2 Hi-ART Helical Tomotherapy (Accuray Inc., Sunnyvale, CA). The rats were fixed in the same plastic stereotactic frame. A 3.5 MV CT study was acquired prior to treatment and was co-registered with the planning CT study. Then the couch position was shifted in the lateral, anterior-posterior, and superior-inferior directions to correct translational positioning errors. The rats were repositioned in the stereotactic frame if there were rotational positioning errors. The average SRS delivery time was 6 minutes (6 MV, 825 cGy/ min). Rats in the control group were put under anesthesia and secured in the stereotactic frame for 6 minutes to mimic the procedure without radiation.
Follow-up CT Perfusion Imaging
Rats in the SRS group were further assigned to either 1) acute
imaging group (N= 12) or 2) the longitudinal imaging group
(N= 13) (Figure S2). Rats in the acute imaging group were imaged
with CT perfusion at 4 days post-SRS, and were euthanized on the same day. Rats in the longitudinal group and control group were imaged for a maximum of 8 weeks post-SRS to monitor tumor changes and survival. Rats were euthanized if they showed any of
heaviest recorded weight, lethargy, refusal to eat, neurologic signs such as one-sided limb weakness.
Image Analysis
Maps of BF, BV, and PS were generated using the prototype version of CT perfusion 4D (GE Healthcare). The time-attenuation curve (TAC) from the carotid artery was selected as
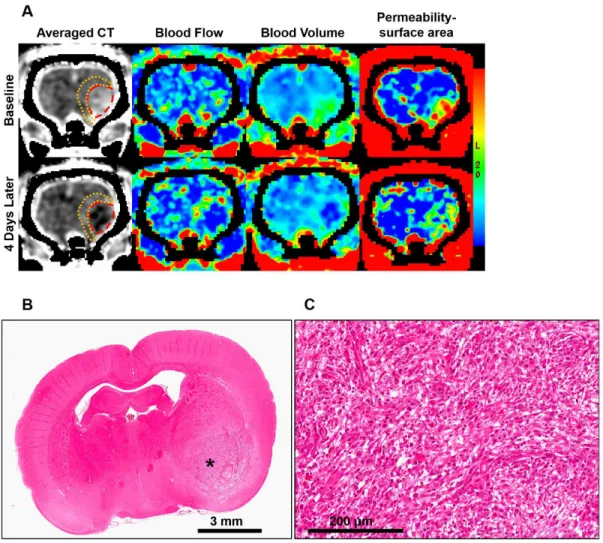
Figure 1. Acute changes after stereotactic radiosurgery (SRS).(A) Acute CT perfusion changes between baseline and the fourth day after SRS. Tumor is outlined in red and the peritumoral region is outlined in orange. For this animal, tumor relative blood flow (rBF) was 1.48 at baseline and it decreased to 0.68 after SRS. Tumor relative blood volume (rBV) decreased from 1.70 to 0.78, while permeability surface-area (PS) decreased from 4.67 to 3.87 ml/min/100g. On the contrary, peritumoral rBF increased from 0.96 to 1.49, rBV increased from 1.06 to 1.52, and PS increased from 2.13 to 3.81 ml/min/100g. (B) Hematoxylin and Eosin (H&E) image of this animal after radiosurgery. Asterisk indicate the location of the tumor. (C) Magnified H&E image of the tumor at the location indicated by the asterisk in (B).
doi:10.1371/journal.pone.0109781.g001
Table 1.Acute changes (6standard error) in CT perfusion parameters.
Percent Change (%)
Regions-of-interest Treatment Tumor volume rBF rBV PS
Tumor SRS 237.3613.2*,##
218.267.9* 223.167.6* 29.269.7
Control 95.1634.7* 213.169.3 26.469.4 7.4615.1
Peritumoral SRS N/A 20.967.9*,# 28.7
67.7**,# 54.3
611.6**
Control N/A 25.065.3 2.065.0 13.9620.2
Abbreviations: SRS, stereotactic radiosurgery; rBF, relative blood flow; rBV, relative blood volume; PS, permeability-surface area product. *Significantly change from baseline atP#0.05 level.
**Significantly change from to baseline atP#0.01 level. #
Percent change significantly different than control animals atP#0.05 level. ##
the arterial input. The arterial TAC was deconvolved with tissue
TACs measured from 262 pixel blocks of CT images using the
Johnson-Wilson model to produce maps of BF, BV, and PS [18,22]. Using the averaged CT images for anatomical guidance, the lesion that was contrast-enhanced before SRS and the same lesion that became non-enhanced after SRS was delineated as the tumor (Figure 1). The region that is 2–3 mm adjacent to the tumor that became contrast-enhanced after SRS was delineated as the peritumoral region. The contralateral normal brain was also delineated. Tumor volume, BF, BV, and PS in the tumor, peritumoral region, and contralateral normal brain were mea-sured. Mean BF and BV values were normalized to the contralateral normal brain to obtain the relative BF (rBF) and relative BV (rBV) values.
Histopathologic Examination
On the same day as the last CT perfusion scan, the animals were euthanized with an overdose of potassium chloride. The animals were perfusion-fixed with phosphate buffered saline followed by 4% paraformaldehyde. The brains were removed and fixed in 4% paraformaldehyde for 24 hours. The brain specimens were sectioned into 3 mm thick blocks,
paraffin-embedded, then sectioned at 5mm. Hematoxylin and eosin stain
(H&E) was applied on each section.
A blinded neuropathology resident (M.K.) examined all H&E slides at different magnifications (20x and 40x) to evaluate histologic signs of radiation damage. The presence of tumor was evaluated as ‘‘no’’, ‘‘yes’’, or ‘‘diminished due to radiation effect’’. ‘‘Yes tumor’’ means the presence of a hypercellular lesion. ‘‘Diminished due to radiation effect’’ means the presence of a circumscribed hypocellular lesion showing features of irradiation.
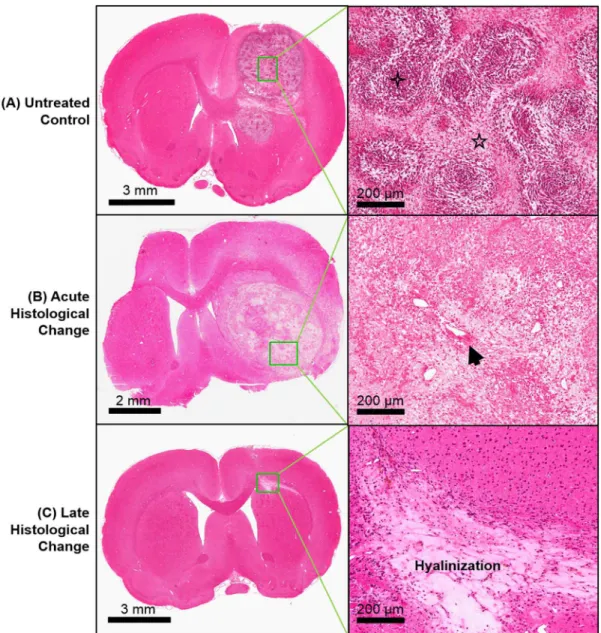
Figure 2. Histological examples of stereotactic radiosurgery (SRS) effects.Representative Hematoxylin & Eosin images of (A) an untreated control, (B) acute histological change at 4 days post-SRS, and (C) late histological change at 59 days post-SRS. Hypercellularity (four point star) and pseudopalisading necrosis (five point star) are classic signs of grade IV glioma, and these were observed in the control animals. Hyalinized blood vessels (arrow) and hypocellularity can be observed shortly after SRS. Regression of tumor and hyalinization of tissue were observed at a later stage after SRS.
‘‘No tumor’’ means the absence of a hypercellular lesion and a hypocellular lesion. The diameter of each lesion (control and SRS-treated animals) was measured. Tumor cellularity was defined as 1) hypercellular when less than 30% of the tumor area appeared pale or major tumor was found, and 2) hypocellular when more than 50% of the tumor area appeared pale excluding necrosis. Tumor was graded based on the World Health Organization criteria [23]. Tumor edema was defined as the presence of extensive intracellular cytoplasmic swelling or intercellular spaces between tumor cells. Peritumoral edema was defined as intracel-lular cytoplasmic swelling or presence of intercelintracel-lular spaces and reactive gliosis in the peritumoral region. Necrosis was described as 1) pseudopalisading necrosis that indicates high-grade glioma, 2) fibrinoid necrosis, or 3) background necrosis (neither pseudopa-lisading nor fibrinoid necrosis) that indicate post-radiation effect. Presence of endothelial hyperplasia was recorded as a feature of angiogenesis in high-grade glioma. Increased vascularity and hyalinzed blood vessels were recorded as features of post-radiation effect. Percentage of animals exhibiting these signs was calculated. Mean percent necrosis by area was also calculated.
The brain sections were also stained with a Cy3-conjugated
mouse monoclonal anti-a-smooth muscle actin (a-SMA) (1:500,
clone 1A4, C6198, Sigma-Aldrich) to identify mature vessels [24– 26]. The slides were scanned using an Aperio ScanScope (Leica Biosystems, Vista, CA), and images were captured using the ImageScope software (version 11.2.0.780, Leica Biosystems, Vista,
CA). The a-SMA positive vessels were qualitatively classified as
intact or fragmented vessels. For each slide,a-SMA positive vessel
density was defined as the number of vessels that stained positive
fora-SMA in 6 separate fields (206) in the most vascular region of
the tumor and peritumoral region. An average of 14 separates fields in the tumor and 14 separate fields in the peritumoral region
were examined for each animal. a-SMA positive vessels were
manually counted using the software JMicroVision [27]. Intact
and fragmented a-SMA positive vessel densities were measured
separately. The percentage of fragmenteda-SMA positive vessels
was also recorded.
Statistical Analysis
The Shapiro-Wilk test was used to test the normality of the data. Temporal changes in the acute imaging group were tested by the Wilcoxon signed-rank test. The end point of the longitudinal imaging group was survival at 8 weeks post-SRS. The longitudinal group was also subdivided into those that survived more than 15 days (responder group), and those that survived less than 15 days post-SRS (non-responder group). The omnibus Kruskal-Wallis test was used for comparisons between groups followed by the
Mann-Whitney U test. The omnibus Friedman test was used for
longitudinal comparisons within-group followed by the Wilcoxon
signed-rank test. All data were reported as mean6standard error
of the mean (SE). Statistical comparisons were performed for the first 4 time points (i.e. day 14 post-SRS) because all controls died
before the 5thtime point (i.e. day 21 post-SRS).
Survival of the groups was compared using the log-rank test. Spearman’s rank correlation was used to assess the associations between different imaging parameters (tumor volume, rBF, rBV,
PS) and the percentage of fragmenteda-SMA positive vessels. PS
is the product between microvessel surface area and permeability, and BV has been shown to correlate with microvessel area [28]. Thus, we used the PS:BV ratio as a surrogate of permeability and
correlated this parameter with the percentage of fragmented a
-SMA positive vessels as well. Correlation between tumor volume measured from averaged CT images and tumor diameter measured from H&E histology was examined.
We investigated whether the imaging parameters correlated with overall survival, and whether these parameters on day 7 post-SRS could predict survival. Each imaging parameter was assessed by applying a threshold that is below the lower 50% confidence interval (CI) boundary of the variations across all treated animals derived from the between-subject variation on day 7 post-SRS. This threshold was used to categorize each animal into two groups (i.e. higher or lower than the threshold). Survivals of the different groups were compared. The sensitivity, specificity, and accuracy of
each parameter in predicting survival were assessed. APvalue#
0.05 was considered statistically significant.
Results
Acute Vascular Changes and Histopathologic Features Irradiated rats received 12 Gy in the tumor and peritumoral region, and different CT perfusion changes were observed in these two regions. After SRS, tumor volume, rBF, and rBV decreased
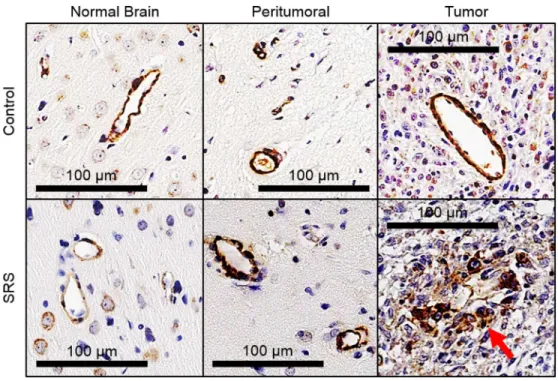
Figure 3.a-smooth muscle actin (a-SMA) positive vessels in the normal brain, peritumoral region, and tumor of a control and a
treated animal after stereotactic radiosurgery (SRS).Intacta-SMA positive vessels were observed in control animals, but fragmented coverage
of vessels bya-SMA is mostly seen in treated animals (red arrow).
doi:10.1371/journal.pone.0109781.g003
Figure 4. Boxplots of intact and fragmenteda-smooth muscle actin (a-SMA) positive vessel densities in (A) peritumoral region and
significantly compared to baseline (P#0.05) while peritumoral
rBF, rBV, and PS increased significantly compared to baseline
(P#0.05) (Table 1). These opposite CT perfusion changes in the
tumor and peritumoral regions are illustrated in Figure 1A. For the control animals, these parameters did not change significantly
from baseline (P.0.05).
H&E histological examination revealed that all tumors were grade IV gliomas. Hypercellularity, mitosis, pseudopalisading necrosis, and endothelial hyperplasia were observed as signs of grade IV glioma in the control animals. For the acute imaging group that received SRS, fibrinoid or background necrosis, increased vascularity, and hyalinized blood vessels were identified. Atypical nuclei, calcification, and gliosis were also observed in
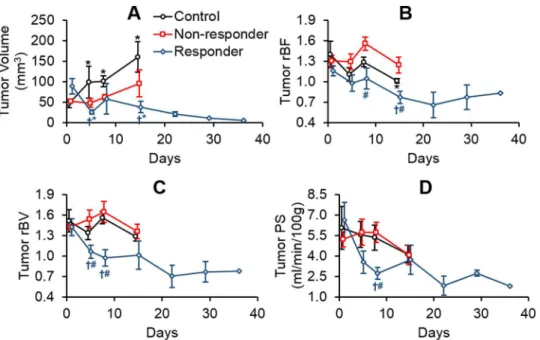
Figure 5. Changes in (A) tumor volume, (B) relative blood flow (rBF), (C) relative blood volume (rBV), and (D) permeability-surface area (PS) in the tumor for controls, responders, and non-responders.*Significantly different from baseline (Friedman test and Wilcoxon-signed rank test).{Significantly different from controls and#significantly different from non-responders (Kruskal-Wallis test followed by Mann-WhitneyUtest).
doi:10.1371/journal.pone.0109781.g005
Figure 6. Changes in (A) relative blood flow (rBF), (B) relative blood volume (rBV), and (C) permeability-surface area product (PS) in the peritumoral region for controls, responders, and non-responders.*Significantly different from baseline (Friedman test and Wilcoxon-signed rank test).{Significantly different from controls (Kruskal-Wallis test followed by Mann-WhitneyUtest).
some lesions. Examples of H&E images of unirradiated tumor and acute effects of SRS are demonstrated in Figure 2A and 2B, respectively. A summary of histological findings is provided in Table 2.
Immunohistochemical staining revealed fragmented a-SMA
positive vessels were identified mostly in the SRS-treated tumors
(Figure 3). Fragmented a-SMA positive vessel densities in the
tumor (P= 0.006) and peritumoral regions (P,0.001) were
significantly higher in the irradiated animals than the control animals (Figure 4). In the tumor, a positive borderline significant
correlation between the percentage of fragmenteda-SMA positive
vessels and PS:BV ratio was identified for the treated animals
(r= 0.58, P= 0.06) while a significant negative correlation was
found for the control animals (r=20.84, P= 0.02, correlation
graphs not shown). However, the amount of fragmenteda-SMA
positive vessels in the controls was very small (Figure 4). In the peritumoral region of the treated animals, negative correlations
were found between the percentage of fragmenteda-SMA positive
vessels with rBF (r=20.62, P= 0.03) and rBV (r=20.58,
P= 0.05).
Treatment Response, Longitudinal Changes, and Late Histopathologic Features
Median survival of the control group was 10 days post-baseline scan (95% CI = 6–14 days), and median survival of the SRS group
was not reached (log-rankP,0.04). However, survival in the SRS
group was heterogeneous with 46% of the animals not surviving for more than 15 days. We designated these relative low survival
animals as non-responders and animals with survival.15 days as
responders. Shapiro-Wilk test showed the imaging data were not
from a normal distribution (P,0.05). Changes in tumor volume,
rBF, rBV, and PS of these three groups are shown in Figure 5. At baseline, there was no statistical difference in tumor volume,
rBF, rBV, and PS (P.0.15). Similarly, there was no statistical
difference in peritumoral rBF, rBV, and PS (P.0.37). Significant
tumor growth was observed in the controls (FriedmanP= 0.001,
Wilcoxon signed-rankP,0.03). Significant tumor shrinkage was
observed in the responders (FriedmanP= 0.04, Wilcoxon
signed-rankP,0.05). There was no significant tumor volume change in
the non-responders. Tumor rBF in the responders was significantly lower than the non-responders and controls on day 14 post-SRS
(Kruskal-WallisP= 0.01, Mann-Whitney UP,0.04). Tumor rBV
in responders were significantly lower than the non-responders
and controls on day 4 (Kruskal-WallisP= 0.04, Mann-Whitney U
P,0.04) and day 7 post-SRS (Kruskal-Wallis P= 0.01,
Mann-Whitney U P= 0.01). Responders’ tumor PS was significantly
lower than the other groups on day 7 post-SRS (Kruskal-Wallis
P= 0.007, Mann-Whitney U P#0.008). Between-group
differ-ences and longitudinal changes in PS:BV ratio in the tumor were not significant.
Figure 6 shows an elevation in peritumoral rBF in both responders and non-responders on days 4 and 7 post-SRS
compared to the controls (Kruskal-Wallis P#0.006,
Mann-Whitney U P#0.008). Significant elevation was observed in
peritumoral rBV of responders when compared to controls
(Kruskal-Wallis P,0.01, Mann-Whitney U P= 0.001), and a
similar trend was observed for peritumoral PS albeit not significant. This elevation in CT perfusion parameters eventually
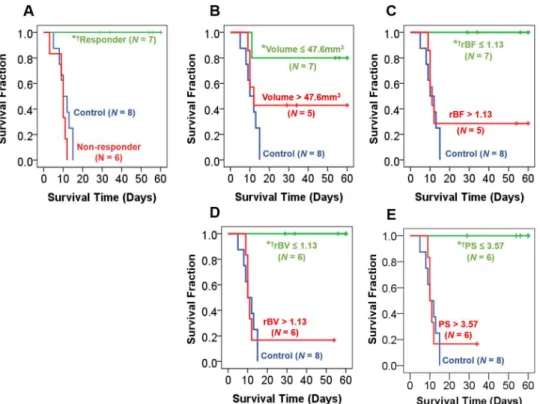
Figure 7. Kaplan-Meier plots of survival categorized by (A) response (B) tumor volume, (C) relative blood flow (rBF), (D) relative blood volume (rBV), and (E) permeability-surface area product (PS).For each imaging parameter, two response groups were identified based on whether the measured value was#lower 50% confidence interval of variations across all treated animals derived from the between-subject variation on day 7 post-SRS. Those that met this criteria were ranked as ‘‘low’’ by applying this threshold, and the others were ranked as ‘‘high’’. Animals with low rBF, rBV, and PS on day 7 post-SRS showed significantly longer survival than the rest of the treated animals (i.e. high rBF, rBV, and PS) and control animals. *Significantly different from control group.{Significantly different from the other treated animals with a ‘‘high’’ value. Significant atP#0.02 level (log-rank test).
dissipated with time. Between-group differences and longitudinal changes in PS:BV ratios in the peritumoral region were not significant.
Histological examination revealed no presence of tumor in any of the responders. Increased vascularity was the major sign of late radiation-induced histologic change in the responders (Table 2). Figure 2C shows an example of late radiation-induced damage after the regression of the tumor. For the non-responders, tumors were detected on H&E histology; pseudopalisading necrosis was the major type of necrosis observed. Increased vascularity, endothelial hyperplasia, and hyalinized blood vessels were also observed. The correlations between tumor volume measured from averaged CT and tumor diameter measured from H&E histology
were 0.88 (P= 0.01) for controls and 0.77 (P= 0.05) for
non-responders (P= 0.01). No tumor was identified on both averaged
CT images and H&E histology for the responders.
Early Prediction of Survival after Stereotactic Radiosurgery
Tumor volume, rBF, rBV, PS, and PS:BV ratio at baseline and on day 4 post-SRS did not correlate with overall survival.
However, tumor rBV (r=20.61, P,0.05) and PS (r=20.85,
P= 0.001) on day 7 post-SRS correlated with overall survival. We
evaluated whether each of the imaging parameter was predictive of overall survival by grouping the treated animals based on the measurement on day 7 post-SRS. Kaplan-Meier survival plots are shown in Figure 7. SRS-treated animals with lower tumor rBF, rBV, and PS had significantly longer survival than SRS-treated
animals with higher rBF, rBV, and PS (log-rankP#0.02). Treated
animals with smaller tumor volumes were associated with longer survival than those with larger tumor volumes, but this was not significant. Similarly, animals with a low PS:BV ratio were not associated with significantly different survival than those with high PS:BV ratio (graph not shown). In terms of predictive perfor-mance, both rBV and PS had the highest sensitivity (86%), specificity (100%), and accuracy (92%). rBF had a sensitivity, specificity, and accuracy of 71%, 100%, and 83%, respectively. Tumor volume had a sensitivity, specificity, and accuracy of 57%, 80%, and 67%, respectively. The PS:BV ratio had sensitivity, specificity, and accuracy of 67%, 60%, and 64%, respectively.
Discussion
Although radiotherapy offers an overall survival benefit at the population level, accurate assessment of tumor response for each patient is crucial for treatment modification if no response to radiation is detected. Therefore, we need to develop non-invasive imaging biomarkers as early indicators of response to radiation.
From preclinical studies, overall survival benefits post-SRS are commonly reported, with some treated animals surviving substan-tially longer than others [4–6]. In our study, SRS demonstrated an overall survival benefit and histological confirmation of radiation-induced damage. This survival benefit is consistent with previously published studies [4–6]. Similar to previous studies, we observed substantial heterogeneity in treatment response. We found that CT perfusion can be a potential noninvasive imaging method to predict response to SRS and that rBF, rBV, and PS showed better predictive performance of survival than tumor volume.
In clinical studies, the survival benefit of SRS in combination with fractionated radiotherapy is unclear with some studies suggesting a 2-year overall survival benefit [29,30], while randomized trials showed that SRS did not confer a survival benefit over fractionated radiotherapy alone [31,32]. Current clinical evidence from fractionated radiotherapy support our
preclinical results in that a higher rBV after the completion of radiotherapy is associated with poor survival [33,34]. However, the correlation between survival post-SRS and perfusion imaging parameters is lacking in the clinical literature, and there is no imaging biomarker to assess patients who might respond to SRS. Our results provide corroborating evidence to support the hypothesis that CT perfusion is an early biomarker of response to SRS. Use of CT perfusion parameters to characterize tumor vascular profiles and correlate with treatment response might identify patients who would benefit from SRS or hypofractiona-tion treatment schemes. The use of an early imaging biomarker to assess response to SRS or hypofractionated treatment schemes in randomized clinical trials might better define the role of altered fractionation schemes in this group of patients.
From the acute imaging study, PS did not correlate with the
percentage of fragmented a-SMA positive vessels, this could
because PS is the product between permeability and surface area of the endothelium [18]. Since BV has been shown to correlate with microvessel area [28], we investigated the PS:BV ratio as a surrogate marker of permeability. After SRS, a positive correlation
between PS:BV and the percentage of fragmenteda-SMA positive
vessels points to the effect of radiation on the permeability of the blood-tumor barrier. Vessels that are covered by SMA are mature vessels [24–26], and tumor vessel maturity is associated radiation resistance [8,35–36]. From our survival study, it is the permeabil-ity-surface area product (PS) that correlated with survival and not the surrogate of permeability (i.e. PS:BV ratio). This suggests a high surface area of SMA coverage after SRS is associated with poor survival. Together, this points to a possible link between the vessel SMA coverage and survival. We were unable to show a correlation between survival and SMA coverage of mature vessels directly since any assessment of tumor vessels would require the sacrifice of animals. Further investigation into the direct associ-ations between tumor PS and SMA coverage of mature vessels with tumor response is warranted.
It is important to study the effect of radiation on the adjacent normal brain tissue (i.e. peritumoral region) because it is usually included in the irradiated volume that receives a significant dose of radiation in clinical practice, particularly for linear accelerator-based SRS. Complications and radiation-induced changes of brain tissue, such as edema and blood-brain barrier breakage, after SRS of arteriovenous malformations correlated with the volume of irradiated tissue that received 12 Gy [37–38]. The effect of SRS on peritumoral normal brain region in malignant glioma is not well understood and seldom reported [10]. Zawaski et al. showed that radiation caused significant changes in permeability and leuko-cyte-endothelial interactions in the peritumoral normal brain, which were indicative of acute inflammatory reaction and radiation-induced astrogliosis. Our study provides supporting evidence by showing an increase in blood-brain barrier PS in the peritumoral region. Therefore, a decrease in tumor rBF, rBV, and PS in the tumor could indicate treatment response, an increase in these parameters in the peritumoral region could be indicative of acute radiation-induced inflammation.
non-responders have died after the fourth CT perfusion scan. Thus, we could not compare the imaging data between these groups at later time points. Longitudinal tumoral and peritumoral changes between the control animals, responders, and non-responders at time points after day 21 post-SRS could be assessed if a larger sample size was available. Finally, while we used stereotactic techniques for radiation of the tumors, treatment volumes were still large relative to the size of the rat brain with the irradiated volume encompassing the ipsilateral cerebral hemisphere. Thus, the volume of normal brain irradiated was larger than would be the case in clinical radiosurgery treatments. It is possible that these volume differences have contributed to the perfusion changes seen in the peritumoral region.
Conclusions
This study showed that CT perfusion is a candidate to be an early biomarker of response to SRS. A CT perfusion imaging study in the clinical setting would potentially allow for timely and accurate assessment of early response to radiosurgery. It could help understand the role of SRS in these patients and also in combination with anti-angiogenic therapies. Evaluation of CT
perfusion imaging in prospective clinical studies are necessary to validate this technique as a predictive assay.
Supporting Information
Figure S1 Example of a treatment plan.The tumor and the 15, 12, and 8 Gy isodose lines are shown in the (A) coronal, (B) axial, and (C) sagittal planes.
(TIF)
Figure S2 Experiment flowchart. (TIF)
Acknowledgments
We thank Dr. Trevor Shepard for the use of his ScanScope.
Author Contributions
Conceived and designed the experiments: TPCY MK LH DJ TYL GB SY. Performed the experiments: TPCY BAK LM CC LH SY. Analyzed the data: TPCY MK YW. Contributed reagents/materials/analysis tools: DJ LH TYL. Contributed to the writing of the manuscript: TPCY MK TYL GB SY.
References
1. Wen PY, Kesari S (2008) Malignant gliomas in adults. N Engl J Med 359: 492– 507.
2. Walker MD, Strike TA, Sheline GE (1979) An analysis of dose-effect relationship in the radiotherapy of malignant gliomas. Int J Radiat Oncol Biol Phys 5: 1725– 1731.
3. Wen PY, Macdonald DR, Reardon TF, Cloughesy TF, Sorensen AG, et al. (2010) Updated response assessment criteria for high-grade gliomas: Response assessment in neuro-oncology working group. J Clin Oncol 28: 1963–1972. 4. Hong X, Liu L, Wang M, Ding K, Fan Y, et al. (2014) Quantitative
multiparametric MRI assessment of glioma response to radiotherapy in a rat model. Neuro Oncol 16: 856–867.
5. Schuuring J, Bussink J, Bernsen HJ, Peeters W, van Der Kogel AJ (2005) Irradiation combined with SU5416: microvascular changes and growth delay in a human xenograft glioblastoma tumor line. Int J Radiat Oncol Biol Phys 61: 529–534.
6. Kondziolka D, Somaza S, Comey C, Lunsford LD, Claassen D, et al. (1996) Radiosurgery and fractionated radiation therapy: comparison of different techniques in an in vivo rat glioma model. J Neurosurg 84: 1033–1038. 7. Kondziolka D, Lunsford LD, Claassen D, Pandalai S, Maitz AH, et al. (1992)
Radiobiology of radiosurgery: Part II. The rat C6 glioma model. Neurosurgery 31: 280–287.
8. Park HJ, Griffin RJ, Hui S, Levitt SH, Song CW (2012) Radiation-induced vascular damage in tumors: implications of vascular damage in ablative hypofractionated radiotherapy (SBRT and SRS). Radiat Res 177: 311–327. 9. Guan LM, Qi XX, Xia B, Li ZH, Zhao Y, et al. (2011) Early changes measured
by CT perfusion imaging in tumor microcirculation following radiosurgery in rat C6 brain gliomas. J Neurosurg 114: 1672–1680.
10. Zawaski JA, Gaber MW, Sabek OM, Wilson CM, Duntsch CD, et al. (2012) Effects of irradiation on brain vasculature using an in situ tumor model. Int J Radiat Oncol Biol Phys 82: 1075–1082.
11. Garcia-Barros M, Paris F, Cordon-Cardo C, Lyden D, Rafii S, et al. (2003) Tumor response to radiotherapy regulated by endothelial cell apoptosis. Science 300: 1155–1159.
12. Iuchi T, Hatano K, Kodama T, Sakaida T, Yokoi S, et al. (2014) Phase 2 trial of hypofractionated high-dose intensity modulated radiation therapy with concur-rent and adjuvant temozolomide for newly diagnosed glioblastoma. Int J Radiat Oncol Biol Phys 88: 793–800.
13. Yoon SM, Kim JH, Kim SJ, Khang SK, Shin SS, et al. (2013) Hypofractionated intensity-modulated radiotherapy using simultaneous integrated boost technique with concurrent and adjuvant temozolomide for glioblastoma. Tumori 99: 480– 487.
14. Reddy K, Gaspar LE, Kavanagh BD, Waziri A, Damek DM, et al. (2013) Prospective evaluation of health-related quality of life in patients with glioblastoma multiforme treated on a phase II trial of hypofractionated IMRT with temozolomide. J Neurooncol 114: 111–116.
15. Hingorani M, Colley WP, Dixit S, Beavis AM (2012) Hypofractionated radiotherapy for glioblastoma: strategy for poor-risk patients or hope for the future? Br J Radiol 85: e770–e781.
16. Wang JZ, Li XA (2005) Impact of tumor repopulation on radiotherapy planning. Int J Radiat Oncol Biol Phys 61: 220–227.
17. Grobben B, De Deyn PP, Slegers H (2002) Rat C6 glioma as experimental model system for the study of glioblastoma growth and invasion. Cell Tissue Res 310: 257–270.
18. Lee TY, Purdie TG, Stewart E (2003) CT imaging of angiogenesis. Q J Nucl Med 47: 171–187.
19. Cenic A, Nabavi DG, Craen RA, Gelb AW, Lee TY (2000) A CT method to measure hemodynamics in brain tumors: validation and application of cerebral blood flow maps. AJNR Am J Neuroradiol 21: 462–470.
20. Paxinos G and Watson C (2007) The rat brain: In stereotaxic coordinates 6th ed. Burlington: Academic Press.
21. Du LY, Umoh J, Nikolov HN, Pollmann SI, Lee TY, et al. (2007) A quality assurance phantom for the performance evaluation of volumetric micro-CT systems. Phys Med Biol 52: 7087–7108.
22. Johnson JA, Wilson TA (1966) A model for capillary exchange. Am J Physiol 210: 1299–1303.
23. Louis DN, International Agency for Research on Cancer (2007) WHO classification of tumours of the central nervous system. Lyon: International Agency for Research on Cancer.
24. Burrell JS, Walker-Samuel S, Baker LC, Boult JK, Jamin Y, et al. (2012) Evaluation of novel combined carbogen USPIO (CUSPIO) imaging biomarkers in assessing the antiangiogenic effects of cediranib (AZD2171) in rat C6 gliomas. Int J Cancer 131: 1854–1862.
25. Gilead A, Meir G, Neeman M (2004) The role of angiogenesis, vascular maturation, regression and stroma infiltration in dormancy and growth of implanted MSL ovarian carcinoma spheroids. Int J Cancer 108: 524–531. 26. Abramovitch R, Dafni H, Smouha E, Benjamin LE, Neeman M (1999) In vivo
prediction of vascular susceptibility to vascular endothelial growth factor withdrawal: Magnetic resonance imaging of C6 rat glioma in nude mice. Cancer Res 59: 5012–5016.
27. Roduit N. JMicroVision: Image analysis toolbox for measuring and quantifying components of high-definition images. Version 1.2.7. Available: http://www. jmicrovision.com. Accessed December 20, 2013.
28. Hu LS, Eschbacher JM, Dueck AC, Heiserman JE, Liu S, et al. (2012) Correlations between perfusion MR imaging cerebral blood volume, microvessel quantification, and clinical outcome using stereotactic analysis in recurrent high-grade glioma. AJNR Am J Neuroradiol 33: 69–76.
29. Sarkaria JN, Mehta MP, Loeffler JS, Buatti JM, Chappell RJ, et al. (1995) Radiosurgery in the initial management of malignant gliomas: survival comparison with the RTOG recursive partitioning analysis. Radiation Therapy Oncology Group. Int J Radiat Oncol Biol Phys 32: 931–941.
30. Mehta MP, Masciopinto J, Rozental J, Levin A, Chappell R, et al. (1994) Stereotactic radiosurgery for glioblastoma multiforme: report of a prospective study evaluating prognostic factors and analyzing long-term survival advantage. Int J Radiat Oncol Biol Phys 30: 541–549.
31. Tsao MN, Mehta MP, Whelan TJ, Morris DE, Hayman JA, et al. (2005) The American Society for Therapeutic Radiology and Oncology (ASTRO) evidence-based review of the role of radiosurgery for malignant glioma. Int J Radiat Oncol Bio Phys 63: 47–55.
Therapy Oncology Group 93-05 protocol. Int J Radiat Oncol Biol Phys 60: 853–860.
33. Mangla R, Singh G, Ziegelitz D, Milano MT, Korones DN, et al. (2010) Changes in relative cerebral blood volume 1 month after radiation-temozolo-mide therapy can help predict overall survival in patients with glioblastoma. Radiology 256: 575–584.
34. Gahramanov S, Muldoon LL, Varallyay CG, Li X, Kraemer DF, et al. (2013) Pseudoprogression of glioblastoma after chemo- and radiation therapy: Diagnosis by using dynamic susceptibility-weighted contrast-enhanced perfusion MR imaging with ferumoxytol versus gadoteridol and correlation with survival. Radiology 266: 842–852.
35. Grabham P, Hu B, Sharma P, Geard C (2011) Effects of ionizing radiation on three-dimensional human vessel models: differential effects according to radiation quality and cellular development. Radiat Res 175: 21–28. 36. Sabatasso S, Laissue JA, Hlushchuk R, Graber W, Bravin A, et al. (2011)
Microbeam radiation-induced tissue damage depends on the stage of vascular maturation. Int J Radiat Oncol Biol Phys 80: 1522–1532.
37. Levegru¨n S, Hof H, Essig M, Schlegel W, Debus J (2004) Radiation-induced changes of brain tissue after radiosurgery in patients with arteriovenous malformations: correlation with dose distribution parameters. Int J Radiat Oncol Biol Phys 59: 796–808.
38. Flickinger JC, Kondziolka D, Lunsford LD, Kassam A, Phuong LK, et al. (2000) Development of a model to predict permanent symptomatic postradiosurgery injury for arteriovenous malformation patients. Arteriovenous Malformation Radiosurgery Study Group. Int J Radiat Oncol Biol Phys 46: 1143–1148. 39. Romanelli P, Conti A, Pontoriero A, Ricciardi GK, Tomasello F, et al. (2009)
Role of stereotactic radiosurgery and fractionated stereotactic radiotherapy for the treatment of recurrent glioblastoma multiforme. Neurosurg Focus 27: E8. 40. Wang J, Hu L, Gupta N, Shamseldin T, Ozawa T, et al. (1999) Induction and